Sep 1, 2026 Share From Caribbean destinations and Alaska lodges to European cruise terminals, a look at the local initiatives creating positive impact across the company’s owned and operated portfolio. A cruise vacation is defined as much by what…
Sep 1, 2026
Share
From Caribbean destinations and Alaska lodges to European cruise terminals, a look at the local initiatives creating positive impact across the company’s owned and operated portfolio.
A cruise vacation is defined as much by what happens on land as by what happens at sea. Across Carnival Corporation’s owned and operated destinations, ports and lodges around the world, the company is working alongside local communities to generate renewable energy, conserve water, reduce waste and help protect natural ecosystems.
Caribbean Care
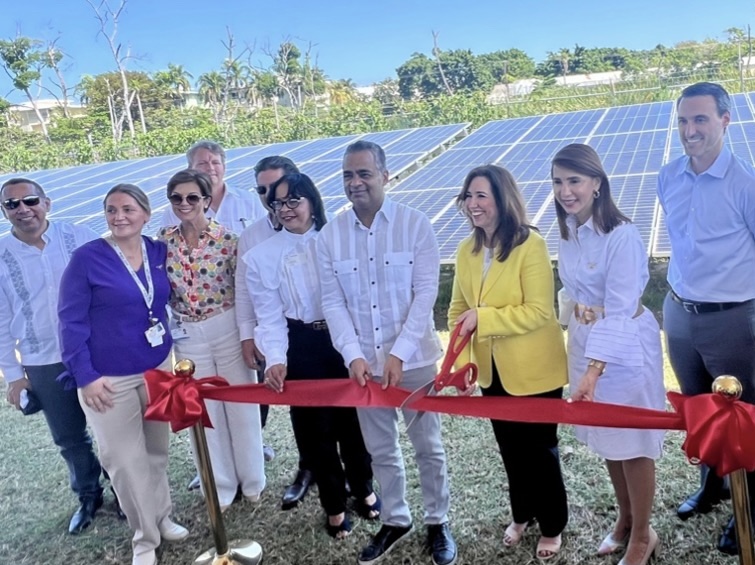
The world tour begins in the Caribbean, where Carnival Corporation’s exclusive destinations are examples of how environmental initiatives can support both operations and the surrounding communities. Solar installations at Amber Cove in the Dominican Republic, Isla Tropicale in Honduras and Puerta Maya in Mexico harness sunlight to generate renewable electricity that helps power daily port operations. At Isla Tropicale, the solar park now supplies 60-70% of the destination’s energy needs, while similar projects at Puerta Maya and Amber Cove continue expanding the company’s renewable energy footprint.
Across the Caribbean, Carnival Corporation’s Less Left Over strategy is put into action by reducing food waste and finding creative ways to give resources a second life, creating benefits for both local communities and the environment. At Amber Cove, 24 tons of food waste were repurposed as livestock feed for local farmers in 2025 rather than sent to a landfill. At Puerta Maya and Isla Tropicale, organic materials are transformed into compost that supports landscaping, reforestation efforts and local agricultural use, contributing to more responsible resource use and waste reduction.
Some of the most impactful efforts happen beyond the destination gates. In Maimón, Dominican Republic, Carnival Corporation partnered with local government leaders and environmental organizations to support the Zero Waste initiative. The program combines community education, waste collection and composting efforts designed to reduce landfill waste and strengthen long-term management practices. As the program has grown, neighboring communities have begun exploring how similar approaches could be adapted locally.
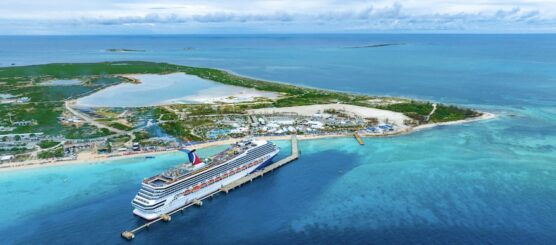
Further north in Grand Bahama, sustainability is woven into the development of Celebration Key. Thousands of locally sourced trees and plants are incorporated into the destination through the “Plant a Tree” initiative, supporting local growers while helping showcase the island’s natural beauty. These include 5,000 palms, around 2,200 coconut sprouts and 500 native groundcovers planted onsite. The company even saved and replanted nearly 1,000 native sabal palms that stood through Hurricane Dorian and still bear marks from past fires, making them living symbols of Grand Bahama’s resilience.
The project has also included mangrove preservation efforts that support coastal resilience and local habitat areas, along with the preservation and replanting of native sabal palms throughout the property.
“When we invest in a destination, we want that investment to generate long-term value for the community during construction and operations,” said Renata Ribeiro, SVP of strategic operations at Carnival Corporation. “That means working alongside local partners, supporting environmental stewardship and helping ensure these communities continue to thrive for generations to come.”
Behind the scenes, investments in water production, wastewater treatment and waste management systems across the company’s Caribbean destinations help create the infrastructure needed to operate responsibly while protecting the natural resources these communities depend on. The efforts reflect Carnival Corporation’s Every Drop Counts strategy, focused on conserving water, reclaiming resources and making the most of every drop.
Protecting the Last Frontier
Thousands of miles away, the landscape changes dramatically as the turquoise waters and palm-lined shores of the Caribbean give way to Alaska’s glaciers, rivers and wilderness. Here, Carnival Corporation’s sustainability efforts focus on safeguarding some of the world’s most sensitive natural environments. At Copper River Princess Wilderness Lodge, food scraps are sent to pig farms, supporting the local farming community while diverting waste. At the Denali Princess Wilderness Lodge and Holland America Denali Lodge, advanced wastewater treatment systems help ensure water used throughout the properties is treated before being returned to the environment, supporting the protection of nearby waterways while serving thousands of visitors each season.
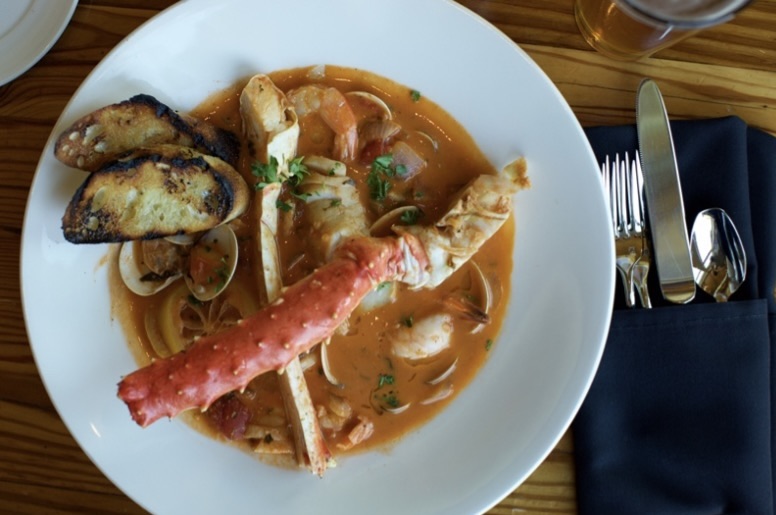
The company’s commitment to responsible tourism also extends to its food supply, and in a region synonymous with seafood, how it is sourced matters. In 2024, Holland America Line became the first global cruise line to achieve Marine Stewardship Council (MSC) certification, affirming the company’s commitment to serving sustainably managed and harvested seafood. In 2025, the Holland America Princess rail division and all company-owned Alaska lodges also earned MSC certification, reinforcing that commitment to maintaining and protecting healthy marine ecosystems.
Renewable Energy Meets Historic Ports
Crossing the Atlantic to Europe reveals another side of the sustainability story. At Carnival Corporation’s cruise terminals in Barcelona, one of the world’s most visited cruise ports, renewable energy is becoming an increasingly visible part of day-to-day operations.
More than 1,300 solar panels installed across the Palacruceros and Helix Cruise Center terminals generated over 450 megawatt-hours of renewable electricity in 2025. The systems supplied a significant portion of terminal energy needs, with excess power at certain times exported back to the local electrical grid, demonstrating how sustainability solutions can integrate into one of Europe’s most historic maritime gateways.
Innovation from Coast to Coast
The final stop returns to the United States, where collaboration is helping reshape the future of cruise infrastructure. Princess Cruises, in partnership with the City and Borough of Juneau and Alaska Electric Light and Power, developed the world’s first shore-power-equipped cruise ship dock. At PortMiami, Carnival Corporation partnered with Miami-Dade County, Florida Power & Light Company and industry partners to support the development of shore power capabilities, helping make the port the first major cruise port on the U.S. East Coast to offer shore power connections at multiple berths. The technology enables ships to connect to local electrical power while docked, reducing emissions from operating engines while in port.
“The destinations in our portfolio are as unique as the communities and environments that surround them, which is why there is no one-size-fits-all approach to sustainability,” said Damian Rudich, VP of destination operations at Carnival Corporation. “From renewable energy and making every drop count to habitat restoration and waste reduction, we’re focused on making investments that reflect local needs and create lasting value for the places our guests love to visit.”