Third Quarter Results
Bull 5
Bear 0
Results
AMBQ
|
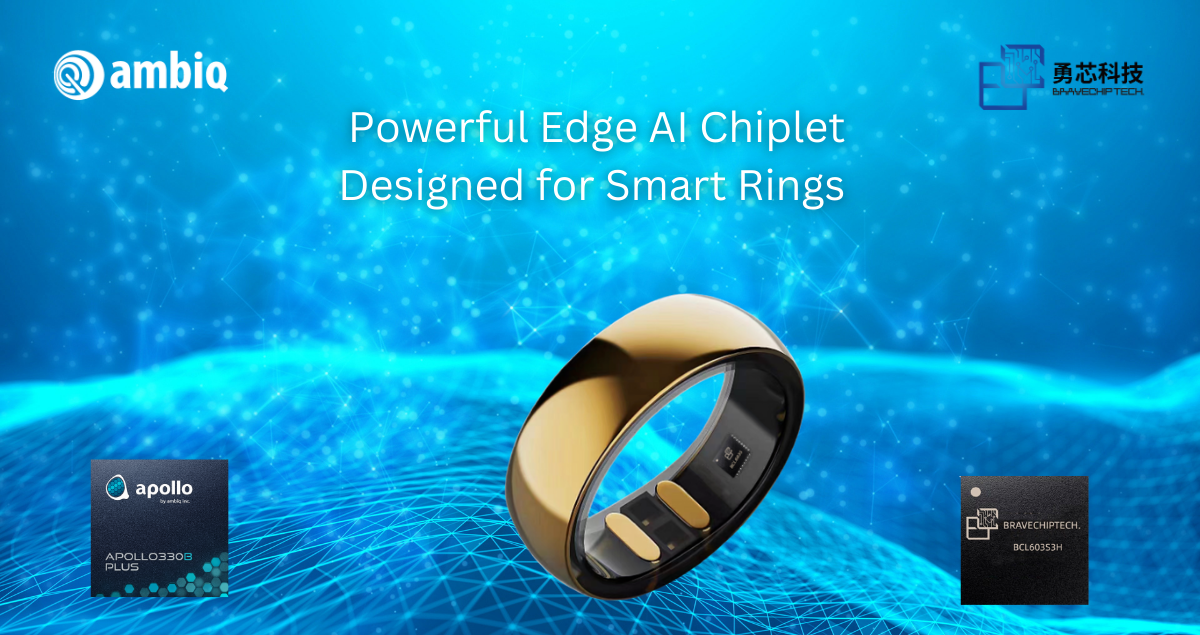
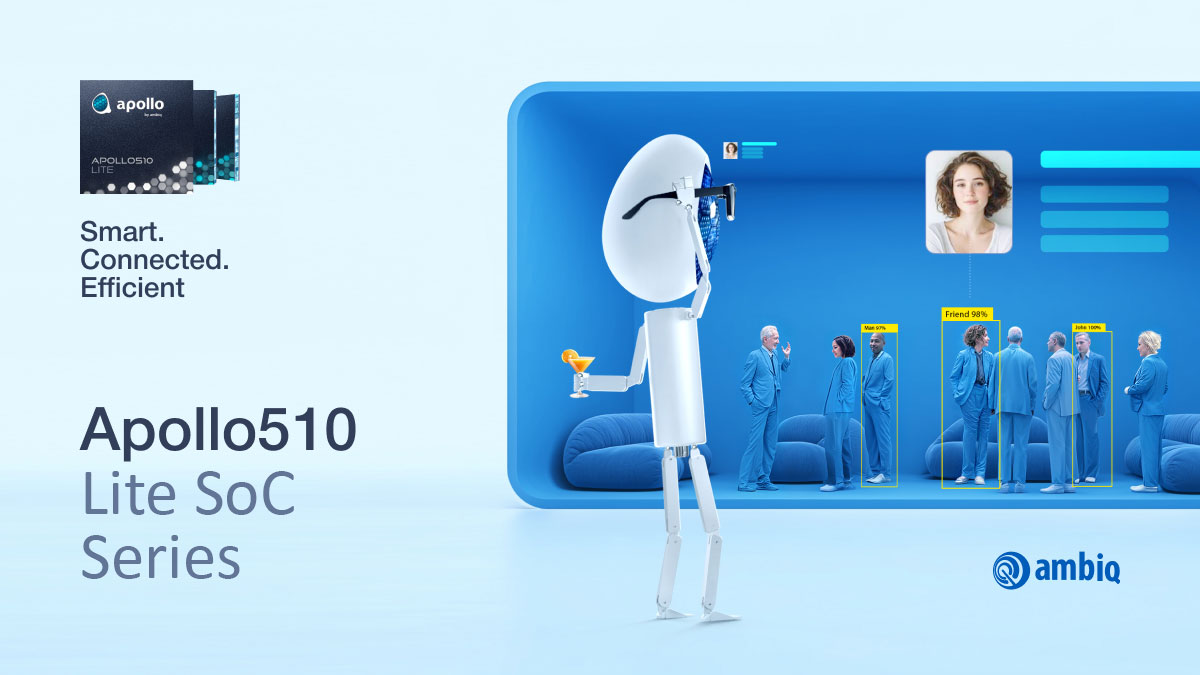
Ambiq Micro, Inc. is a semiconductor company that designs ultra-low power systems-on-chip (SoCs) and software solutions for edge AI applications. The company’s core technology is the Sub-threshold Power Optimized Technology (SPOT) platform, which enables devices to operate with significantly reduced power consumption compared to conventional designs. Its product portfolio includes the Apollo family of SoCs for general and AI compute, and the Atomiq family, which is in development for high-performance edge AI acceleration. Ambiq provides a full-stack software ecosystem, including the AmbiqSuite SDK, neuralSPOT for AI development, and specialized modules for graphics, Bluetooth, and security. The company serves markets such as wearables, smart home, healthcare, industrial automation, and augmented reality. Ambiq sells its products through a direct sales force and a global network of distributors, targeting customers in the United States, Europe, and Asia. The company was founded in 2010. Summarised from the company's own disclosures, fiscal year ended Mar 2026 |
Industry Semiconductors | Homepage ambiq.com |
| Sector Technology | IR page ir.ambiq.com/overview/default.aspx | |
|
Tags
edge ai, ultra-low power, systems-on-chip, sub-threshold technology, wearables, iot, embedded software, ai accelerators, smart home, healthcare electronics, SPOT, Apollo, Apollo3, Apollo4, Apollo5, Atomiq, AmbiqSuite SDK, neuralSPOT, graphiqSPOT, blueSPOT, secureSPOT, Helia, heliaAOT, Ambiq heartKIT
|
Press page ambiq.com/news |
Metrics
| Valuation | |
|---|---|
| Market cap | $ 1.087B |
| Market cap (USD) | $ 1.087B |
| P/E | -9.70 |
| PEG | — |
| P/BV | 2.68 |
| P/S | 14.98 |
| P/OCF | -55.19 |
| P/FCF | -40.05 |
| Dividend yield | — |
| Turnover / mcap | — |
| Returns | |
|---|---|
| ROE | -29.4% |
| ROI | -162.3% |
| ROIC | -132.0% |
| Profit margin | -50.3% |
| Growth | |
|---|---|
| Revenue growing | No |
| Profits growing | Yes |
| Revenue up 3y | — |
| Revenue up 5y | — |
| Earnings growth 3y (net profit CAGR) | — |
| Quality | |
|---|---|
| Profitable | No |
| Margin expanding | No |
| Buying back stock | No |
| Diluting (TTM) | Yes |
| Debt/Equity | — |
| Podcast bulls (TTM) | Sign up |
| Podcast bears (TTM) | Sign up |
| Podcast sentiment (TTM) | Sign up |
| Podcast sentiment % (TTM) | Sign up |
| News sentiment (TTM) | 28 |
| Quality score | -56.3% |
| Insiders | |
|---|---|
| Buys, 1w | Sign up |
| Buys, 1m | Sign up |
| Buys, 1y | Sign up |
| Sells, 1w | Sign up |
| Sells, 1m | Sign up |
| Sells, 1y | Sign up |
Sign up to see this company's insider trades
| Figure | FY 2025 | FY 2024 | FY 2023 | FY 2021 | FY 2020 |
|---|---|---|---|---|---|
| Revenue | 72.514M | 76.067M | 65.537M | 91.008M | 50.974M |
| Net profit | -36.461M | -39.661M | -50.332M | -25.342M | -25.221M |
| Free cash flow | -27.133M | -25.159M | -29.979M | -57.504M | -39.231M |
| Figure | FY 2025 | FY 2024 | FY 2023 | FY 2021 | FY 2020 |
|---|---|---|---|---|---|
| Share price | 28.5 | — | — | — | — |
| P/FCF | -19.24 | — | — | — | — |
Filed figures
Lines the statements and their notes report beside the headline figures, read from the filings' XBRL as filed (no restatement applied), with figures computed from one filing's own lines. Cash-flow lines carry their cash direction: an outflow is negative. Each period links to its filing; a figure's period, report date and tag are in its tooltip.
| Figure | Dec 2024 | Dec 2025 |
|---|---|---|
| Balance sheet detail | ||
| Trade receivables (USD) | 10.4M | 7.29M |
| ↳ YoY growth | -29.9% | |
| Lease liabilities (USD) | 966,000 | 678,000 |
| Cash and deposits (USD) | 61M | 140M |
| Intangible assets (USD) | 11.7M | 11.6M |
| Right-of-use assets (USD) | 928,000 | 638,000 |
| Cash flow detail | ||
| Operating cash flow (USD) | -21.4M | -19.7M |
| Purchases of intangible assets (USD) | -3.07M | -6.1M |
| Change in receivables (cash effect) (USD) | 1.75M | 3.23M |
| Change in inventories (cash effect) (USD) | 6.04M | -2.13M |
| Change in payables (cash effect) (USD) | 821,000 | 2.86M |
| Share-based compensation (USD) | 5.17M | 6.84M |
| Operating cash flow before change in receivables (USD) | -23.2M | -22.9M |
| Income detail | ||
| Research and development expense (USD) | 37.2M | 38.5M |
| Total comprehensive income (USD) | -39.3M | -36.4M |
| Comprehensive income to owners (USD) | -42.1M | -36.4M |
| Reported | Mar 5, 2026 | Mar 5, 2026 |
Sign up to see institutional holdings
Sign UpPodcast Mentions
Sign up to see podcast mentions and sentiment
Sign UpMaterial events reported to the SEC on Form 8-K or 6-K, newest first. The link opens the filing itself on EDGAR. Announcements made on SGXNet, newest first, routine notices (disclosures of interest, daily buy-backs, listing confirmations, coupons) included. The link opens the announcement on SGX. Press releases from the company's own website, newest first.
Ambiq Reports Third Quarter 2026 Financial Results
Bull 5
Bear 0
Results
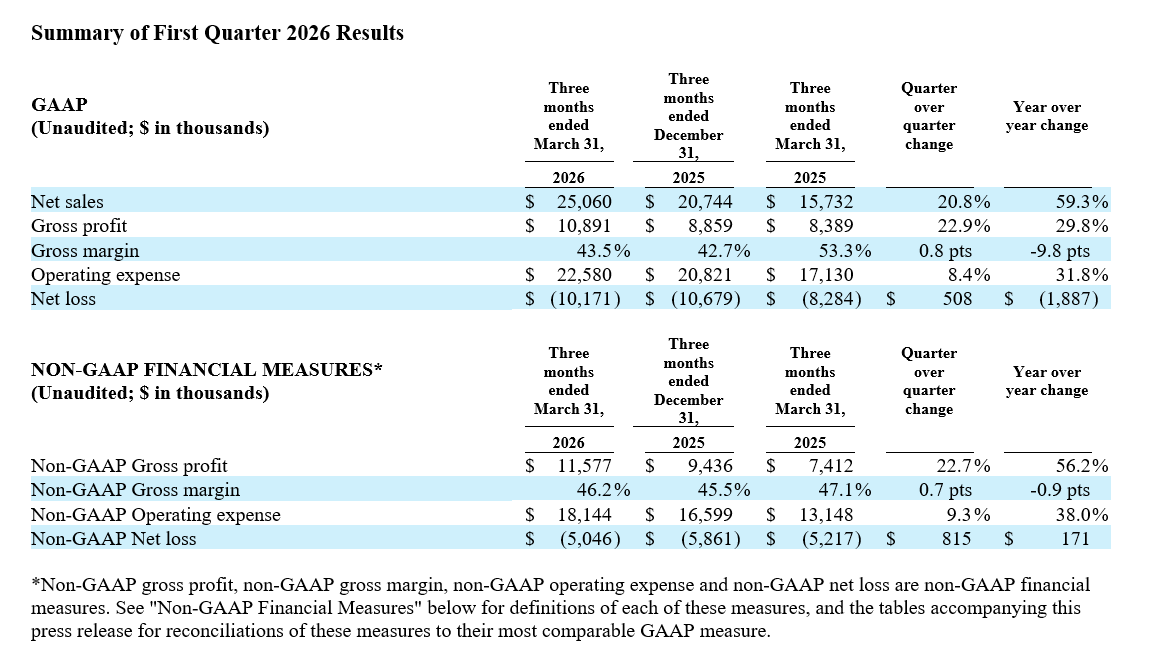
Third quarter net sales increased 110% year-over-year on broad demand across customers, product families and form factors
Gross profit more than doubled year-over-year, outpacing net sales growth
Expect fourth quarter net sales of $43.5 million to $44.5 million, supported by accelerating demand for edge AI
AUSTIN, Texas, November 10, 2026 — Ambiq Micro, Inc. (“Ambiq”) (NYSE: AMBQ), a technology leader in ultra-low-power semiconductor solutions for edge AI, today announced financial results for the third quarter of 2026.
Third Quarter 2026 and Recent Highlights
•Continued net sales growth on strong edge AI demand: Net sales increased approximately 110%, year-over-year, driven by strong demand across customers, product families and form factors.
•Gross profit outpaced net sales growth: GAAP gross profit increased 132% and non-GAAP gross profit increased 128% year-over-year, with GAAP gross margin and non-GAAP gross margin expanding by 440 basis points and 390 basis points respectively.
Third Quarter Results
Bull 5
Bear 0
Results











Prompts
Click prompts to add them under the company line, click again to take one out, then copy the result into your AI chat. Shared by Asian Century Stocks and Uncovered Thai Stocks. Thank you.
Ambiq Micro, Inc. (ticker AMBQ), listed in United States.
Copied
ETFs Holding Ambiq Micro, Inc.
Exchange-traded funds whose newest published daily portfolio holds one of the company's listings, largest weight first.
| ETF | Weight in ETF | Shares | Market value | As of |
|---|---|---|---|---|
| FSEG | 0.40% | 259 | $ 22.87K | Jun 30, 2026 |
| FSEV | 0.20% | 150 | $ 13.245K | Jun 30, 2026 |
| RESM | 0.08% | 32 | $ 2,825.60 | Jun 30, 2026 |
| FESM | 0.06% | 41,782 | $ 3.689M | Jun 30, 2026 |
| VFMO | 0.05% | 16,411 | $ 956.925K | Aug 31, 2026 |
| AVSC | 0.01% | 7,369 | $ 324.457K | Nov 16, 2026 |
| IETC | 0.01% | 1,892 | $ 83.305K | Nov 16, 2026 |
| MSSM | 0.00% | 567 | $ 33.062K | Aug 31, 2026 |
| AVSU | 0.00% | 19 | $ 836.57 | Nov 16, 2026 |