本公司將參加摩根大通(JPMorgan)舉辦之投資人會議
Bull 0
Bear 0
Routine
2412.TW
|
Chunghwa Telecom Co., Ltd. is a telecommunications company providing fixed-line, mobile, and broadband internet services. Its business segments include fixed-line communications, mobile communications, and broadband access with internet services. The company offers enterprise ICT services using big data, cybersecurity, cloud computing, and network data center resources, while also developing emerging technology services in the Internet of Things and artificial intelligence. Key consumer products and brands include HiNet broadband, MOD, Hami Video, and Jingcai Life+. The company serves individual consumers and enterprise clients, maintaining partnerships with international telecommunications operators to support internationalization efforts. Summarised from the company's own disclosures, fiscal year ended Oct 2026 |
Industry Telecom Services | Homepage cht.com.tw |
| Sector Communication Services | IR page cht.com.tw/home/consumer | |
|
Tags
fixed-line communications, mobile communications, broadband internet, enterprise ict services, big data, cybersecurity, cloud computing, data centers, internet of things, artificial intelligence, video streaming, 5g, HiNet, MOD, Hami Video, Jingcai Life+
|
Press page cht.com.tw/home/enterprise/news/success-case |
Metrics
| Valuation | |
|---|---|
| Market cap | NT$ 1.288T |
| Market cap (USD) | $ 39.086B |
| P/E | 30.46 |
| PEG | 15.21 |
| P/BV | 3.41 |
| P/S | 5.06 |
| P/OCF | 16.25 |
| P/FCF | — |
| Dividend yield | — |
| Turnover / mcap | — |
| Returns | |
|---|---|
| ROE | 10.0% |
| ROI | 10.0% |
| ROIC | 10.1% |
| Profit margin | 16.4% |
| Growth | |
|---|---|
| Revenue growing | Yes |
| Profits growing | Yes |
| Revenue up 3y | Yes |
| Revenue up 5y | Yes |
| Earnings growth 3y (net profit CAGR) | 2.0% |
| Quality | |
|---|---|
| Profitable | Yes |
| Margin expanding | No |
| Buying back stock | No |
| Diluting (TTM) | No |
| Debt/Equity | — |
| Podcast bulls (TTM) | Sign up |
| Podcast bears (TTM) | Sign up |
| Podcast sentiment (TTM) | Sign up |
| Podcast sentiment % (TTM) | Sign up |
| News sentiment (TTM) | 0 |
| Quality score | 35.3% |
| Insiders | |
|---|---|
| Buys, 1w | Sign up |
| Buys, 1m | Sign up |
| Buys, 1y | Sign up |
| Sells, 1w | Sign up |
| Sells, 1m | Sign up |
| Sells, 1y | Sign up |
Sign up to see this company's insider trades
| Figure | FY 2025 | FY 2024 | FY 2023 | FY 2022 | FY 2021 | FY 2020 | FY 2019 | FY 2018 | FY 2017 | FY 2016 | FY 2014 | FY 2013 | FY 2012 |
|---|---|---|---|---|---|---|---|---|---|---|---|---|---|
| Revenue | 236.114B | 229.968B | 223.199B | 216.739B | 210.478B | 207.609B | 207.52B | 215.483B | 227.514B | 229.991B | 226.6B | — | — |
| Net profit | 40.491B | 38.508B | 38.061B | 37.869B | 37.047B | 34.704B | 33.921B | 38.581B | 40.16B | 40.485B | 37B | — | — |
| Free cash flow | 49.748B | 50.488B | 43.818B | 44.416B | 39.525B | 50.945B | 48.261B | 37.816B | 44.057B | 41.435B | — | — | — |
Filed figures
Lines the statements and their notes report beside the headline figures, read from the filings' XBRL as filed (no restatement applied), with figures computed from one filing's own lines. Cash-flow lines carry their cash direction: an outflow is negative. Each period links to its filing; a figure's period, report date and tag are in its tooltip.
| Figure | Dec 2016 | Dec 2017 | Dec 2018 | Dec 2019 | Dec 2020 | Dec 2021 | Dec 2022 | Dec 2023 | Dec 2024 | Dec 2025 |
|---|---|---|---|---|---|---|---|---|---|---|
| Income detail | ||||||||||
| Research and development expense (TWD) | 3.79B | 131M | 122M | 132M | 137M | 133M | 123M | 127M | 127M | 139M |
| ↳ 5y CAGR | -1.3% | +0.8% | -0.8% | +0.3% | ||||||
| Reported | Apr 27, 2018 | Apr 27, 2018 | Apr 29, 2019 | Apr 17, 2020 | Apr 19, 2021 | Apr 15, 2022 | Apr 17, 2023 | Apr 17, 2024 | Apr 16, 2025 | Apr 15, 2026 |
Sign up to see institutional holdings
Sign UpPodcast Mentions
Sign up to see podcast mentions and sentiment
Sign UpMaterial information published on MOPS, newest first, subjects as filed in Chinese, guarantee and loan balance notices and routine equipment purchases included. The link opens the company's material information on MOPS. Material events reported to the SEC on Form 8-K or 6-K, newest first. The link opens the filing itself on EDGAR. Press releases from the company's own website, newest first.
中華電信公佈115年10月營運績效
Bull 0
Bear 0
Routine
Chunghwa Telecom announced its operating results for October 2026
Bull 2
Bear 0
Results
October 2026 sales
2
Date of events: 2026/11/10
Contents:
1.Date of occurrence of the event: 2026/11/10
2.Company name: Chunghwa Telecom Co., Ltd.
3.Relationship to the Company (please enter "head office" or "subsidiaries"): Head office
4.Reciprocal shareholding ratios: N/A
5.Cause of occurrence:
Chunghwa Telecom announced its unaudited operating results on a consolidated basis for October 2026:
The Company’s revenue for October 2026 was approximately NT$23.75 billion, income from operation was approximately NT$4.65 billion, net income attributable to stockholders of the parent was approximately NT$3.59 billion, EBITDA was approximately NT$8.10 billion and earnings per share was NT$0.46.
The Company’s revenue for the ten months ended October 31, 2026 was approximately NT$212.69 billion, income from operation was approximately NT$46.40 billion, net income attributable to stockholders of the parent was approximately NT$36.56 billion, EBITDA was approximately NT$80.58 billion and earnings per share was NT$4.71.






 ▲凱撒衛浴(CAESAR)營業管理處副總經理劉名家
 ▲中華電信協助導入Google Cloud生成式AI架構,支援凱撒衛浴內部知識管理與外部智慧客服
 ▲凱撒衛浴透過中華電信的雲地整合能力,提升品牌競爭力與價值
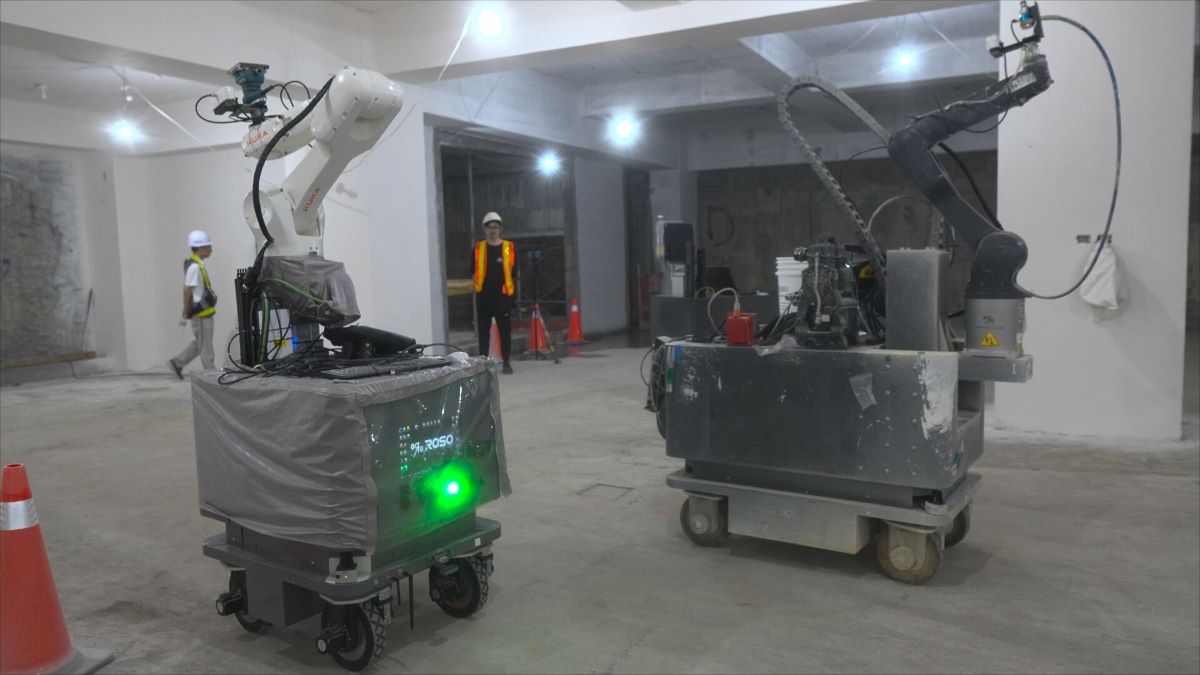 ▲中華電信攜手亞旭電腦,將「5G企業專網」與「AI機器人」帶進高雄社宅工地。
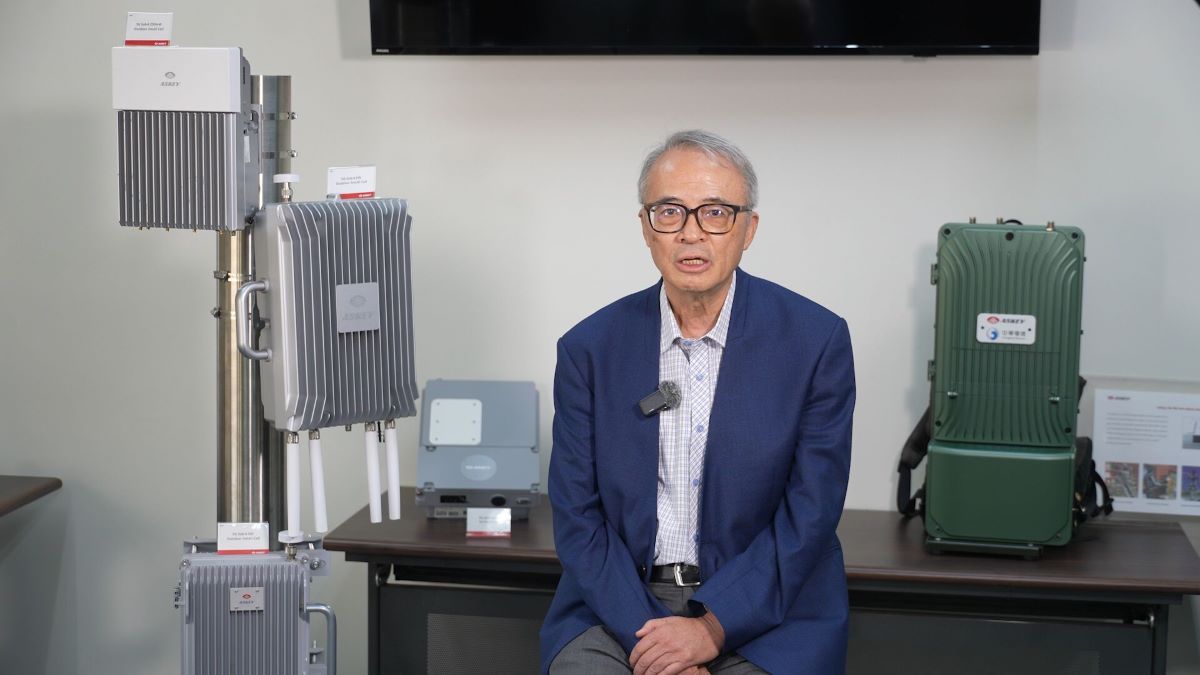 ▲亞旭電腦副總經理劉均敬表示,自走式5G專網可隨施工需求靈活移動,讓網路跟著機器人走,提升工地通訊彈性。
 ▲中華電信企業客戶分公司行動產品處處長李俊煌表示,5G企業專網可讓機器人隨時接收後端管理平台與營運指令,支援不同場域的施工任務。
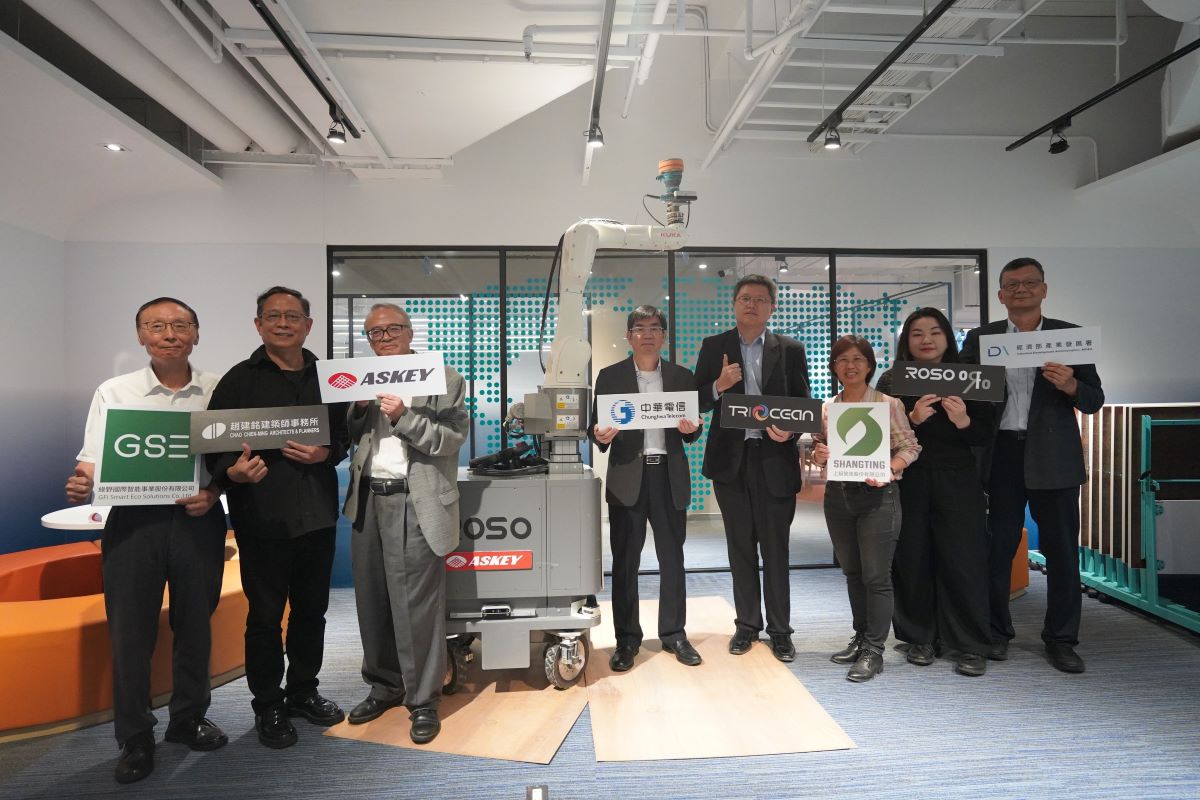 ▲中華電信和亞旭電腦強強聯手,以5G專網結合AI機器人,加速智慧營建轉型。
Prompts
Click prompts to add them under the company line, click again to take one out, then copy the result into your AI chat. Shared by Asian Century Stocks and Uncovered Thai Stocks. Thank you.
Chunghwa Telecom Co., Ltd. (ticker 2412.TW), listed in Taiwan.
Copied
ETFs Holding Chunghwa Telecom Co., Ltd.
Exchange-traded funds whose newest published daily portfolio holds one of the company's listings, largest weight first.
| ETF | Weight in ETF | Shares | Market value | As of |
|---|---|---|---|---|
| JSTC | 0.46% | 274,680 | $ 1.363M | Nov 17, 2026 |
| FEMR | 0.35% | 125,561 | $ 558.566K | Jun 30, 2026 |
| AVES | 0.35% | 100,634 | $ 5.012M | Nov 16, 2026 |
| NTSE | 0.18% | 23,000 | $ 102.161K | Jun 30, 2026 |
| SEEM | 0.17% | 235,101 | $ 1.044M | Jun 30, 2026 |
| DFAE | 0.15% | 1,774,416 | $ 14.038M | Nov 12, 2026 |
| AVXC | 0.15% | 12,264 | $ 610.747K | Nov 16, 2026 |
| AVEM | 0.13% | 665,674 | $ 33.151M | Nov 16, 2026 |
| DEXC | 0.13% | 10,471 | $ 337.316K | Nov 12, 2026 |
| DFEM | 0.09% | 948,246 | $ 8.028M | Nov 12, 2026 |
| DFSE | 0.09% | 11,297 | $ 510.393K | Nov 12, 2026 |
| IQSZ | 0.06% | 25,000 | $ 107.486K | Jul 31, 2026 |
| AVSE | 0.04% | 1,859 | $ 92.578K | Nov 16, 2026 |
| DFAX | 0.02% | 311,673 | $ 2.236M | Nov 12, 2026 |