OQCI Fund LPおよびOFI Fund LPの子会社の異動に関するお知らせ
Bull 0
Bear 0
Routine
8591
Fiscal year ends March
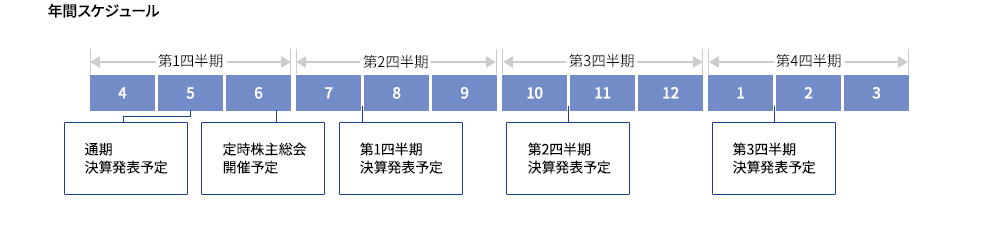
Quarters are offset from the calendar — Q1 is Apr–Jun
|
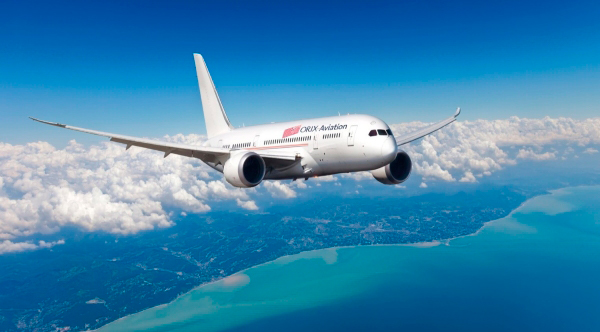
Orix Corporation is a diversified financial and industrial group operating through multiple business segments. Its core activities include corporate finance, maintenance leasing of automobiles and ICT equipment, and real estate development and asset management. The group also manages environmental energy projects, including renewable energy generation and waste treatment, alongside life insurance, banking, and consumer credit services. In the transportation sector, Orix invests in and manages aircraft and shipping assets. The company provides financial services, investment, and asset management globally, with specific operations in the Americas, Europe, and the Asia-Pacific region. Key subsidiaries include Orix Auto, Orix Rentec, Orix Real Estate, Orix Life Insurance, Orix Bank, and Orix Asia Limited. Summarised from the annual report, fiscal year ended Mar 2026 |
Industry Financial Conglomerates | Homepage orix.co.jp |
| Sector Financial Services | IR page orix.co.jp/grp | |
|
Tags
leasing, real estate, renewable energy, life insurance, banking, consumer credit, aviation, shipping, asset management, waste treatment, Orix Auto, Orix Rentec, Yodo Transformer, Orix Real Estate, Orix Real Estate Investment Advisory, Orix Asset Management, Taisei, Orix Environment, Elawan Energy S.L., Orix Life Insurance, Orix Bank, Mitsutoku Ship, ORIX Aviation Systems Limited, ORIX Corporation USA, ORIX Europe, ORIX Corporation Europe N.V., ORIX Asia Limited, ORIX Leasing Malaysia Berhad, PT.ORIX Indonesia Finance, ORIX Australia Corporation Limited, Orix (China) Investment Co. Ltd., ORIX Capital Korea Corporation, Thai ORIX Leasing Co. Ltd., ORIX Auto Leasing Taiwan Corporation, ORIX Corporation India Limited, ORIX Leasing Singapore Limited
|
Press page orix.co.jp/orem/news |
Metrics
| Valuation | |
|---|---|
| Market cap | ¥ 6.592T |
| Market cap (USD) | $ 41.381B |
| P/E | 6.21 |
| PEG | 0.35 |
| P/BV | 1.29 |
| P/S | 1.92 |
| P/OCF | 4.64 |
| P/FCF | — |
| Dividend yield | 2.7% |
| Turnover / mcap | — |
| Returns | |
|---|---|
| ROE | 10.4% |
| ROI | 10.0% |
| ROIC | 10.0% |
| Profit margin | 13.4% |
| Growth | |
|---|---|
| Revenue growing | Yes |
| Profits growing | Yes |
| Revenue up 3y | Yes |
| Revenue up 5y | Yes |
| Earnings growth 3y (net profit CAGR) | 17.9% |
| Quality | |
|---|---|
| Profitable | Yes |
| Margin expanding | Yes |
| Buying back stock | Yes |
| Diluting (TTM) | No |
| Debt/Equity | — |
| Podcast bulls (TTM) | Sign up |
| Podcast bears (TTM) | Sign up |
| Podcast sentiment (TTM) | Sign up |
| Podcast sentiment % (TTM) | Sign up |
| News sentiment (TTM) | 16 |
| Quality score | 77.8% |
| Insiders | |
|---|---|
| Buys, 1w | Sign up |
| Buys, 1m | Sign up |
| Buys, 1y | Sign up |
| Sells, 1w | Sign up |
| Sells, 1m | Sign up |
| Sells, 1y | Sign up |
Sign up to see this company's insider trades
| Figure | FY 2026 | FY 2025 | FY 2024 | FY 2023 | FY 2022 | FY 2021 | FY 2020 | FY 2019 | FY 2018 | FY 2017 | FY 2016 | FY 2015 | FY 2014 | FY 2013 | FY 2012 | FY 2011 | FY 2010 |
|---|---|---|---|---|---|---|---|---|---|---|---|---|---|---|---|---|---|
| Revenue | 1.504T | 1.352T | 1.3T | 1.303T | 1.246T | 2.293T | 2.28T | 2.435T | 2.863T | 2.679T | 2.369T | 2.174T | 1.342T | 1.066T | 972.884B | 970.11B | 932.841B |
| Net profit | 447.265B | 351.63B | 346.132B | 273.075B | 312.135B | 192.384B | 302.7B | 323.745B | 313.135B | 273.239B | 260.169B | 234.948B | 186.794B | 111.909B | 86.15B | 67.275B | 37.757B |
| Figure | FY 2026 | FY 2025 | FY 2024 | FY 2023 | FY 2022 | FY 2021 | FY 2020 | FY 2019 | FY 2018 | FY 2017 | FY 2016 | FY 2015 | FY 2014 | FY 2013 | FY 2012 | FY 2011 | FY 2010 |
|---|---|---|---|---|---|---|---|---|---|---|---|---|---|---|---|---|---|
| Share price | 4.783K | 3.179K | 16.31K | 11.601K | 11.352K | 8.857K | 6.423K | 8.111K | 10.143K | 8.123K | 8.666K | 8.034K | 7.067K | 5.148K | 3.726K | — | — |
| Price performance 12m | 0.44 | -0.81 | 0.34 | -0.18 | 0.18 | 0.43 | -0.18 | -0.2 | 0.21 | 0.04 | 0.01 | -0 | 0.11 | 0.32 | — | — | — |
Filed figures
Lines the statements and their notes report beside the headline figures, read from the filings' XBRL as filed (no restatement applied), with figures computed from one filing's own lines. Cash-flow lines carry their cash direction: an outflow is negative. Each period links to its filing; a figure's period, report date and tag are in its tooltip.
| Figure | Mar 2017 | Mar 2018 | Mar 2019 | Mar 2020 | Mar 2021 | Mar 2022 | Mar 2023 | Mar 2024 | Mar 2025 | Mar 2026 |
|---|---|---|---|---|---|---|---|---|---|---|
| Balance sheet detail | ||||||||||
| Borrowings, current (JPY) | 283B | 307B | 310B | 337B | 307B | 440B | 509B | 574B | 550B | 572B |
| Lease liabilities (JPY) | — | — | — | 267B | 290B | 275B | 281B | 252B | 252B | 268B |
| Cash and deposits (JPY) | 1.04T | 1.32T | 1.16T | 983B | 951B | 955B | 1.23T | 1.03T | 1.21T | 1.33T |
| Intangible assets (JPY) | 396B | 439B | 427B | 404B | 426B | 404B | 518B | 533B | 525B | 576B |
| Right-of-use assets (JPY) | — | — | — | 270B | 292B | 275B | 279B | 250B | 249B | 265B |
| Net debt (borrowings + leases - cash) (JPY) | -756B | -1.01T | -851B | -379B | -354B | -240B | -442B | -206B | -405B | -494B |
| Cash flow detail | ||||||||||
| Operating cash flow (JPY) | 584B | 547B | 588B | 1.04T | 1.1T | 1.1T | 913B | 1.24T | 1.3T | 1.37T |
| Change in inventories (cash effect) (JPY) | -5.32B | 10.6B | 6.85B | 11.9B | -12.1B | -7.05B | -17.5B | -58.1B | -9.84B | -39.8B |
| Dividends paid (cash effect) (JPY) | -61.3B | -72.8B | -88.4B | -104B | -95.2B | -99.4B | -106B | -99.9B | -136B | -171B |
| Share buybacks (cash effect) (JPY) | -12.1B | -39.1B | -707M | -45.7B | -55.4B | -50B | -52.1B | -50B | -53.5B | -150B |
| Interest paid (cash effect) (JPY) | -71.3B | -75B | -92.4B | -99.8B | -80.3B | -66B | -118B | -183B | -168B | -189B |
| Income taxes paid (cash effect) (JPY) | -50.8B | -182B | -67.1B | -124B | -76.3B | -83B | -187B | -3.51B | -113B | -115B |
| Income detail | ||||||||||
| Total comprehensive income (JPY) | 268B | 295B | 314B | 246B | 231B | 394B | 288B | 545B | 335B | 730B |
| Comprehensive income to owners (JPY) | 263B | 288B | 311B | 246B | 226B | 382B | 276B | 547B | 336B | 711B |
| Provision for credit losses (JPY) | — | — | — | — | 16B | 3.94B | 7.76B | 21B | 18.7B | 34B |
| Reported | Jun 28, 2018 | Jun 28, 2018 | Jun 25, 2019 | Jun 30, 2020 | Jun 26, 2023 | Jun 26, 2023 | Jun 26, 2023 | Jun 27, 2024 | Jun 24, 2025 | Jun 22, 2026 |
Sign up to see institutional holdings
Sign UpPodcast Mentions
Sign up to see podcast mentions and sentiment
Sign UpTimely disclosures published on TDnet, newest first, titles as filed in Japanese. The link opens the disclosure on TDnet. Filings with EDINET (periodic reports, extraordinary reports, offerings, holding and buy-back reports), newest first, titles as filed in Japanese. The link opens the filing on EDINET. Material events reported to the SEC on Form 8-K or 6-K, newest first. The link opens the filing itself on EDGAR. Press releases from the company's own website, newest first.
Material Contained in this Report 1. Notice Regarding Changes in Subsidiaries: OQCI Fund LP and OFI Fund LP
Bull 0
Bear 0
Routine
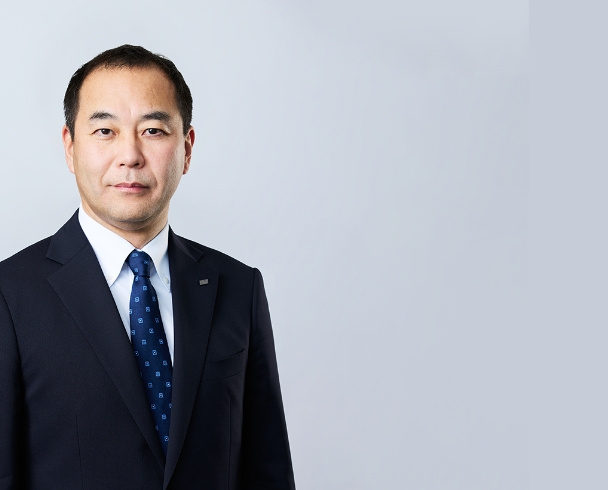
Chief Financial Officer and Chief Strategy Officer
Responsible for Corporate Strategy and Management Unit
Notice Regarding Changes in Subsidiaries: OQCI Fund LP and OFI Fund LP
TOKYO, Japan – November 18, 2026 – ORIX Corporation (“ORIX”) announced that, in connection with the execution today by its subsidiary OQCI Fund LP (“OQCI Fund”), through OQI02 Corporation, which is a subsidiary of OQCI Fund, of a share transfer agreement relating to an investment transaction, OQCI Fund is expected to qualify as a specific subsidiary of ORIX. In connection with the foregoing, OFI Fund LP (“OFI Fund”), a subsidiary of ORIX and an investor in OQCI Fund, is also expected to qualify as a specific subsidiary of ORIX.
1. Reason for the Changes
OQCI Fund plans to make capital calls for, and receive capital contributions in respect of, the funds required for a new investment. OFI Fund also plans to make capital calls for, and receive capital contributions in respect of, the funds required for the new investment by OQCI Fund.





 企業情報 TOP
 企業情報詳細
 私たちの使命
 マネジメント紹介
 私たちの歩み
 ビジネスパートナーさまへ
 サービス情報 TOP
 太陽光発電所
 蓄電所
 O&M受託マップ
 カタログダウンロード










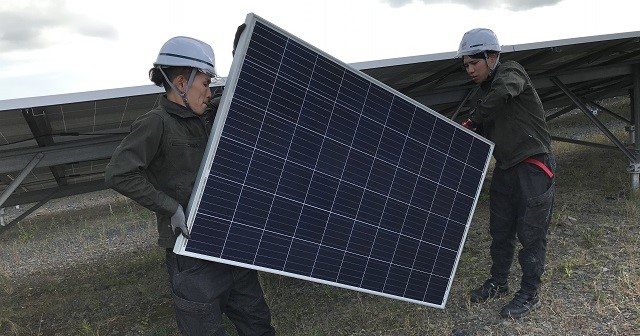


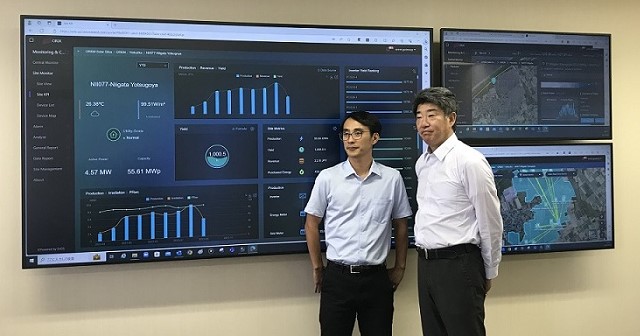

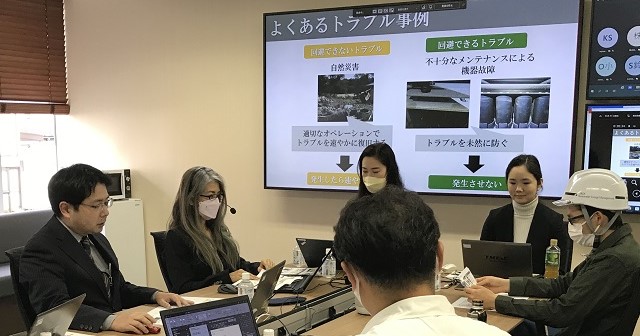
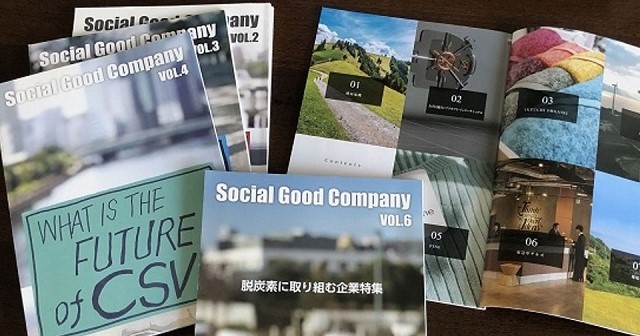





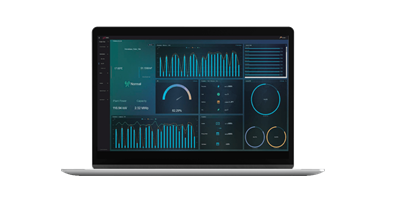
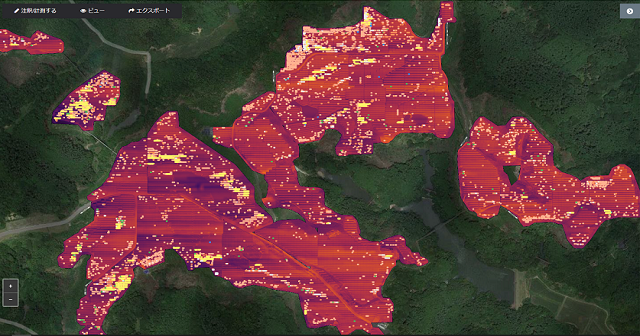




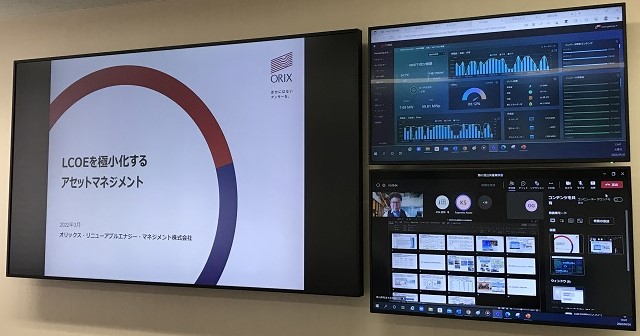


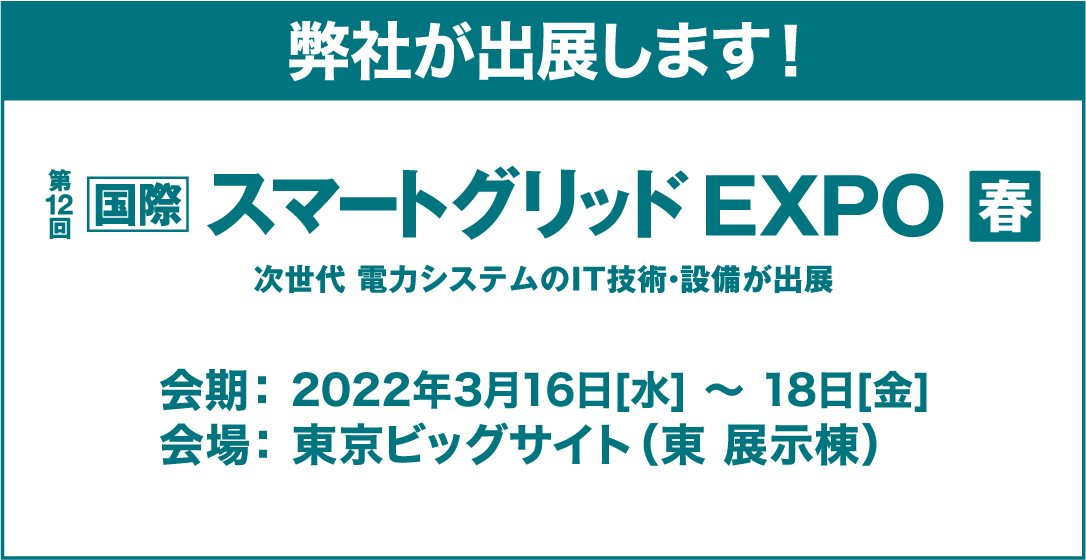
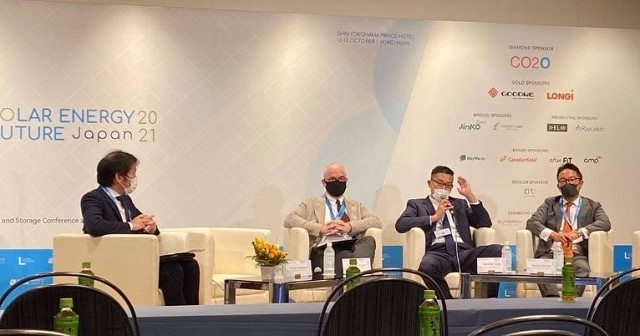

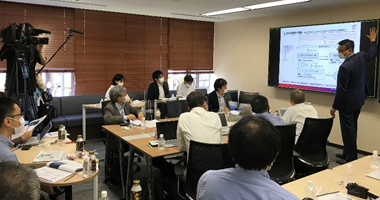














 [11.4MB]







 最新決算資料
 IRカレンダー
 株価情報
 CEOメッセージ(統合報告書2026)
 統合報告ポータル
 コーポレート・ガバナンス
 IRニュース
 財務データ・ セグメント情報
 個人投資家の皆さまへ
 IR資料室
 株式・社債情報
 IRポリシー




Prompts
Click prompts to add them under the company line, click again to take one out, then copy the result into your AI chat. Shared by Asian Century Stocks and Uncovered Thai Stocks. Thank you.
Orix Corporation (ticker 8591), listed in Japan.
Copied
ETFs Holding Orix Corporation
Exchange-traded funds whose newest published daily portfolio holds one of the company's listings, largest weight first.
| ETF | Weight in ETF | Shares | Market value | As of |
|---|---|---|---|---|
| GENW | 2.73% | 3,470 | $ 139.876K | Jul 31, 2026 |
| JPAN | 2.50% | 6,600 | $ 249.706K | Jun 30, 2026 |
| TIIV | 2.16% | 17,612 | $ 709.94K | Jul 31, 2026 |
| ADVE | 1.95% | 4,700 | $ 177.821K | Jun 30, 2026 |
| VDI | 1.26% | 5,100 | $ 205.468K | Jul 31, 2026 |
| RFDI | 1.04% | 42,700 | $ 1.72M | Jul 31, 2026 |
| AIVI | 0.53% | 8,200 | $ 310.24K | Jun 30, 2026 |
| IVSI | 0.32% | 676 | $ 25.565K | Jun 30, 2026 |
| AVSD | 0.29% | 32,223 | $ 1.084M | Nov 16, 2026 |
| FLSP | 0.23% | 56,900 | $ 2.153M | Jun 30, 2026 |
| APIE | 0.20% | 60,333 | $ 2.351M | Aug 31, 2026 |
| AVIV | 0.18% | 110,910 | $ 3.73M | Nov 16, 2026 |
| AVDE | 0.16% | 911,957 | $ 30.669M | Nov 16, 2026 |
| BDYN | 0.03% | 30,004 | $ 1.009M | Nov 16, 2026 |