8411
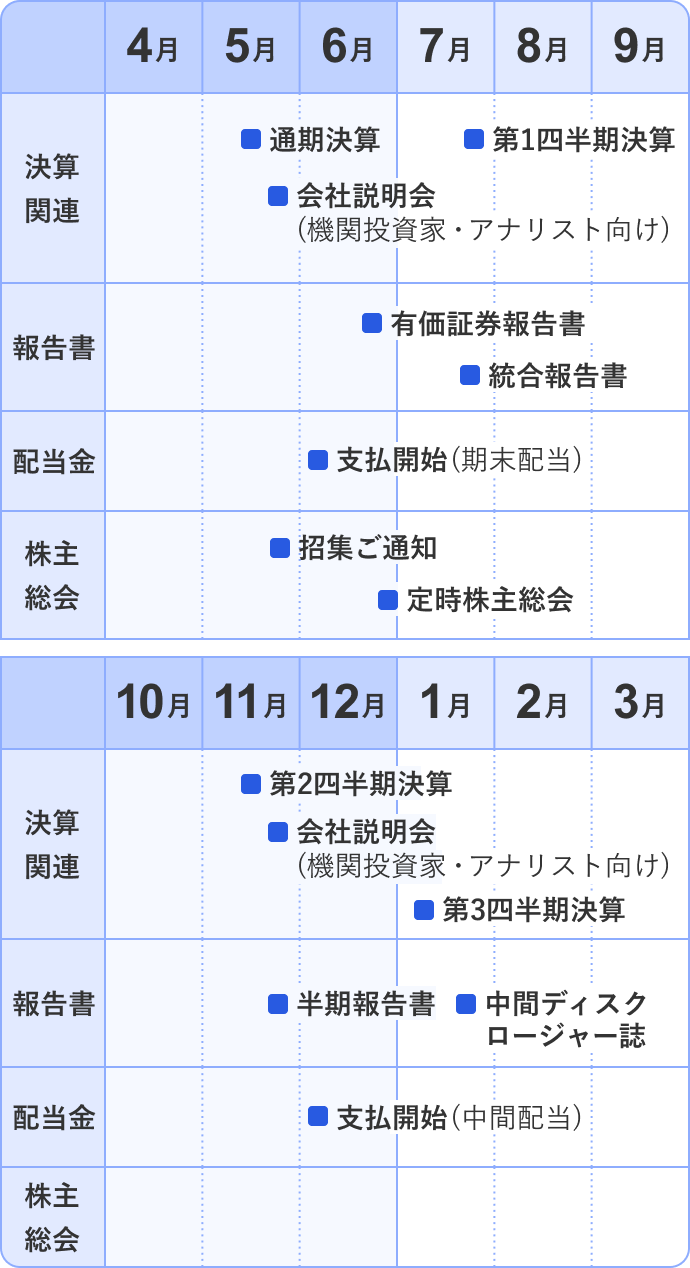
Fiscal year ends March Quarters are offset from the calendar — Q1 is Apr–Jun

Mizuho Financial Group, Inc. is a bank holding company that manages and conducts banking, trust, securities, and other financial services. The group consists of the parent company, 263 consolidated subsidiaries, and 25 equity-method affiliates. Key subsidiaries include Mizuho Bank, Mizuho Trust & Banking, and Mizuho Securities. In April 2026, Mizuho Bank merged with Mizuho Research & Technologies to integrate banking functions with research, consulting, IT, and technology development. The company operates across banking, trust, and securities segments, providing financial products and services to customers.

Summarised from the annual report, fiscal year ended Mar 2026

Industry Banks - Diversified Homepage mizuho-fg.co.jp
Sector Financial Services IR page mizuho-fg.co.jp/investors
Tags
banking, trust services, securities, financial services, investment banking, wealth management, corporate banking, retail banking, asset management, financial technology, Mizuho Bank, Mizuho Trust & Banking, Mizuho Securities, Mizuho Research & Technologies
Press page —

Metrics

Valuation  
Market cap ¥ 21.094T
Market cap (USD) $ 132.42B
P/E 16.85
PEG 0.54
P/BV 1.85
P/S 2.32
P/OCF -4.36
P/FCF -4.09
Dividend yield 1.7%
Turnover / mcap —
Returns  
ROE 11.4%
ROI 10.1%
ROIC 3.5%
Profit margin 13.7%
Growth  
Revenue growing Yes
Profits growing Yes
Revenue up 3y Yes
Revenue up 5y Yes
Earnings growth 3y (net profit CAGR) 31.0%
Quality  
Profitable Yes
Margin expanding No
Buying back stock Yes
Diluting (TTM) No
Debt/Equity —
Podcast bulls (TTM) Sign up
Podcast bears (TTM) Sign up
Podcast sentiment (TTM) Sign up
Podcast sentiment % (TTM) Sign up
News sentiment (TTM) 0
Quality score 26.3%
Insiders  
Buys, 1w Sign up
Buys, 1m Sign up
Buys, 1y Sign up
Sells, 1w Sign up
Sells, 1m Sign up
Sells, 1y Sign up

Sign up to see this company's insider trades

Figure FY 2026 FY 2025 FY 2024 FY 2023 FY 2022 FY 2021 FY 2020 FY 2019 FY 2018 FY 2017 FY 2016 FY 2015 FY 2014 FY 2013
Revenue 9.085T 9.03T 8.744T 5.779T 3.963T 3.218T 3.987T 3.926T 3.561T 3.293T 333.5B 377.777B 316.886B 262.18B
Net profit 1.249T 885.433B 678.993B 555.527B 530.479B 471.02B 448.568B 96.566B 576.547B 603.544B 670.943B 611.935B 688.415B 560.516B
Free cash flow -5.157T -4.166T 1.628T 8.684T 4.778T 16.397T 1.665T -2.79T 2.727T 4.299T 3.78T — — —

Figure FY 2026 FY 2025 FY 2024 FY 2023 FY 2022 FY 2021 FY 2020 FY 2019 FY 2018 FY 2017 FY 2016 FY 2015 FY 2014 FY 2013
Share price 6.086K 4.049K 3.045K 1.877K 1.565K 1.598K 123.39 171.05 191.28 203.81 167.95 210.97 203.8 198.88
Price performance 12m 0.5 0.33 0.62 0.2 -0.02 11.95 -0.28 -0.11 -0.06 0.21 -0.2 0.04 0.02 —

Filed figures

Figure Mar 2017 Mar 2018 Mar 2019 Mar 2020 Mar 2021 Mar 2022 Mar 2023 Mar 2024 Mar 2025 Mar 2026
Balance sheet detail
Borrowings, current (JPY) 1.02T 1.07T 1.3T 785B 2.56T 2.31T 2.26T 1.73T 2.86T 2.45T
Borrowings, non-current (JPY) 7.56T 7.54T 8.35T 8.91T 10.3T 10.7T 11.4T 12T 12.9T 15.4T
Bonds payable (JPY) 7.79T 7.91T 8.71T 9.28T 10.8T 11.3T 11.8T 12.6T 13.6T 16T
Cash and deposits (JPY) 45.5T 46.3T 44.3T 39.9T 47T 50.1T 65.8T 71.2T 70.7T 59.7T
Intangible assets (JPY) 1.05T 1.09T 620B 636B 620B 601B 573B 725B 809B 882B
Net debt (borrowings + leases - cash) (JPY) -36.9T -37.7T -34.6T -30.2T -34.1T -37.1T -52.2T -57.4T -55T -41.8T
Cash flow detail
Operating cash flow (JPY) 4.69T 2.97T -2.64T 1.9T 16.6T 4.92T 8.87T 1.88T -3.82T -4.84T
Purchases of property, plant and equipment (JPY) -106B -58B -42.7B -85.8B -107B -42.3B -64.8B -63.1B -94.9B -96.7B
Purchases of intangible assets (JPY) -286B -182B -112B -151B -109B -97B -118B -194B -250B -222B
Dividends paid (cash effect) (JPY) -190B -190B -190B -190B -190B -197B -209B -235B -304B -369B
Share buybacks (cash effect) (JPY) -1.43B -1.61B -2.12B -1.44B -1.85B -1.93B -2.31B -3.38B -103B -404B
Income taxes paid (cash effect) (JPY) -247B -173B -176B -97.6B -217B -164B -133B -288B -124B -317B
Free cash flow (OCF - PPE - intangibles) (JPY) 4.3T 2.73T -2.79T 1.67T 16.4T 4.78T 8.68T 1.63T -4.17T -5.16T
Income detail
Total comprehensive income (JPY) 558B 766B -111B 7.67B 932B 47.1B 278B 1.35T 618B 1.65T
Comprehensive income to owners (JPY) 520B 734B -129B -3.12B 927B 33.7B 273B 1.34T 614B 1.64T
Reported Jun 26, 2017 Jun 25, 2018 Jun 24, 2019 Jun 26, 2020 Jun 24, 2021 Jun 22, 2022 Jun 16, 2023 Jun 19, 2024 Jun 17, 2025 Jun 19, 2026

Sign up to see institutional holdings

Sign Up

Podcast Mentions

Sign up to see podcast mentions and sentiment

Sign Up

Company Name: Mizuho Financial Group, Inc. Bull 3 Bear 0 Capital return

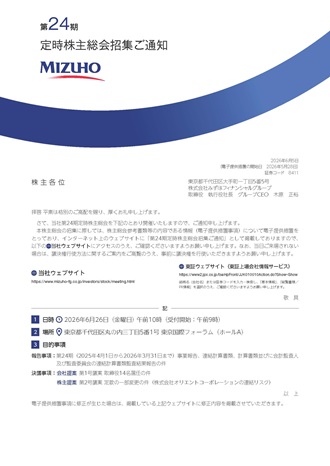
Representative: Masahiro Kihara, President and Group CEO

Head Office: 1-5-5 Otemachi, Chiyoda-ku, Tokyo

Code Number: 8411 (Prime Market of Tokyo Stock Exchange)

Interim Dividends and Revision to Dividends Estimates

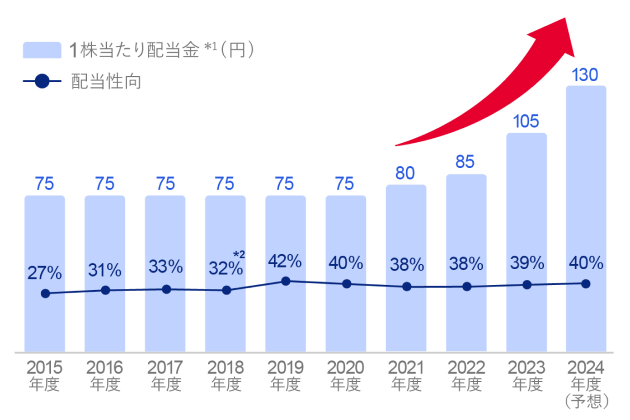
Mizuho Financial Group, Inc. (“MHFG”) hereby announces that its Board of Directors resolved today to pay interim dividend, with a record date of September 30, 2026, and to revise its estimates of the year-end and annual dividends per share for the fiscal year ending March 31, 2027, as set forth below.

1. Interim dividends

Determined Items Most recent estimates

May 15, 2026)

Actual results for the fiscal

year ended

March 31, 2026

Record date September 30, 2026 September 30, 2026 September 30, 2025

Dividend per share

¥100.0 ¥75.0 ¥72.5

Total amount of dividends

¥241,753 million - ¥180,447 million

Effective date

December 4, 2026 - December 5, 2025

Source of dividends

Retained Earnings - Retained Earnings

2.
Company Name: Mizuho Financial Group, Inc. Bull 3 Bear 0 Capital return

Representative: Masahiro Kihara, President and Group CEO

Head Office: 1-5-5 Otemachi, Chiyoda-ku, Tokyo

Code Number: 8411 (Prime Market of Tokyo Stock Exchange)

Notice Regarding Repurchase and Cancellation of Our Common Stock

Mizuho Financial Group, Inc. (“MHFG”) hereby announces that its Board of Directors resolved today to repurchase its common stock pursuant to the provisions of Article 156, Paragraph 1 of the Companies Act of Japan (“Companies Act”) and in accordance with the provisions of Article 459, Paragraph 1 of the Companies Act and Article 47 of its Articles of Incorporation, and cancel the repurchased common stock pursuant to Article 178 of the Companies Act.

1. Reason for the Repurchase of Common Stock

MHFG maintains a capital policy pursuing the optimal balance between capital adequacy, growth investment and enhancement of shareholder returns. Based on this initiative, MHFG set forth its shareholder return policy of keeping progressive increase of dividends per share, while executing flexible and intermittent share buybacks.

株式会社みずほフィナンシャルグループ(執行役社長:木原 正裕)をはじめとしたグルー プ会社 6 社は、本日、「〈みずほ〉削減貢献量フォーカスレポート 2026-削減貢献量が拓く 持続可能な未来-」(以下、本レポート)を公表しました。なお、本レポートの公表は 2024 年 10 月の初版公表以来、今回で 3 回目です。

削減貢献量(Avoided Emissions)は、企業が自社の製品・サービスを通じて、社会全体 の温室効果ガス排出量の削減に貢献した量を定量化した指標です。国際的には、削減貢献 量に関する基準・ガイダンスの改訂や業種別ガイダンスの策定が進むとともに、欧州や日 本を中心に算定・開示プラットフォームの整備も進展しています。日本では削減貢献量を 開示する企業が年々増加しており、投融資先企業における気候関連の機会やポジティブ・ インパクト、トランジション、サステナブルファイナンス等を評価する指標として、削減 貢献量への関心は一段と高まっています。

本レポートは、ファイナンスや企業評価における削減貢献量の活用をさらに普及・拡大 させることを目的として、削減貢献量のグローバル動向、日本企業による開示状況、サス テナビリティ情報開示における削減貢献量の意義と金融機関による活用を取りまとめたも のです。あわせて、削減貢献量に関する〈みずほ〉の実績および取組みも紹介しています。

〈みずほ〉は、サステナブルな社会の実現に向けて、削減貢献量を活用した取り組みの 拡大を推進しており、削減貢献量を用いることで気候変動を巡るお客さまの機会を評価し、 その実現に伴走します。「ともに挑む。ともに実る。」のパーパスのもと、価値共創のパー トナーとしてグループの総合力を動員し、社会・環境課題の解決に貢献していきます。

【削減貢献量フォーカスレポート 2026 URL】 https://www.mizuho-fg.co.jp/sustainability/report/pdf/avoided_emission_report_2026.pdf

「削減貢献量フォーカスレポート 2026」エグゼクティブ・サマリー

 削減貢献量のグローバル動向 – 足元では、削減貢献量に関する各種基準等の改訂や業種別ガイダンス策定が進み、 企業・金融機関の取り組みが進展・加速している – 複数の団体から削減貢献量に関するレポートが公表されているほか、欧州や日本を 中心に算定・開示プラットフォームの整備も進展している

 日本企業による削減貢献量の開示状況(2025 年度) – 2025 年度は、TOPIX 500 で 146 社、それ以外で 98 社の日本企業が削減貢献量を開 示。前年度に続き高い増加率を示しており、日本企業による開示は継続的に拡大し ている

 サステナビリティ情報開示における削減貢献量の意義と金融機関による活用 – サステナビリティ情報開示の法制化が進む中でも、削減貢献量などの任意開示に対 する金融機関のニーズは引き続き存在。売上高等との相関性が高い削減貢献量も考 慮することで、財務情報や企業価値とのつながりをより把握しやすくなる。また、 削減貢献量は炭素価格を乗じることで、経済価値を算定可能である – サステナビリティ情報開示は組織レベルに加え、ソリューションレベルでの評価も 併用することが望ましい。削減貢献量は、ソリューションレベルでの算定・開示が 基本であり、サステナブルファイナンスとの親和性も高い – 金融機関による削減貢献量の活用手法は、(1) ファイナンスの指標・目標、(2) 投 資先の評価指標、(3) 投融資ポートフォリオの管理指標、(4) エンゲージメントの テーマなど、多岐にわたる

 削減貢献量に対する〈みずほ〉の取り組み – 〈みずほ〉は削減貢献量の活用拡大に資する体制を構築し、削減貢献量の算定・開 示支援やファイナンスの実施などを通じてお客さまを支援している

 削減貢献量の更なる普及・拡大に向けて – 鍵となる取り組みは、(1) 企業によるソリューション開発・開示の拡大、(2) 金融 機関による評価・ファイナンス実装、(3) 企業と金融機関をつなぐ知見共有と共通 基盤の整備である

以 上

Prompts

Mizuho Financial Group, Inc. (ticker 8411), listed in Japan.

ETFs Holding Mizuho Financial Group, Inc.

ETF Weight in ETF Shares Market value As of
CGXU 1.72% 2,135,600 $ 110.386M Nov 16, 2026
GPT 1.60% 39,638 $ 379.732K Jun 30, 2026
RFDI 1.58% 50,800 $ 2.608M Jul 31, 2026
TINS 1.06% 1,300 $ 61.934K Jun 30, 2026
ORR 0.68% 50,364 $ 2.49M Nov 18, 2026
AIVI 0.66% 8,100 $ 385.899K Jun 30, 2026
NTSI 0.61% 64,000 $ 3.049M Jun 30, 2026
VDI 0.57% 1,800 $ 92.396K Jul 31, 2026
EHLS 0.55% 28,764 $ 294.831K Nov 17, 2026
DFIV 0.53% 2,309,080 $ 117.808M Nov 12, 2026
AVIV 0.41% 839,871 $ 8.609M Nov 16, 2026
AVSD 0.41% 149,636 $ 1.534M Nov 16, 2026
DFAI 0.37% 1,319,100 $ 67.3M Nov 12, 2026
APIE 0.36% 392,617 $ 4.177M Aug 31, 2026
YNOT 0.32% 59,097 $ 628.792K Aug 31, 2026
CGIC 0.32% 155,600 $ 8.043M Nov 16, 2026
GEW 0.31% 8,245 $ 445.049K Aug 31, 2026
AVDE 0.30% 5,712,445 $ 58.553M Nov 16, 2026
DFSI 0.21% 47,600 $ 2.429M Nov 12, 2026
DFIC 0.20% 591,600 $ 30.183M Nov 12, 2026
DFAX 0.13% 296,035 $ 15.104M Nov 12, 2026
DXIV 0.11% 5,200 $ 265.301K Nov 12, 2026
BDYN 0.11% 329,641 $ 3.379M Nov 16, 2026

Securities

Ticker Type Class Market Exchange Last price Price date
MFG Common share — US nyse 11.05 USD 2026-09-30
8411 canonical Common share — JP tsej 8,472.00 JPY 2026-09-29