|
Maruwa Co., Ltd. is a manufacturer and distributor of ceramic components and lighting equipment. The company operates two primary business segments: ceramic components and lighting equipment. In the ceramic components segment, it produces and sells high thermal conductivity substrates, high-strength substrates, special ceramic substrates, semiconductor equipment parts, automotive ceramic products, medical products, faucet components, information and communication products, antenna parts, and noise countermeasure products. The lighting equipment segment involves the manufacture and sale of LED high-intensity lighting, LED light source modules, facility lighting, residential lighting, design lighting, dimming control systems, and lighting space design services. The company serves markets in the semiconductor, automotive, and information and communication sectors. Its group structure includes thirteen subsidiaries and one associated company, with manufacturing operations in Japan and Malaysia, and sales offices in Taiwan, Europe, the United States, Korea, China, India, and Israel. Key subsidiaries include Maruwa (Malaysia) Sdn. Bhd., MARUWA Electronics (Taiwan) Co., Ltd., Maruwa Europe Ltd., Maruwa America Corp., Maruwa Korea Co., Ltd., Maruwa (Shanghai) Trading Co., Ltd., MARUWA Electronic (India) Pvt. Ltd., Maruwa Electronics GmbH, Maruwa Electronics Israel Ltd., MARUWA SHOMEI, and YAMAGIWA. Summarised from the annual report, fiscal year ended Mar 2026 |
Industry Electronic Components | Homepage maruwa-g.com |
| Sector Technology | IR page maruwa-g.com | |
|
Tags
ceramic substrates, semiconductor components, automotive ceramics, led lighting, lighting design, medical ceramics, antenna parts, noise countermeasures, Maruwa (Malaysia) Sdn. Bhd., MARUWA Electronics (Taiwan) Co. Ltd., Maruwa Europe Ltd., Maruwa America Corp., Maruwa Korea Co. Ltd., Maruwa (Shanghai) Trading Co. Ltd., MARUWA Electronic (India) Pvt. Ltd., Maruwa Electronics GmbH, Maruwa Electronics Israel Ltd., MARUWA SHOMEI, YAMAGIWA, Kobe Art
|
Press page maruwa-g.com/company/news |
Metrics
| Valuation | |
|---|---|
| Market cap | ¥ 669.573B |
| Market cap (USD) | $ 4.2B |
| P/E | 29.20 |
| PEG | 4.47 |
| P/BV | 4.22 |
| P/S | 7.58 |
| P/OCF | 46.04 |
| P/FCF | -78.33 |
| Dividend yield | 0.19% |
| Turnover / mcap | — |
| Returns | |
|---|---|
| ROE | 13.2% |
| ROI | 12.3% |
| ROIC | 11.7% |
| Profit margin | 24.4% |
| Growth | |
|---|---|
| Revenue growing | Yes |
| Profits growing | No |
| Revenue up 3y | Yes |
| Revenue up 5y | Yes |
| Earnings growth 3y (net profit CAGR) | 6.5% |
| Quality | |
|---|---|
| Profitable | Yes |
| Margin expanding | No |
| Buying back stock | No |
| Diluting (TTM) | No |
| Debt/Equity | — |
| Podcast bulls (TTM) | Sign up |
| Podcast bears (TTM) | Sign up |
| Podcast sentiment (TTM) | Sign up |
| Podcast sentiment % (TTM) | Sign up |
| News sentiment (TTM) | 0 |
| Quality score | 11.1% |
| Insiders | |
|---|---|
| Buys, 1w | Sign up |
| Buys, 1m | Sign up |
| Buys, 1y | Sign up |
| Sells, 1w | Sign up |
| Sells, 1m | Sign up |
| Sells, 1y | Sign up |
Sign up to see this company's insider trades
| Figure | FY 2026 | FY 2025 | FY 2024 | FY 2023 | FY 2022 | FY 2021 | FY 2020 | FY 2019 | FY 2018 | FY 2017 | FY 2016 | FY 2015 | FY 2014 | FY 2013 |
|---|---|---|---|---|---|---|---|---|---|---|---|---|---|---|
| Revenue | 74.476B | 71.849B | 61.564B | 58.804B | 54.344B | 41.438B | 41.231B | 41.193B | 38.513B | 32.187B | 30.578B | 32.811B | 33.475B | 24.399B |
| Net profit | 18.163B | 19.242B | 15.216B | 15.02B | 13.35B | 6.935B | 5.894B | 6.77B | 5.544B | 2.85B | 2.287B | 884.126M | 2.586B | 2.04B |
| Free cash flow | -5.591B | 15.254B | 5.981B | 6.923B | 10.949B | 5.136B | 5.279B | 2.588B | 4.842B | 3.341B | 2.761B | — | — | — |
| Figure | FY 2026 | FY 2025 | FY 2024 | FY 2023 | FY 2022 | FY 2021 | FY 2020 | FY 2019 | FY 2018 | FY 2017 | FY 2016 | FY 2015 | FY 2014 | FY 2013 |
|---|---|---|---|---|---|---|---|---|---|---|---|---|---|---|
| Share price | 52.815K | 30.278K | 32.4K | 18.402K | 16.337K | 11.356K | 6.599K | 5.211K | 8.421K | 3.973K | 2.742K | 2.851K | 4.024K | 2.651K |
| Price performance 12m | 0.74 | -0.07 | 0.76 | 0.13 | 0.44 | 0.72 | 0.27 | -0.38 | 1.12 | 0.45 | -0.04 | -0.29 | 0.52 | — |
Filed figures
Lines the statements and their notes report beside the headline figures, read from the filings' XBRL as filed (no restatement applied), with figures computed from one filing's own lines. Cash-flow lines carry their cash direction: an outflow is negative. Each period links to its filing; a figure's period, report date and tag are in its tooltip.
| Figure | Mar 2017 | Mar 2018 | Mar 2019 | Mar 2020 | Mar 2021 | Mar 2022 | Mar 2023 | Mar 2024 | Mar 2025 | Mar 2026 |
|---|---|---|---|---|---|---|---|---|---|---|
| Balance sheet detail | ||||||||||
| Trade receivables (JPY) | 9.24B | 10.8B | 11.7B | 10.8B | 11.1B | 15.2B | 12.9B | 16.1B | 13.9B | 15.2B |
| ↳ YoY growth | +7.3% | +17.3% | +8.3% | -7.7% | +2.4% | +36.5% | -15.1% | +24.9% | -13.6% | +9.4% |
| ↳ 5y CAGR | +5.2% | +10.4% | +3.5% | +6.5% | +5.1% | +6.5% | ||||
| Borrowings, current (JPY) | 22.8M | — | — | 900M | 367M | 966M | 333M | 400M | — | — |
| Borrowings, non-current (JPY) | — | — | — | 1.2B | 1.6B | 733M | 400M | — | — | — |
| Cash and deposits (JPY) | 18B | 22B | 22.6B | 29.3B | 34.1B | 44.6B | 49.8B | 55.3B | 71.8B | 67.2B |
| Intangible assets (JPY) | 300M | 275M | 533M | 451M | 261M | 298M | 284M | 318M | 444M | 438M |
| Net debt (borrowings + leases - cash) (JPY) | -18B | — | — | -27.2B | -32.1B | -42.9B | -49.1B | -54.9B | — | — |
| Cash flow detail | ||||||||||
| Operating cash flow (JPY) | 5.35B | 7.54B | 6.97B | 10.7B | 10.7B | 14.8B | 15.6B | 17.2B | 25.4B | 16.9B |
| Purchases of property, plant and equipment (JPY) | -1.97B | -2.67B | -4.32B | -5.41B | -5.54B | -3.74B | -8.7B | -11.2B | -9.91B | -22.5B |
| Purchases of intangible assets (JPY) | -39.5M | -31.4M | -58.8M | -32.1M | -40.7M | -70M | -27M | -74M | -185M | -50M |
| Change in receivables (cash effect) (JPY) | -805M | -1.21B | -334M | 763M | -169M | -3.88B | 2.39B | -3.11B | 2.25B | -1.04B |
| Change in inventories (cash effect) (JPY) | -58.9M | -610M | -1.46B | 2.08B | 872M | -1.53B | -917M | -784M | -2B | -4.26B |
| Change in payables (cash effect) (JPY) | 146M | 267M | 706M | -1.02B | 665M | 1.52B | -1.32B | 441M | -944M | 1.26B |
| Dividends paid (cash effect) (JPY) | -482M | -519M | -569M | -617M | -666M | -863M | -912M | -1.02B | -1.11B | -1.21B |
| Share buybacks (cash effect) (JPY) | -326,000 | -126M | -126M | -62.6M | -2.6M | -2M | -2M | -5M | -1M | -6M |
| Interest paid (cash effect) (JPY) | -863,000 | -7,000 | — | -305,000 | -7.04M | -7M | -5M | -1M | 0.00 | 0.00 |
| Income taxes paid (cash effect) (JPY) | -1.02B | -1.83B | -3.62B | -3.73B | -1.78B | -3.49B | -7.77B | -5.56B | -6.01B | -9.24B |
| Operating cash flow before change in receivables (JPY) | 6.15B | 8.76B | 7.3B | 9.96B | 10.9B | 18.6B | 13.3B | 20.3B | 23.1B | 18B |
| Free cash flow (OCF - PPE - intangibles) (JPY) | 3.34B | 4.84B | 2.59B | 5.28B | 5.14B | 10.9B | 6.92B | 5.98B | 15.3B | -5.59B |
| Income detail | ||||||||||
| Research and development expense (JPY) | 805M | 841M | 974M | 1.11B | 1.31B | 1.45B | 1.43B | 1.41B | 1.67B | 2.1B |
| ↳ 5y CAGR | +13.4% | +12.4% | +11.2% | +7.7% | +8.6% | +10.0% | ||||
| Total comprehensive income (JPY) | 2.09B | 6.22B | 6.61B | 5.17B | 7.52B | 14.2B | 15.4B | 16B | 19.7B | 20.6B |
| Comprehensive income to owners (JPY) | 2.09B | 6.22B | 6.61B | 5.17B | 7.52B | 14.2B | 15.4B | 16B | 19.7B | 20.6B |
| Provision for credit losses (JPY) | 40M | 148,000 | -467,000 | -3.01M | 4.61M | 0.00 | 0.00 | 123M | -67M | -55M |
| Credit cost ratio (credit losses / average receivables) (%) | 0.4% | 0.0% | 0.0% | 0.0% | 0.0% | 0.0% | 0.0% | 0.9% | 0.4% | 0.4% |
| Reported | Jun 23, 2017 | Jun 27, 2018 | Jun 26, 2019 | Jun 26, 2020 | Jun 28, 2021 | Jun 24, 2022 | Jun 23, 2023 | Jun 21, 2024 | Jun 13, 2025 | Jun 12, 2026 |
Sign up to see institutional holdings
Sign UpPodcast Mentions
Sign up to see podcast mentions and sentiment
Sign UpTimely disclosures published on TDnet, newest first, titles as filed in Japanese. The link opens the disclosure on TDnet. Filings with EDINET (periodic reports, extraordinary reports, offerings, holding and buy-back reports), newest first, titles as filed in Japanese. The link opens the filing on EDINET. Announcements made on SGXNet, newest first, routine notices (disclosures of interest, daily buy-backs, listing confirmations, coupons) included. The link opens the announcement on SGX. Press releases from the company's own website, newest first.
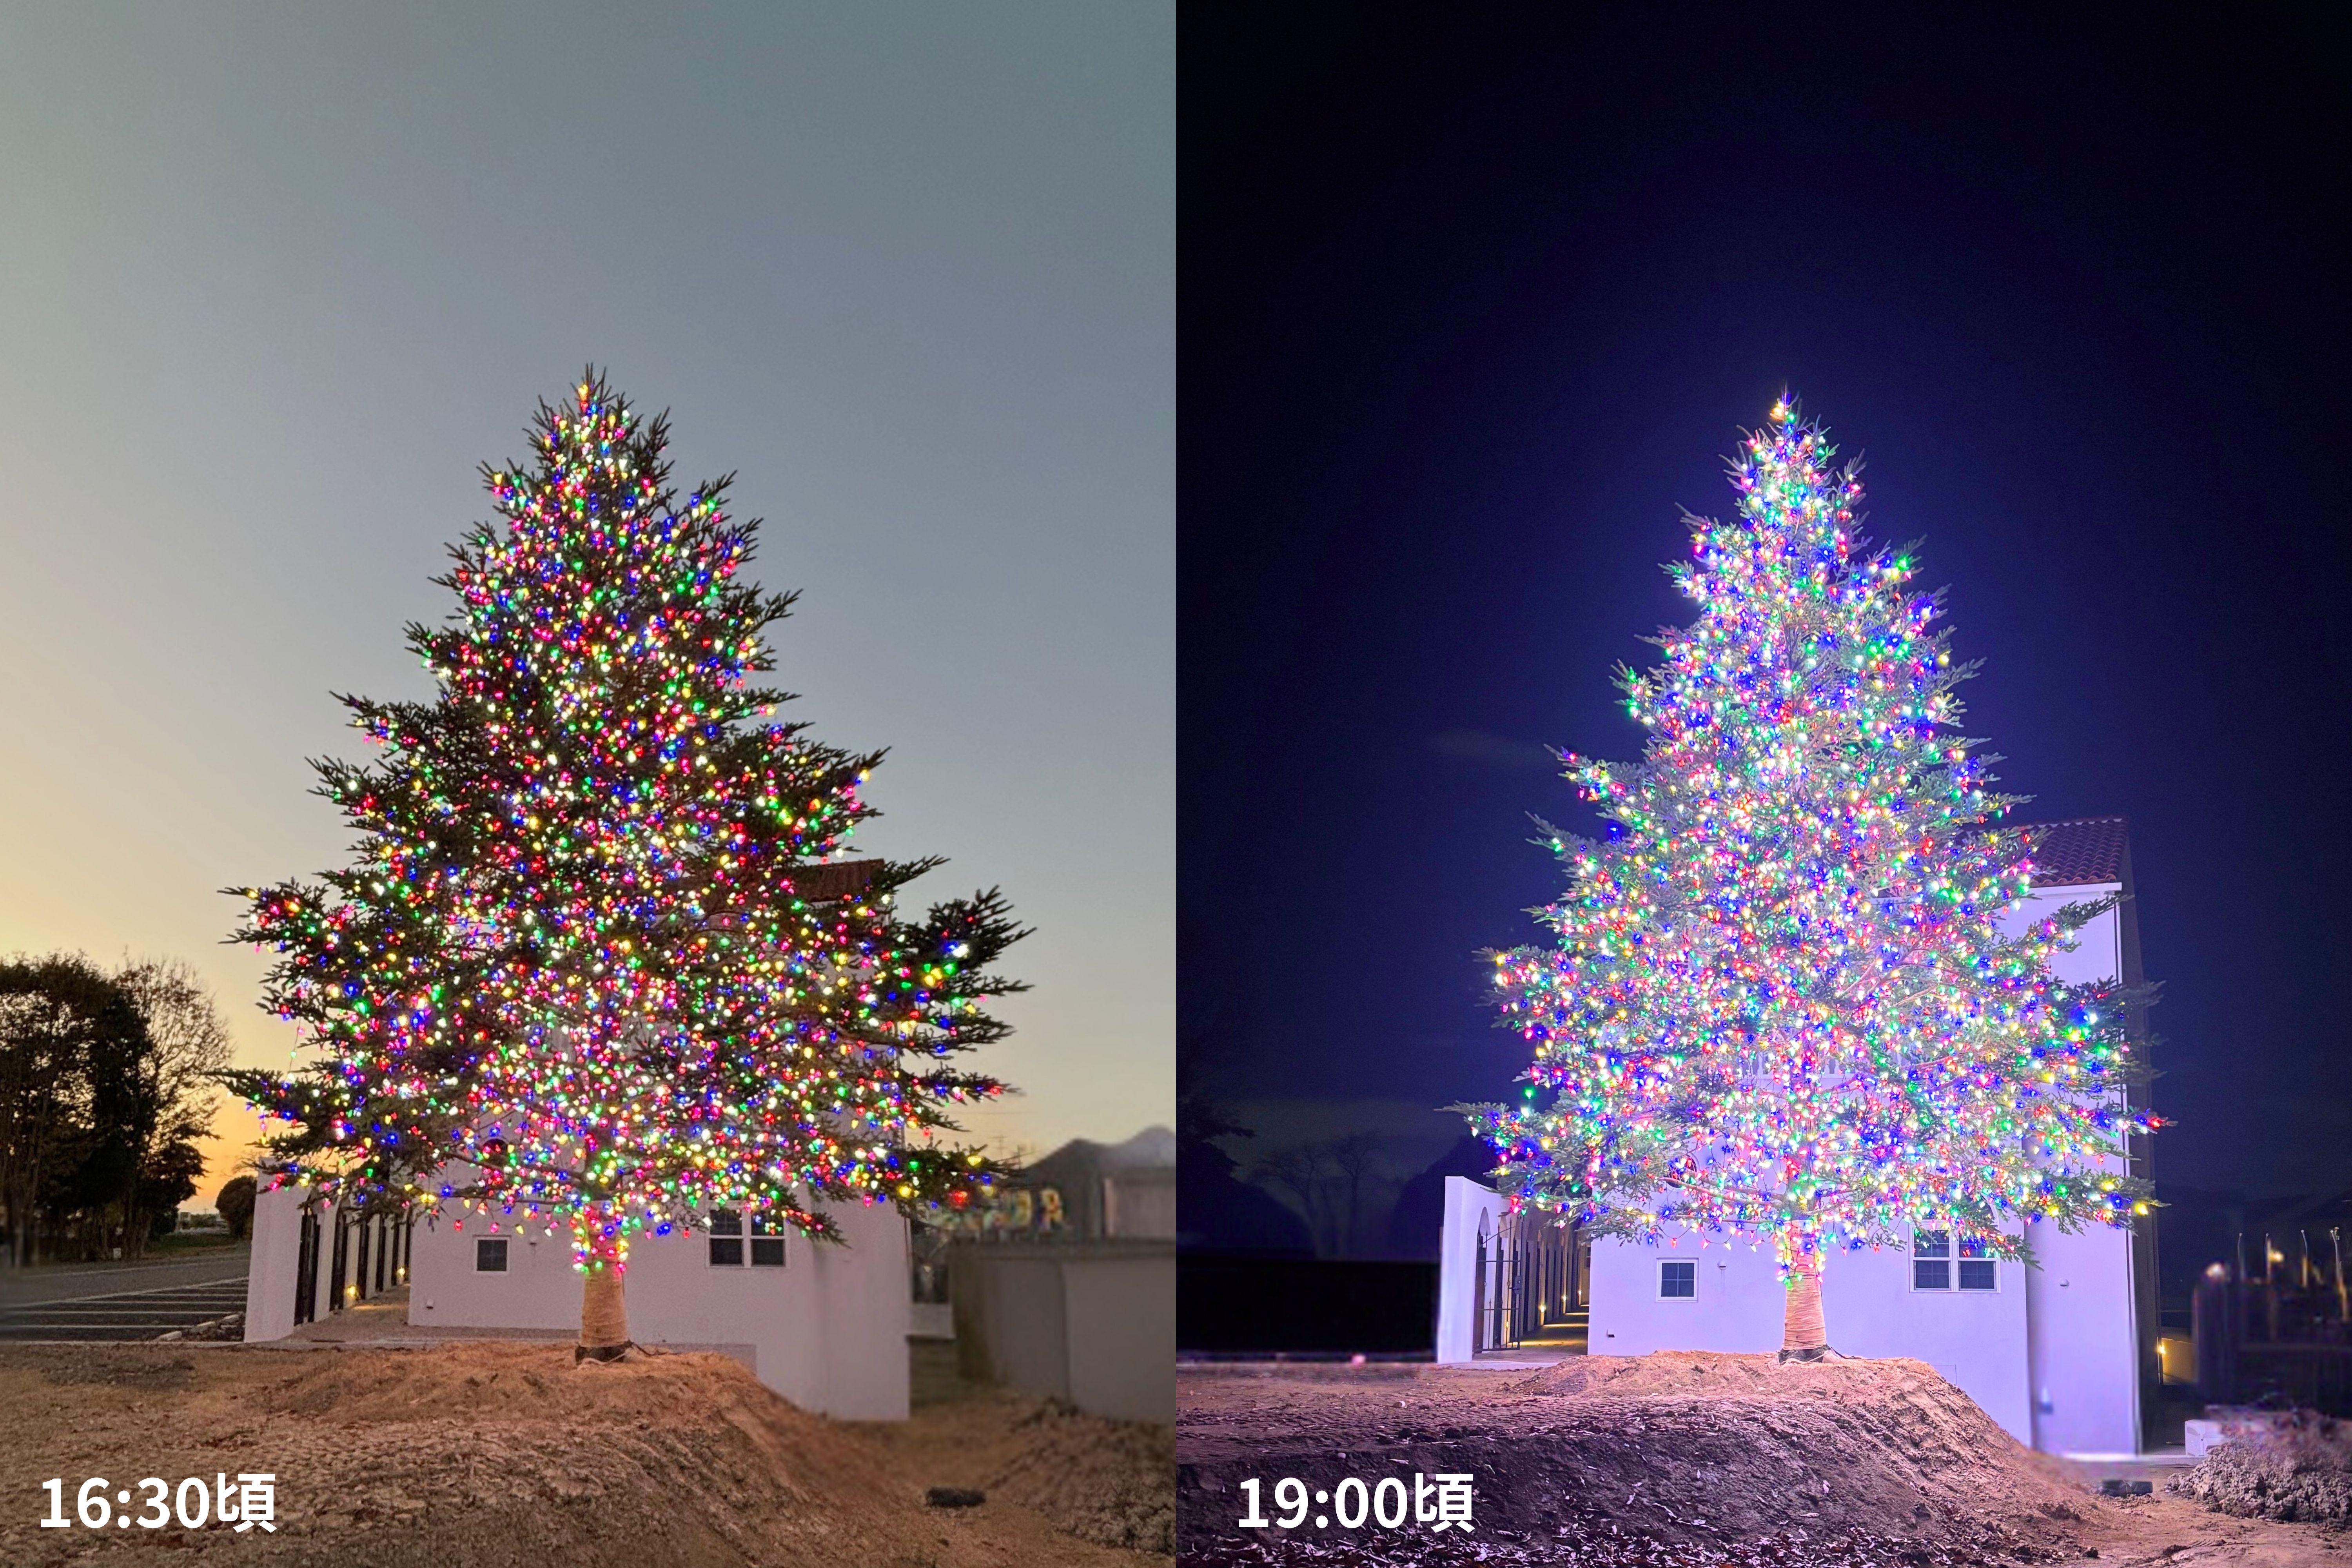
当社株主様を対象としたクリスマスコンサートのご招待につきまして、当初ご用意してお りました WEB 申込みフォームが、今回ご利用いただけなくなりました。 つきましては、代替の受付方法として、メールでの応募受付を実施いたします。 ■ 応募対象者(株主様限定) 2026 年 3 月 31 日現在の当社株主名簿に記載されており、当社株式を 100 株(1 単元)以上 保有されている株主様が対象となります。 ※上記条件を満たしていない方からのお申込みは、ご招待の対象外となりますので、あらか じめご了承ください。 ■ 既にお申込み済みの方へ 10 月 16 日までに WEB 申込みフォームへの登録が完了している方、または FAX・往復はが き・メールでお問い合わせいただいた方につきましては、既に受付が完了しておりますので、 改めてお申込みいただく必要はございません。 ■ 応募方法 下記の必要事項をメール本文にご記入のうえ、指定の宛先までお送りください。 【メール本文への記載事項】
- 株主番号
- 氏名
- フリガナ
- 郵便番号
- 住所
- 電話番号 【応募先メールアドレス】[email protected] ■ 応募締切 2026 年 11 月 25 日(水)23:59 まで ※応募締切に変更はございません。 株主の皆様にはお手数をおかけいたしますが、何卒ご理解とご協力を賜りますようお願い 申し上げます。
2027年3月期第2四半期 決算説明会
2026年10月29日 株式会社MARUWA(5344)
ご注意事項 本資料は投資勧誘を目的とするものではありません。 将来の見込みに関する事項については、現時点で入手可能な情報に基づいており、 将来の事象により変動する可能性があり、内容を保証するものではありません。 なお、本決算説明会の模様は、今後の運営の向上のため録音録画いたします。
1
1.決算概要
FY2026 2Q(7~9月)
前四半期比(対FY26 1Q)
前年同期比(対FY25 2Q)
売上高
27,654
+43.5%
+74.4%
営業利益
11,257
+77.3%
+132.5%
経常利益
11,066
+68.3%
+104.9%
四半期純利益
7,653
+71.4%
+116.5%
QoQ
YonY
(金額:百万円) 🄫🄫 2026 MARUWA CO., LTD.
2
2.四半期推移 四半期として過去最高の業績。 次世代高速通信向けの需要が拡大。半導体・車載関連も堅調に推移。 FY24
30,000
FY25
FY26
50%
25,000
40%
20,000
30%
15,000 20%
10,000
10%
5,000 0
FY24 1Q
2Q
3Q
4Q
FY25 1Q
2Q
3Q
4Q
FY26 1Q
2Q
売上高
16,243
18,579
18,319
18,708
17,256
15,859
19,110
22,251
19,267
27,654
営業利益
5,640
7,148
6,944
7,179
6,002
4,841
6,281
7,852
6,348
11,257
営業利益率
34.7%
38.5%
37.9%
38.4%
34.8%
30.5%
32.9%
35.3%
32.9%
40.7%
0%
(金額:百万円) 🄫🄫 2026 MARUWA CO., LTD.
3
3.市場別売上高 ■市場別売上高
■構成比
情報通信:次世代高速通信向けの需要が拡大。
25年度 2Q
車載:新エネルギー車向けが堅調に推移。
12.4%
半導体:汎用メモリ関連で需要が回復。
26年度 2Q(7~9月)
YoY
150億円
+114%
70億円
車載
46億円
+70%
27億円
半導体
34億円
+55%
22億円
産業機器
21億円 26億円
+5 %
20億円
+18%
22億円
※上記は速報値となります。金額は億単位未満を四捨五入し記載しております。 🄫🄫 2026 MARUWA CO., LTD.
43.5%
13.7%
25年度 2Q
情報通信
照明
13.7%
16.8%
26年度 2Q 情報通信 車載 半導体 産業機器
9.4% 7.6%
12.3%
54.2%
16.6%
照明
4
4.26年度業績見通し 通期(予想)
上期(実績)
YoY
YoY
下期(予想)
YoY
売上高
101,500
+36.3%
46,921
+41.7%
54,579
+32.0%
営業利益
38,300
+53.3%
17,605
+62.4%
20,695
+46.4%
営業利益率
37.7%
―
37.5%
―
37.9%
―
下期にかけて強い需要が見込まれるため、見通しを再度上方修正 通信は次世代高速通信関連の次期モデル向けで需要拡大 通信・車載・半導体で新たに新棟を稼働し、下期より増産予定 前期比+36%の成長を見込む(7/29予想⇒現在予想) 通信+48%⇒+63%
車載+6%⇒+20%
半導体+20%⇒+28%
(金額:百万円)
※為替レートは、1ドル=158円を想定しております。
🄫🄫 2026 MARUWA CO., LTD.
5
5.今後の見通し(市場動向) 市場
(26年度成長率)
情報通信
(YoY+64%)
車載
(+20%)
半導体
(+28%)
産業機器 (+1%)
照明
(+3%)
状況 ・次世代高速通信関連の次期モデル向けで、需要拡大の見通し。 ・下期より瀬戸工場新棟にて増産を進めるほか、先を見据えて新技術及び生産強化への 投資を加速させる。 ・新エネルギー車市場において差別化製品により業績が拡大する見通し。 ・下期より新たに土岐工場新棟にて生産体制を拡充し、併せて生産性の改善により さらなる収益性の改善を図る。 ・汎用メモリ向けが堅調に推移する見通し。 ・第2四半期より稼働を開始した三春工場新棟での生産強化により需要に対応。
・パワーモジュール関連が底堅く推移するほか、医療関連の新規製品の需要が増加する見通し。
・2030年100%のLED化の政府目標に向けたLED需要の増加が見込まれ、 公共・ハイエンド照明ともに堅調な業績が期待される。 🄫🄫 2026 MARUWA CO., LTD.
6
6.設備投資・減価償却 今期は過去最大規模の投資を予定 増産投資に加え、先を見据えた新技術や新市場を開拓する投資を加速 ■設備投資
■減価償却
40,000
投資額up
35,000
25,000 20,000 15,000 10,000
2Q(実績)
5,000 0 (金額:百万円)
8,000
今期(予想)
65億円程度 6,000
30.0%
4,000
20.0%
10.0%
2,000
2Q(実績)
91億
FY21
FY22
FY23
FY24
FY25
FY26
40.0%
FY27以降 🄫🄫 2026 MARUWA CO., LTD.
【売上高比率】
今期(予想)
200~250億
【減価償却費】
【設備投資額】
30,000
50.0%
10,000
28億
0
FY21
FY22
FY23
FY24
FY25
FY26
0.0%
7
7.配当 年間1株当たり110円を予定(8円増配) 今期で14期連続の増配 成長・発展に向けた投資と、持続可能な連続増配を両立する
64 40 20
44
48
52
34
36
38
17
18
19
15
17
18
19
20
22
24
26
FY12
FY13
FY14
FY15
FY16
FY17
FY18
FY19
30 15
(単位:円)
22
24
36
70 36
78 40
26 28
34
38
86 43
94 47
102 51
年間110円 55
期末
43
47
51
55
中間 FY20
FY21
FY22
FY23
FY24
FY25
FY26
FY27以降
今後も着実な連続増配を継続してまいります 🄫🄫 2026 MARUWA CO., LTD.
8
🄫🄫 2026 MARUWA CO., LTD.
9

 企業理念
 Home
Prompts
Click prompts to add them under the company line, click again to take one out, then copy the result into your AI chat. Shared by Asian Century Stocks and Uncovered Thai Stocks. Thank you.
ETFs Holding Maruwa Co., Ltd.
Exchange-traded funds whose newest published daily portfolio holds one of the company's listings, largest weight first.
| ETF | Weight in ETF | Shares | Market value | As of |
|---|---|---|---|---|
| GGTL | 0.98% | 300 | $ 130.631K | Jun 30, 2026 |
| AVDS | 0.05% | 700 | $ 172.924K | Nov 16, 2026 |
| DFIS | 0.04% | 8,300 | $ 2.332M | Nov 12, 2026 |
| DFAX | 0.01% | 4,400 | $ 1.236M | Nov 12, 2026 |
| DFIC | 0.01% | 5,400 | $ 1.517M | Nov 12, 2026 |
| DIHP | 0.01% | 2,200 | $ 618.174K | Nov 12, 2026 |
| DFAI | 0.01% | 3,891 | $ 1.093M | Nov 12, 2026 |
| AVDE | 0.00% | 3,700 | $ 914.024K | Nov 16, 2026 |