Grant of Equity Awards and Director Retainers in the Form of Equity Awards
Bull 0
Bear 0
Routine
|
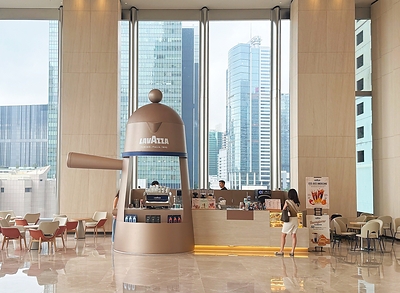
Yum China Holdings, Inc. is a restaurant company that owns, franchises, or holds ownership interests in entities operating restaurants under the KFC, Pizza Hut, Lavazza, Huang Ji Huang, Little Sheep, and Taco Bell concepts. The company holds the exclusive right to operate and sublicense the KFC, Pizza Hut, and Taco Bell brands in mainland China and owns the intellectual property for Little Sheep and Huang Ji Huang. It established a joint venture with Lavazza Group to develop the Lavazza coffee concept in the region. The company's reportable segments are KFC and Pizza Hut, while other brands and delivery operations are grouped into non-reportable segments. KFC operates as a quick-service restaurant brand, and Pizza Hut operates as a casual dining brand. The company serves customers across China, excluding Hong Kong, Macau, and Taiwan. It utilizes a mix of company-owned and franchised stores to expand its geographic footprint. Yum China also maintains a digital and delivery infrastructure to support customer engagement and sales. Summarised from the company's own disclosures, fiscal year ended Apr 2026 |
Industry Restaurants | Homepage yumchina.com |
| Sector Consumer Cyclical | IR page ir.yumchina.com | |
|
Tags
quick-service restaurants, casual dining, franchise operations, coffee, hot pot, pizza, chicken, food delivery, loyalty programs, digital marketing, KFC, Pizza Hut, Lavazza, Huang Ji Huang, Little Sheep, Taco Bell, KCOFFEE, KPRO, Lavazza Group, Meituan, Dongfang Jibai
|
Press page — |
Metrics
| Valuation | |
|---|---|
| Market cap | HK$ 135.37B |
| Market cap (USD) | $ 17.252B |
| P/E | 20.47 |
| PEG | 0.73 |
| P/BV | — |
| P/S | 1.39 |
| P/OCF | 10.93 |
| P/FCF | — |
| Dividend yield | 2.3% |
| Turnover / mcap | 0.18% |
| Returns | |
|---|---|
| ROE | 14.8% |
| ROI | 15.2% |
| ROIC | 15.8% |
| Profit margin | 7.9% |
| Growth | |
|---|---|
| Revenue growing | Yes |
| Profits growing | Yes |
| Revenue up 3y | Yes |
| Revenue up 5y | No |
| Earnings growth 3y (net profit CAGR) | 28.1% |
| Quality | |
|---|---|
| Profitable | Yes |
| Margin expanding | Yes |
| Buying back stock | — |
| Diluting (TTM) | — |
| Debt/Equity | 1.1% |
| Podcast bulls (TTM) | Sign up |
| Podcast bears (TTM) | Sign up |
| Podcast sentiment (TTM) | Sign up |
| Podcast sentiment % (TTM) | Sign up |
| News sentiment (TTM) | 30 |
| Quality score | 53.3% |
| Insiders | |
|---|---|
| Buys, 1w | Sign up |
| Buys, 1m | Sign up |
| Buys, 1y | Sign up |
| Sells, 1w | Sign up |
| Sells, 1m | Sign up |
| Sells, 1y | Sign up |
Sign up to see this company's insider trades
| Figure | FY 2025 | FY 2024 | FY 2023 | FY 2022 | FY 2021 | FY 2020 | FY 2019 | FY 2018 | FY 2017 | FY 2016 | FY 2015 |
|---|---|---|---|---|---|---|---|---|---|---|---|
| Revenue | 11.797B | 11.303B | 10.978B | 9.569B | 9.853B | 8.263B | 8.776B | 8.415B | 7.144B | 6.752B | 6.909B |
| Net profit | 929M | 911M | 827M | 442M | 990M | 784M | 713M | 708M | 403M | 502M | 323M |
| Free cash flow | 840M | 714M | 763M | 734M | 442M | 695M | 750M | 863M | 469M | 428M | 398M |
Filed figures
Lines the statements and their notes report beside the headline figures, read from the filings' XBRL as filed (no restatement applied), with figures computed from one filing's own lines. Cash-flow lines carry their cash direction: an outflow is negative. Each period links to its filing; a figure's period, report date and tag are in its tooltip.
| Figure | Dec 2016 | Dec 2017 | Dec 2018 | Dec 2019 | Dec 2020 | Dec 2021 | Dec 2022 | Dec 2023 | Dec 2024 | Dec 2025 |
|---|---|---|---|---|---|---|---|---|---|---|
| Balance sheet detail | ||||||||||
| Trade receivables (USD) | 74M | 81M | 80M | 88M | 99M | 67M | 64M | 68M | 79M | 95M |
| ↳ YoY growth | -2.6% | +9.5% | -1.2% | +10.0% | +12.5% | -32.3% | -4.5% | +6.3% | +16.2% | +20.3% |
| ↳ 5y CAGR | +5.4% | -2.0% | -4.6% | -3.2% | -2.1% | -0.8% | ||||
| Borrowings, current (USD) | — | — | — | — | — | — | 2M | 168M | 127M | 30M |
| Lease liabilities (USD) | — | — | 25M | 2.21B | 2.39B | 2.84B | 2.4B | 2.37B | 2.29B | 2.32B |
| Cash and deposits (USD) | 885M | 1.06B | 1.27B | 1.05B | 1.16B | 1.14B | 1.13B | 1.13B | 723M | 506M |
| Intangible assets (USD) | 88M | 101M | 116M | 94M | 246M | 272M | 159M | 150M | 144M | 148M |
| Right-of-use assets (USD) | — | — | — | 1.99B | 2.16B | 2.61B | 2.22B | 2.22B | 2.15B | 2.19B |
| Net debt (borrowings + leases - cash) (USD) | — | — | — | — | — | — | 1.27B | 1.41B | 1.69B | 1.84B |
| Cash flow detail | ||||||||||
| Operating cash flow (USD) | 864M | 884M | 1.33B | 1.19B | 1.11B | 1.13B | 1.41B | 1.47B | 1.42B | 1.47B |
| Purchases of property, plant and equipment (USD) | -436M | -415M | -470M | -435M | -419M | -689M | -679M | -710M | -705M | -626M |
| Change in receivables (cash effect) (USD) | -54M | -1M | -13M | -9M | -15M | -5M | -1M | -6M | -9M | -11M |
| Change in inventories (cash effect) (USD) | -96M | -11M | -23M | -77M | 17M | -16M | -19M | -19M | 8M | -14M |
| Change in payables (cash effect) (USD) | 123M | -58M | 254M | 171M | 65M | 118M | 16M | 84M | -3M | -33M |
| Dividends paid (cash effect) (USD) | — | -38M | -161M | -181M | -95M | -203M | -202M | -216M | -248M | -353M |
| Share buybacks (cash effect) (USD) | — | -128M | -307M | -265M | -8M | -75M | -466M | -613M | -1.25B | -1.14B |
| Interest paid (cash effect) (USD) | — | — | — | — | — | — | — | -3M | -4M | — |
| Income taxes paid (cash effect) (USD) | -182M | -232M | -208M | -255M | -170M | -255M | -204M | -324M | -393M | -370M |
| Share-based compensation (USD) | 16M | 26M | 24M | 26M | 36M | 41M | 42M | 64M | 41M | 42M |
| Operating cash flow before change in receivables (USD) | 918M | 885M | 1.35B | 1.19B | 1.13B | 1.14B | 1.41B | 1.48B | 1.43B | 1.48B |
| Free cash flow (OCF - PPE - intangibles) (USD) | 428M | 469M | 863M | 750M | 695M | 442M | 734M | 763M | 714M | 840M |
| Income detail | ||||||||||
| Research and development expense (USD) | 5M | 5M | 4M | 4M | 3M | 6M | 6M | 6M | 6M | 8M |
| ↳ 5y CAGR | -4.4% | -9.7% | +3.7% | +3.7% | +8.4% | +8.4% | +21.7% | |||
| Total comprehensive income (USD) | 382M | 571M | 576M | 711M | 1.04B | 1.13B | 47M | 755M | 850M | 1.22B |
| Comprehensive income to owners (USD) | 373M | 540M | 554M | 681M | 1B | 1.09B | 71M | 701M | 799M | 1.11B |
| Reported | Mar 8, 2017 | Feb 27, 2018 | Nov 8, 2019 | Feb 27, 2020 | Feb 26, 2021 | Feb 28, 2022 | Nov 9, 2023 | Feb 29, 2024 | Feb 27, 2025 | Feb 27, 2026 |
Sign up to see institutional holdings
Sign UpPodcast Mentions
Sign up to see podcast mentions and sentiment
Sign UpAnnouncements and reports published on HKEXnews, newest first, monthly and next-day returns, proxy forms and board-meeting notices included. The link opens the announcement on HKEXnews. Material events reported to the SEC on Form 8-K or 6-K, newest first. The link opens the filing itself on EDGAR. Press releases from the company's own website, newest first.
Overseas Regulatory Announcement - Form 10-Q
Bull 0
Bear 0
Routine
List of Directors and Their Roles and Functions
Bull 0
Bear 0
Routine

 View original content:
 View original content:
 View original content:

 View original content:

Prompts
Click prompts to add them under the company line, click again to take one out, then copy the result into your AI chat. Shared by Asian Century Stocks and Uncovered Thai Stocks. Thank you.
Yum China Holdings, Inc. (ticker 9987), listed in Hong Kong.
Copied
ETFs Holding Yum China Holdings, Inc.
Exchange-traded funds whose newest published daily portfolio holds one of the company's listings, largest weight first.
| ETF | Weight in ETF | Shares | Market value | As of |
|---|---|---|---|---|
| EPEM | 2.60% | 3,881 | $ 197.388K | Nov 13, 2026 |
| TMFG | 2.29% | 181,769 | $ 8.109M | Aug 31, 2026 |
| PIEQ | 2.14% | 698,500 | $ 28.464M | Jun 30, 2026 |
| WBIF | 2.11% | 12,107 | $ 494.813K | Jun 30, 2026 |
| TIIV | 1.62% | 11,008 | $ 530.365K | Jul 31, 2026 |
| WBIG | 1.54% | 10,374 | $ 423.985K | Jun 30, 2026 |
| EPIN | 1.30% | 2,150 | $ 106.049K | Nov 13, 2026 |
| ADVE | 1.11% | 2,484 | $ 101.521K | Jun 30, 2026 |
| MEM | 0.91% | 12,445 | $ 508.627K | Jun 30, 2026 |
| GEME | 0.87% | 78,100 | $ 3.192M | Jun 30, 2026 |
| DEHP | 0.77% | 63,910 | $ 3.158M | Nov 12, 2026 |
| JDIV | 0.74% | 1,774 | $ 91.148K | Nov 17, 2026 |
| AVSE | 0.52% | 21,641 | $ 1.113M | Nov 16, 2026 |
| JGLO | 0.44% | 496,740 | $ 25.523M | Nov 17, 2026 |
| JADE | 0.43% | 2,261 | $ 116.17K | Nov 17, 2026 |
| MFSI | 0.43% | 116,661 | $ 5.204M | Aug 31, 2026 |
| JEMA | 0.30% | 92,320 | $ 4.743M | Nov 17, 2026 |
| DFEM | 0.22% | 404,910 | $ 20.008M | Nov 12, 2026 |
| DFAE | 0.17% | 309,750 | $ 15.318M | Nov 12, 2026 |
| NTSE | 0.16% | 2,290 | $ 93.592K | Jun 30, 2026 |
| AVEM | 0.15% | 782,178 | $ 40.243M | Nov 16, 2026 |
| TIER | 0.10% | 750 | $ 35.538K | Jul 31, 2026 |
| DFAX | 0.10% | 231,323 | $ 11.438M | Nov 12, 2026 |