XPENG Reports Third Quarter 2026 Unaudited Financial Results
Bull 3
Bear 0
Results
9868
|
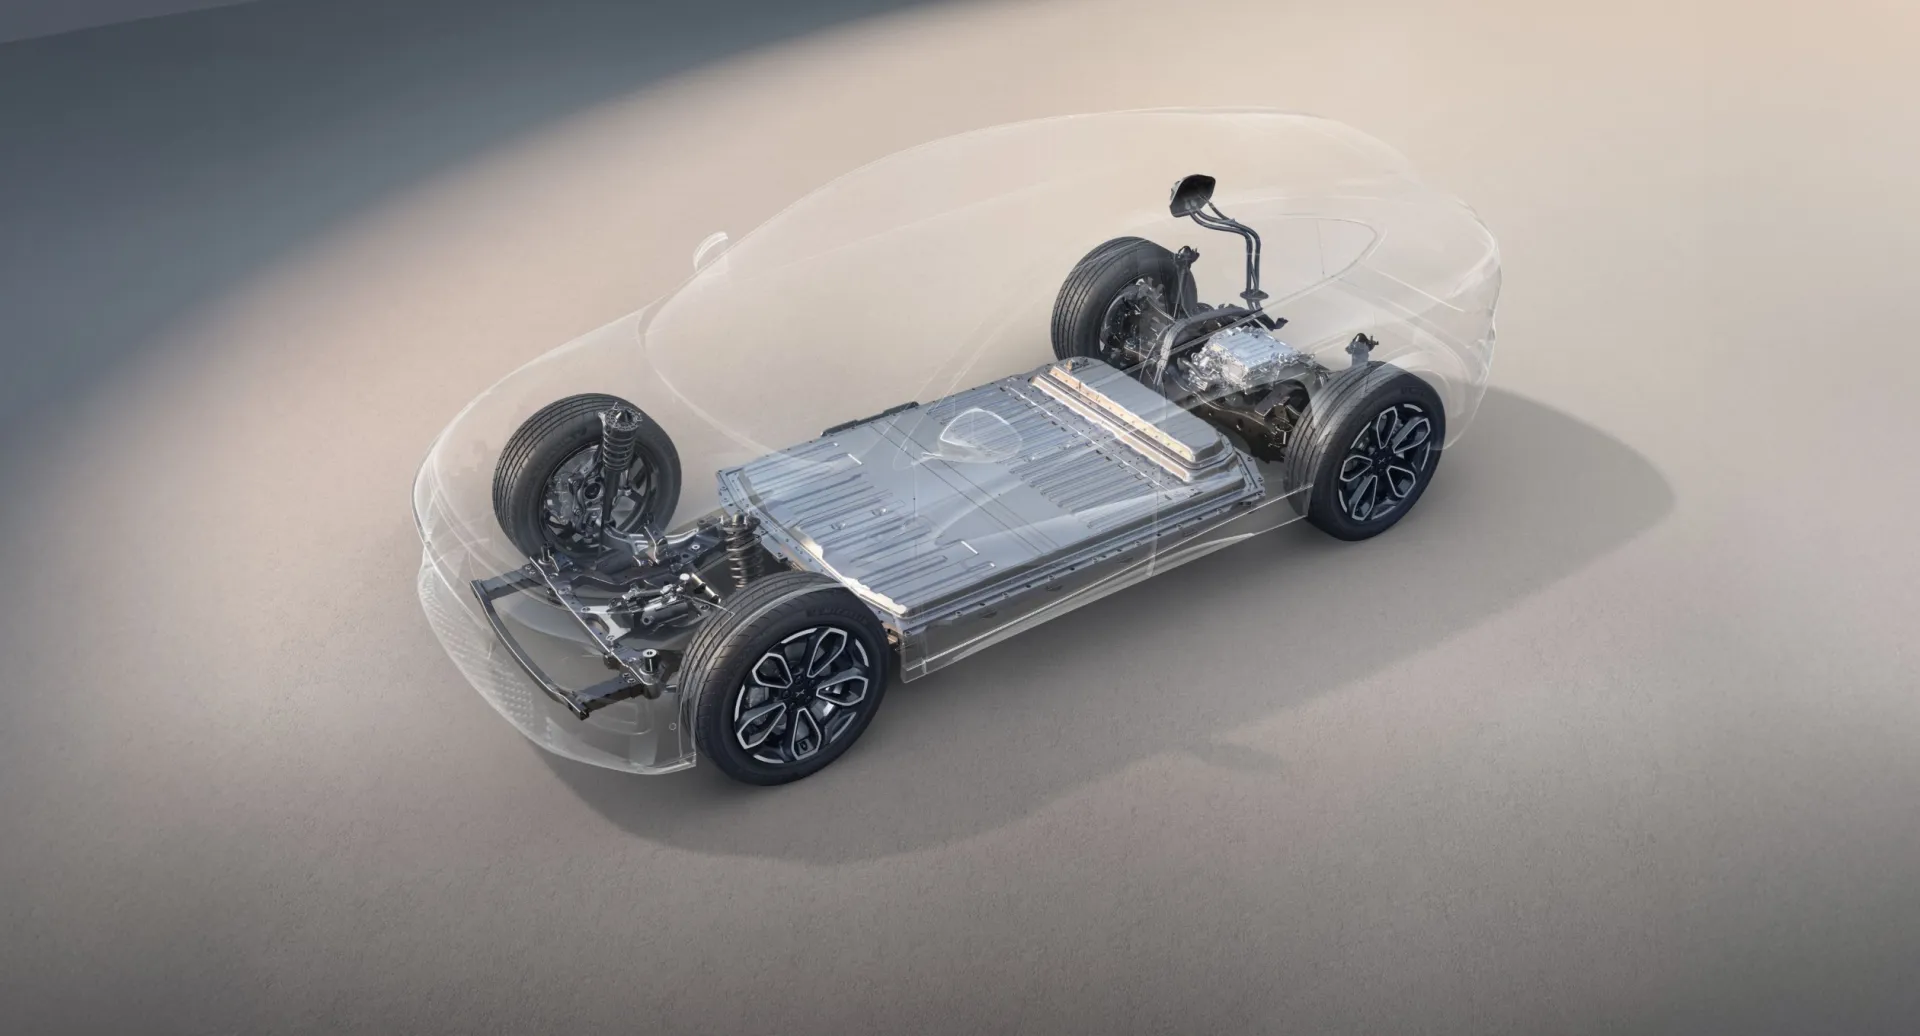
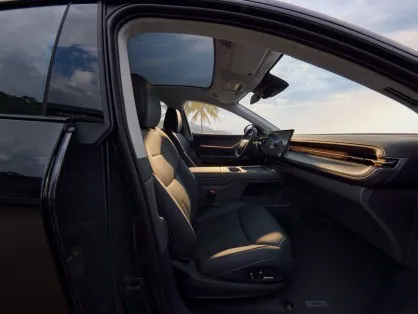
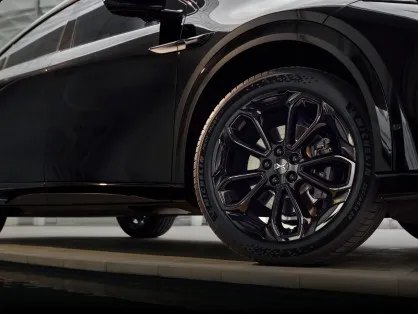
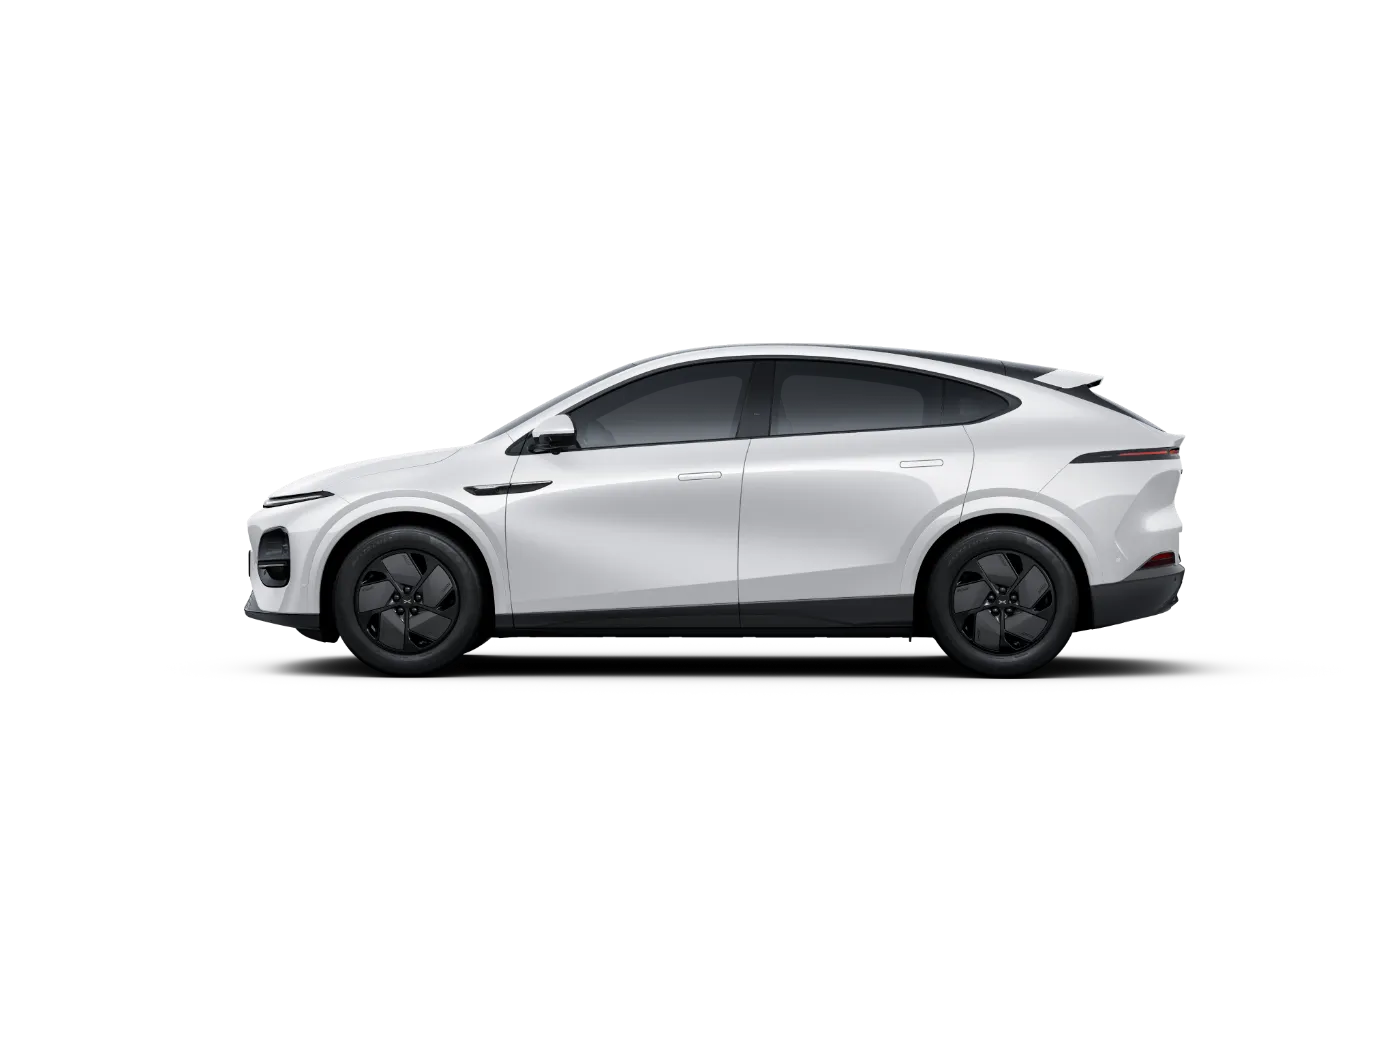
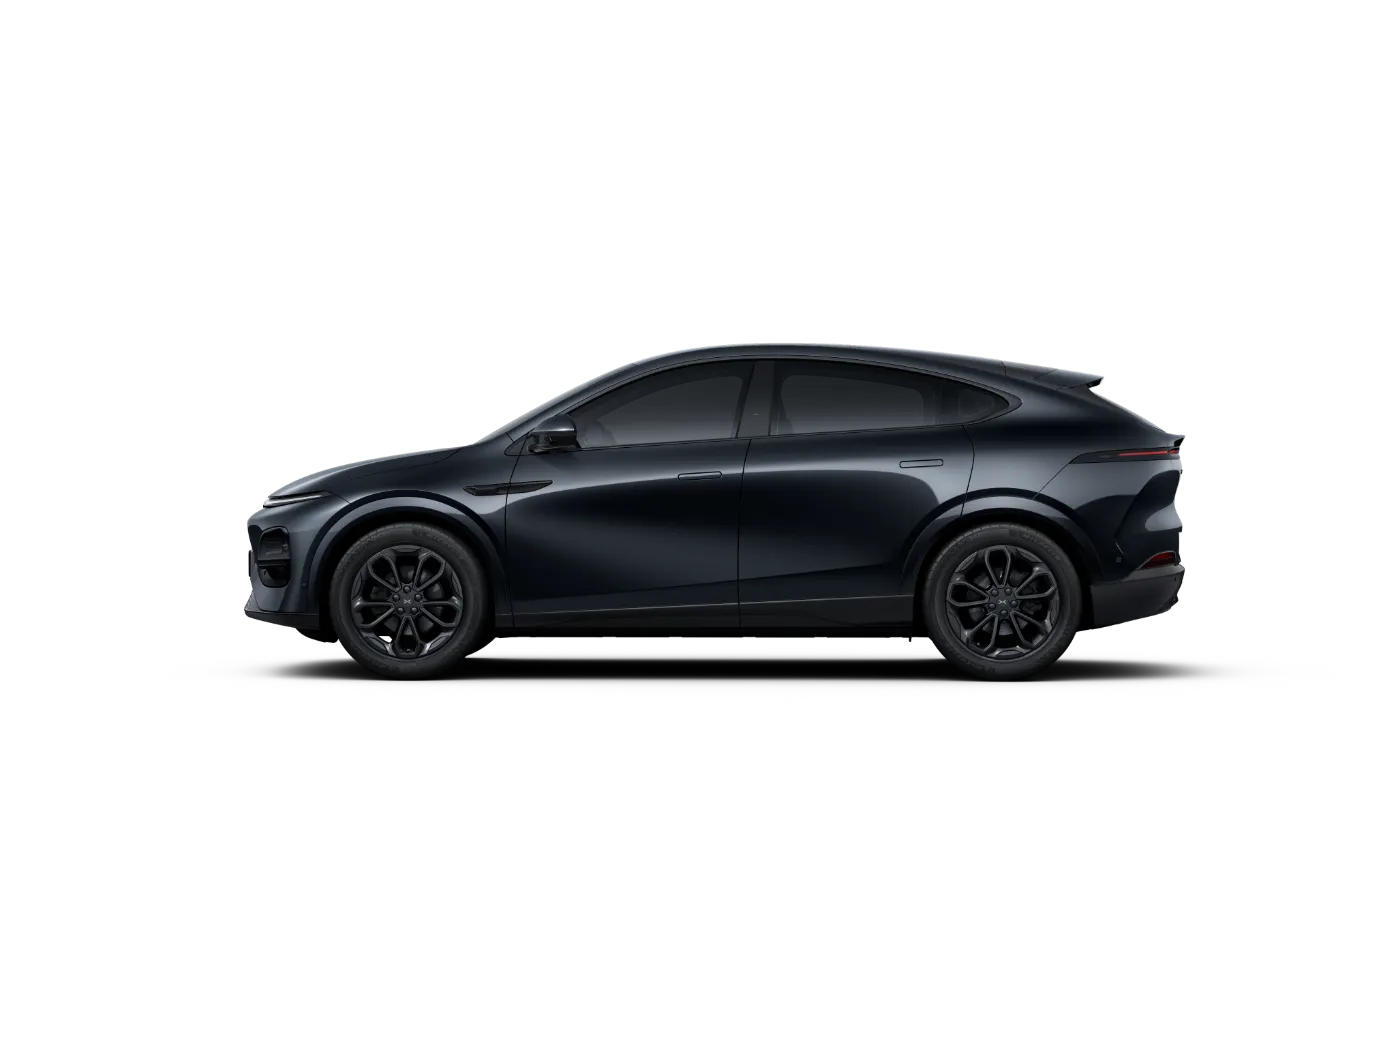
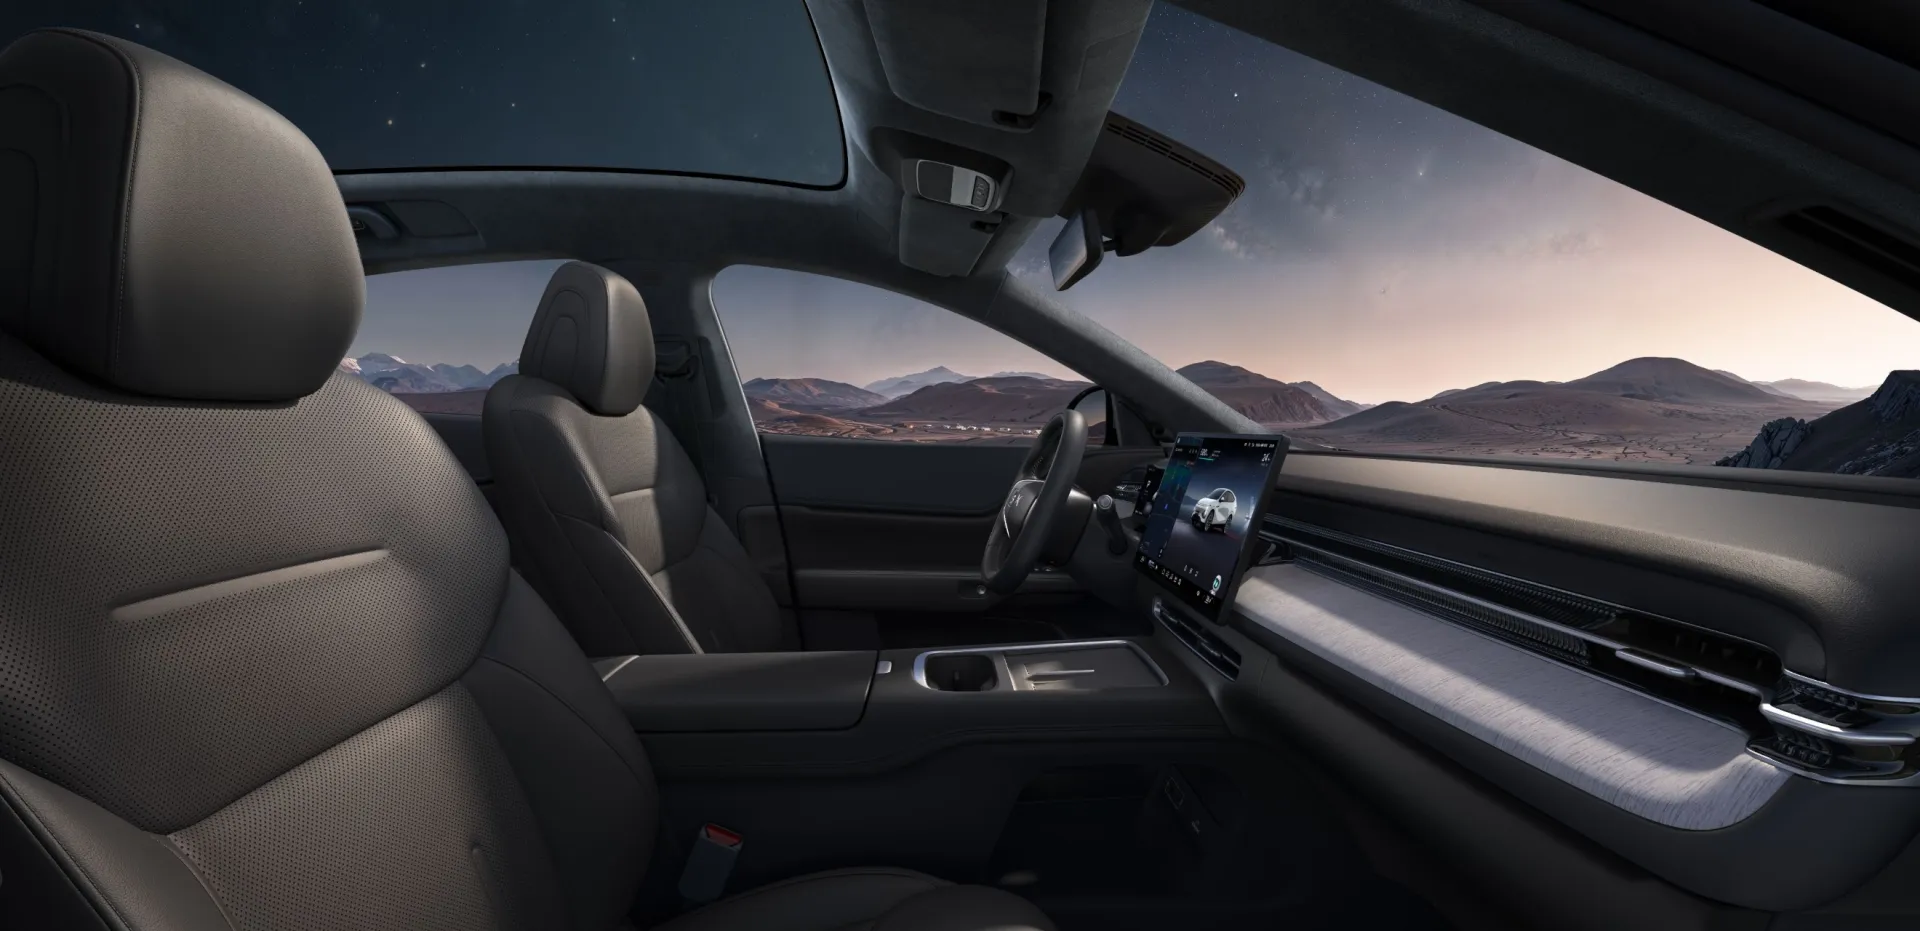
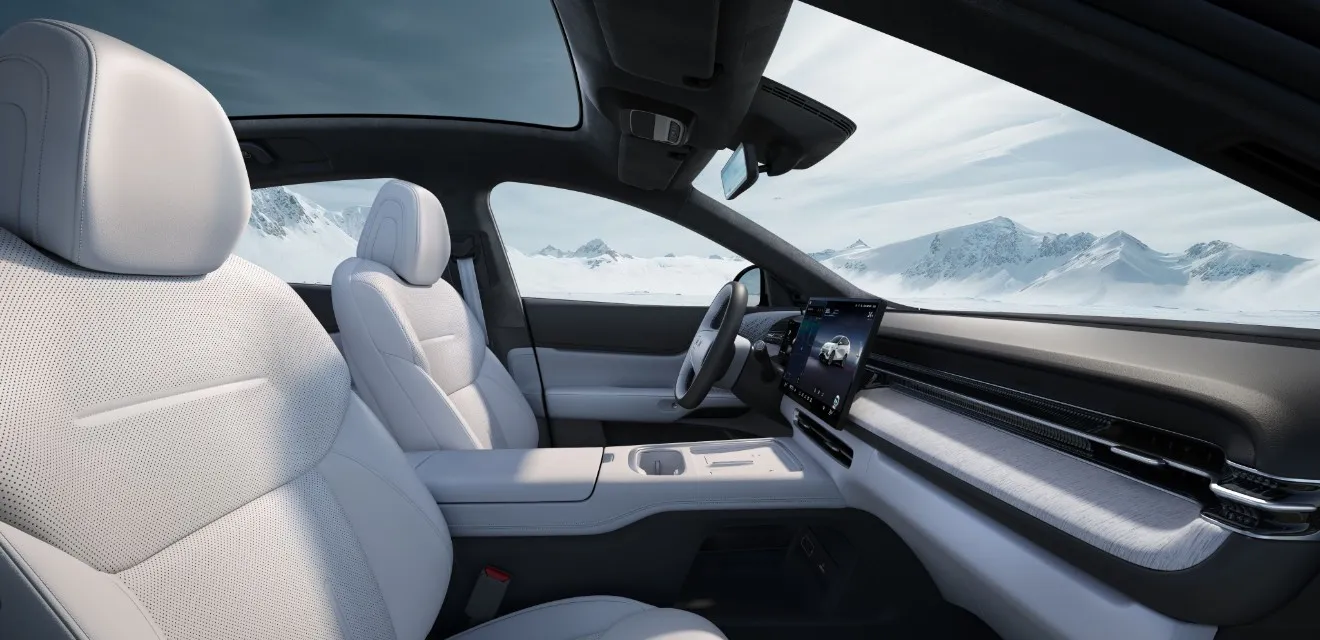
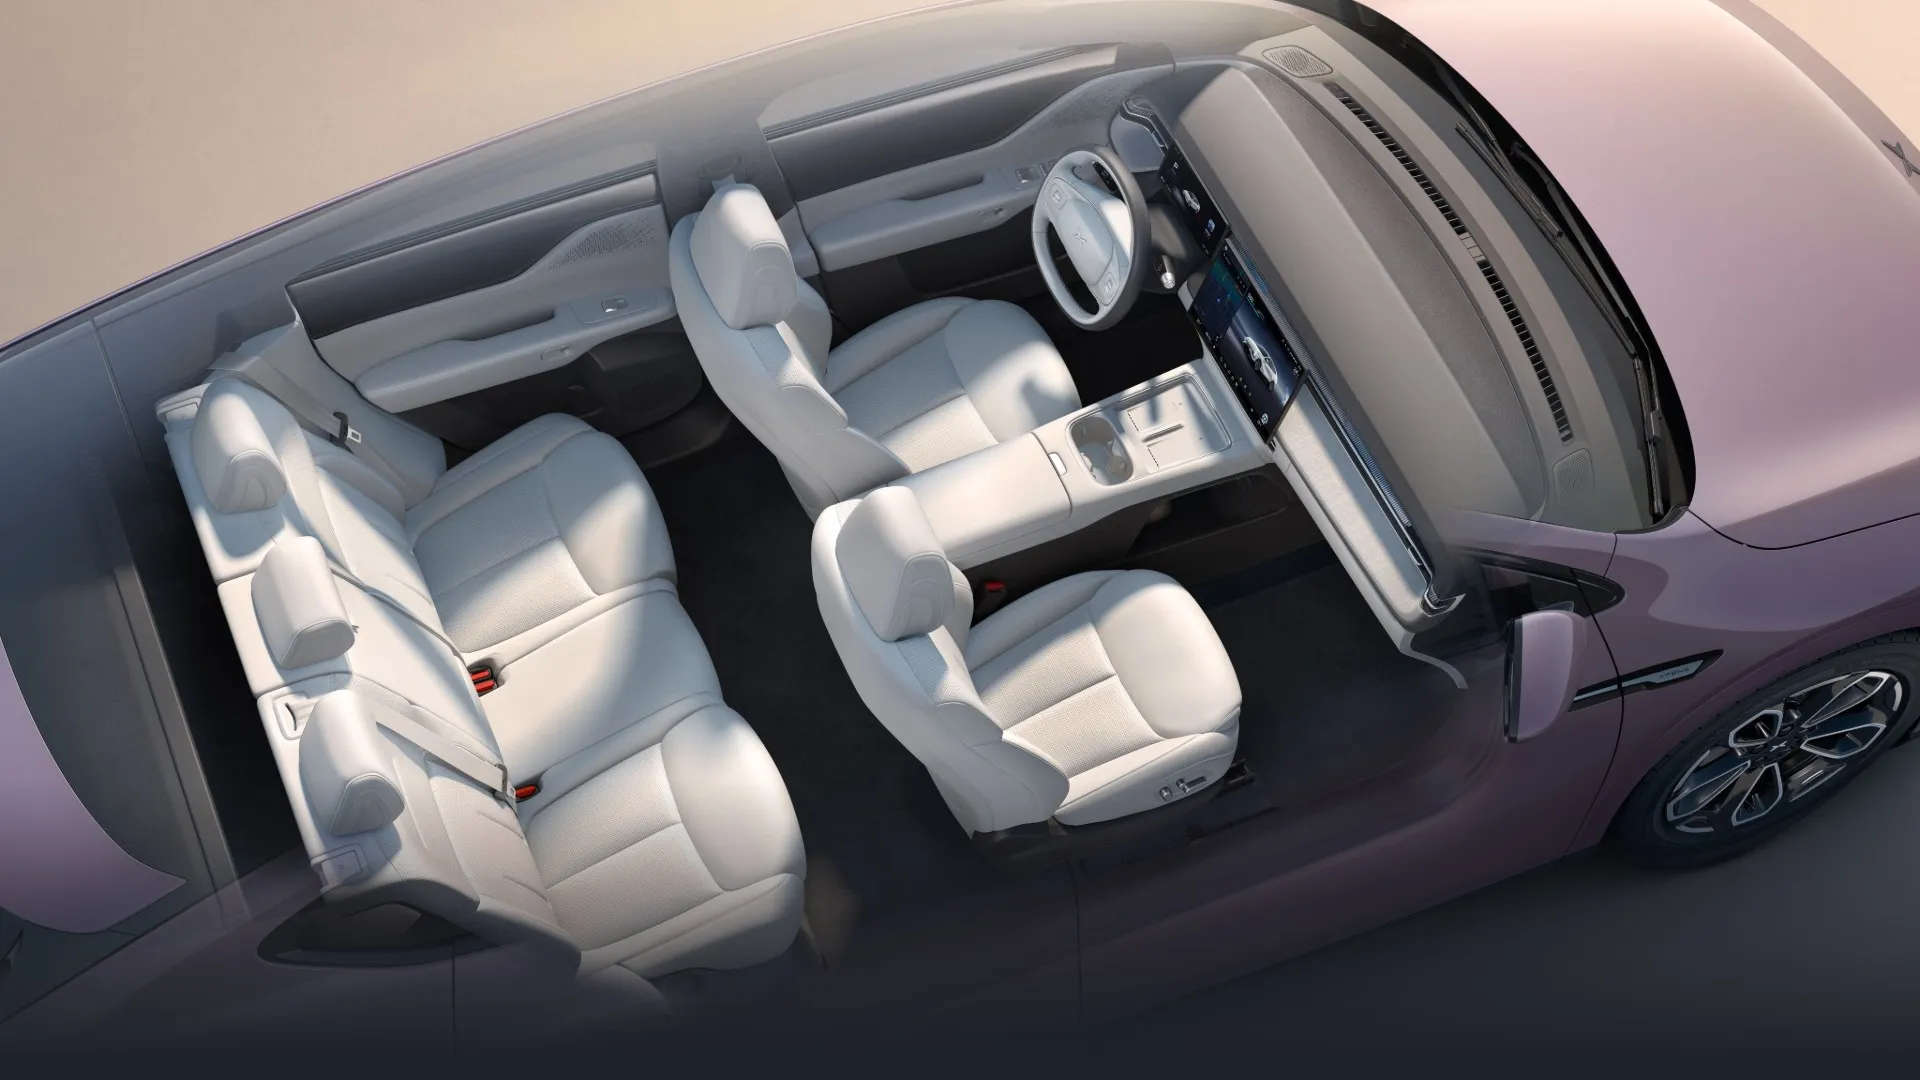
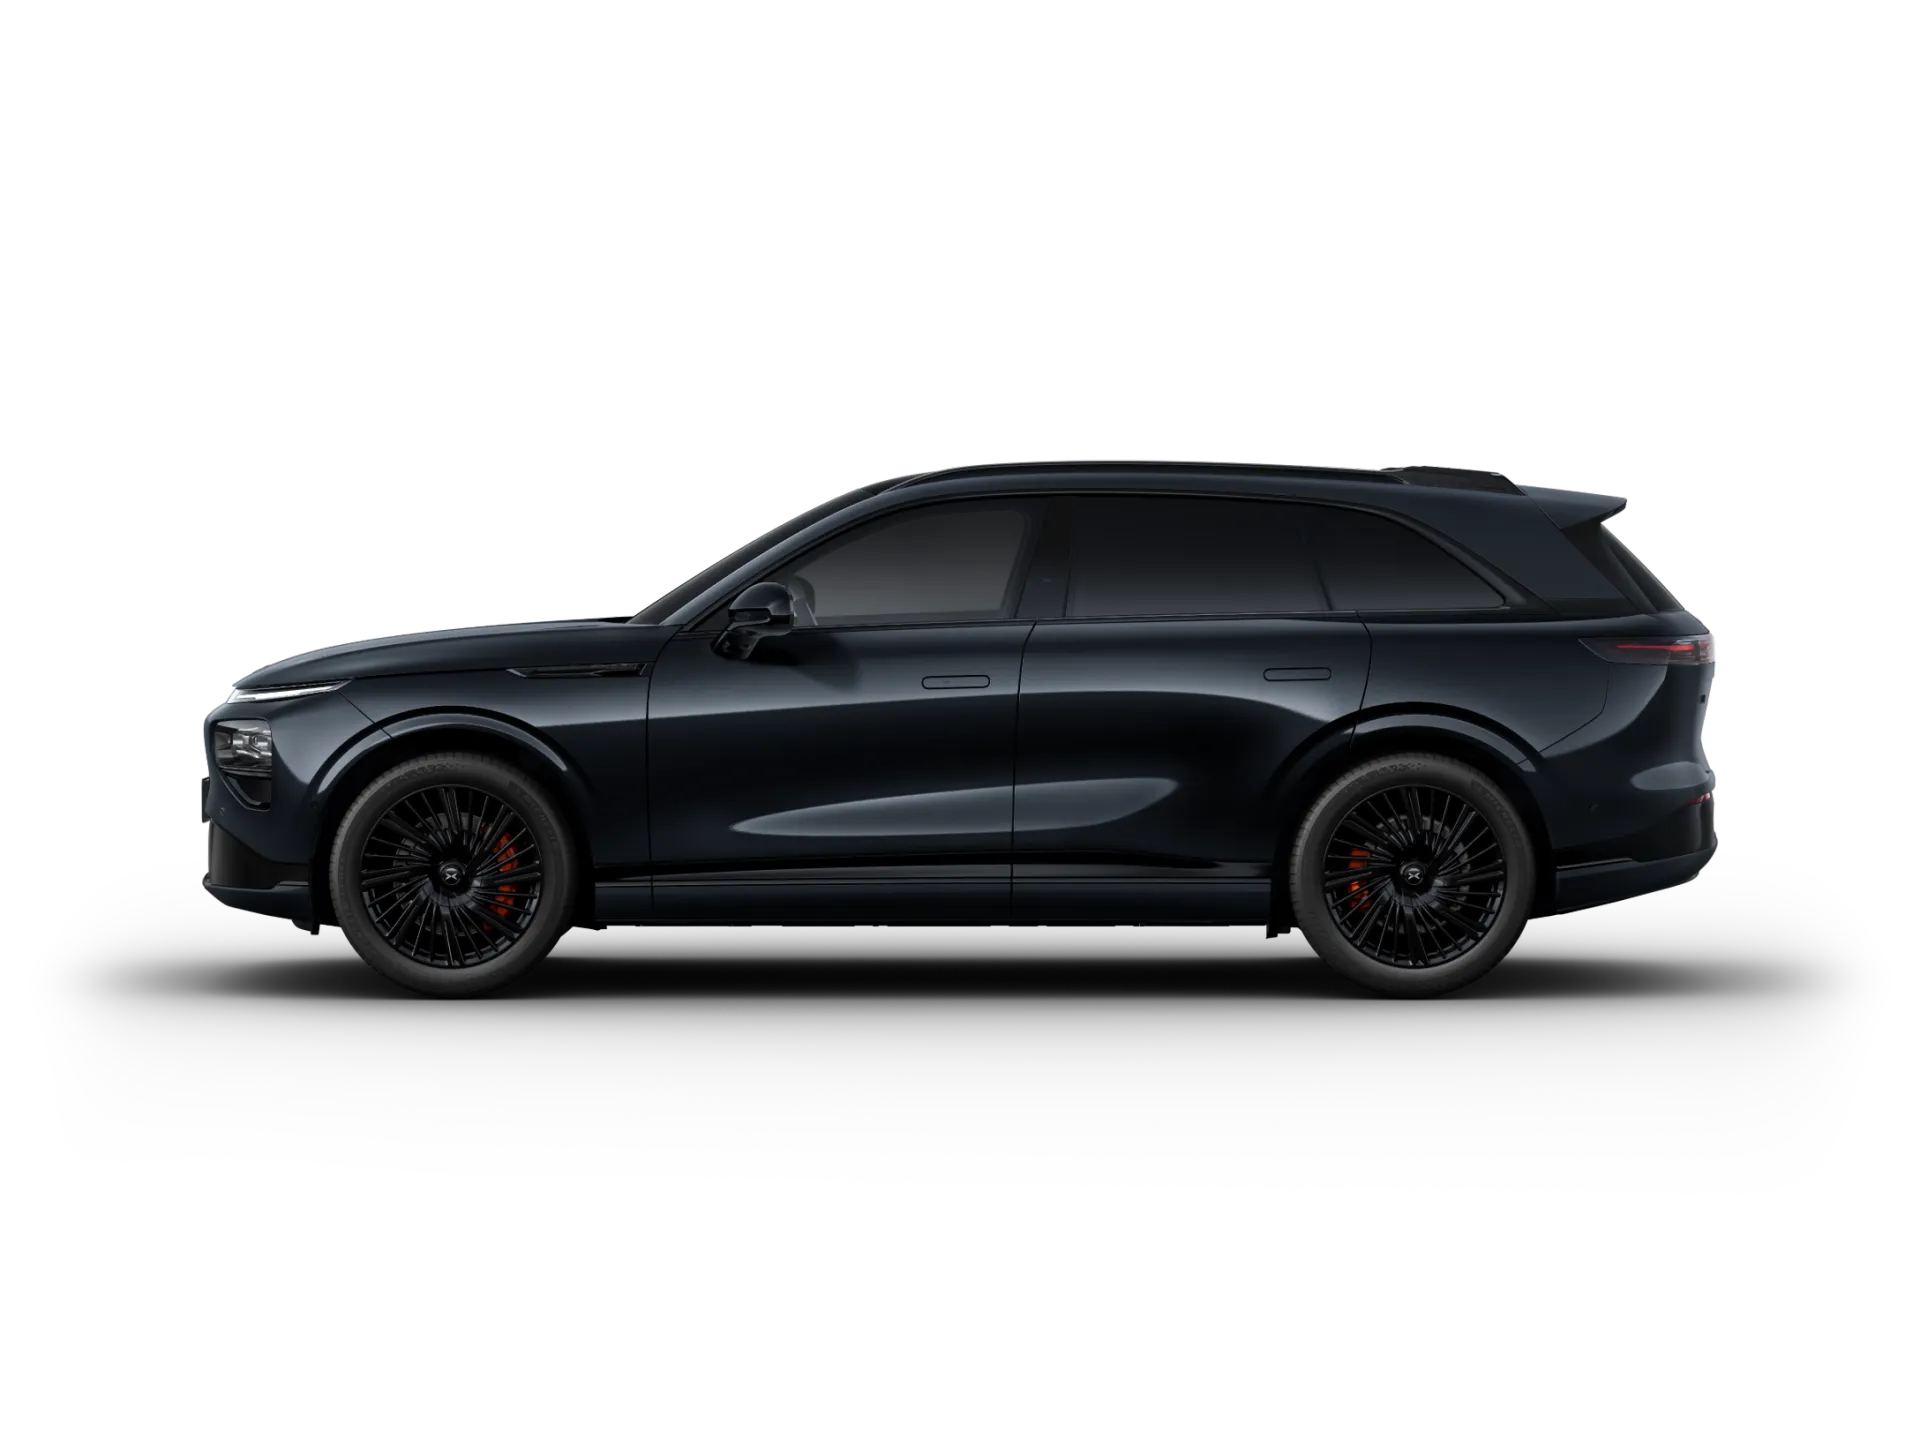
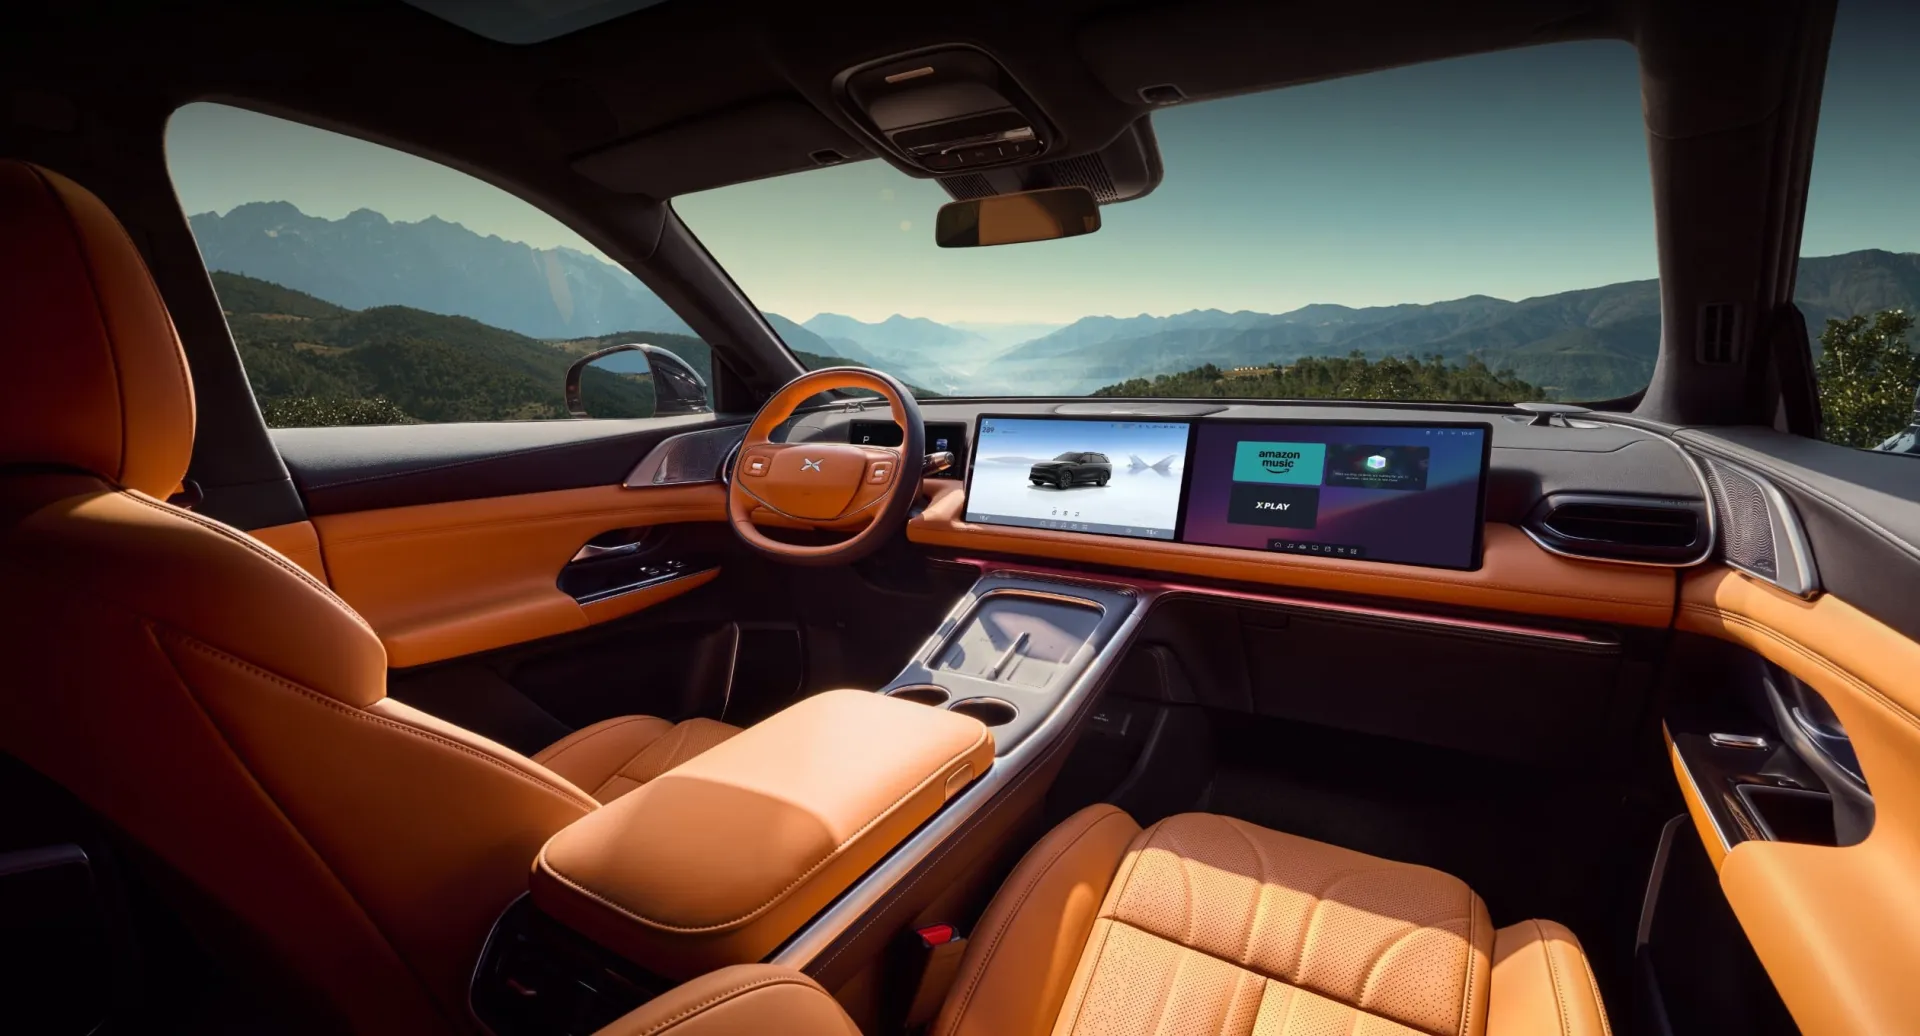
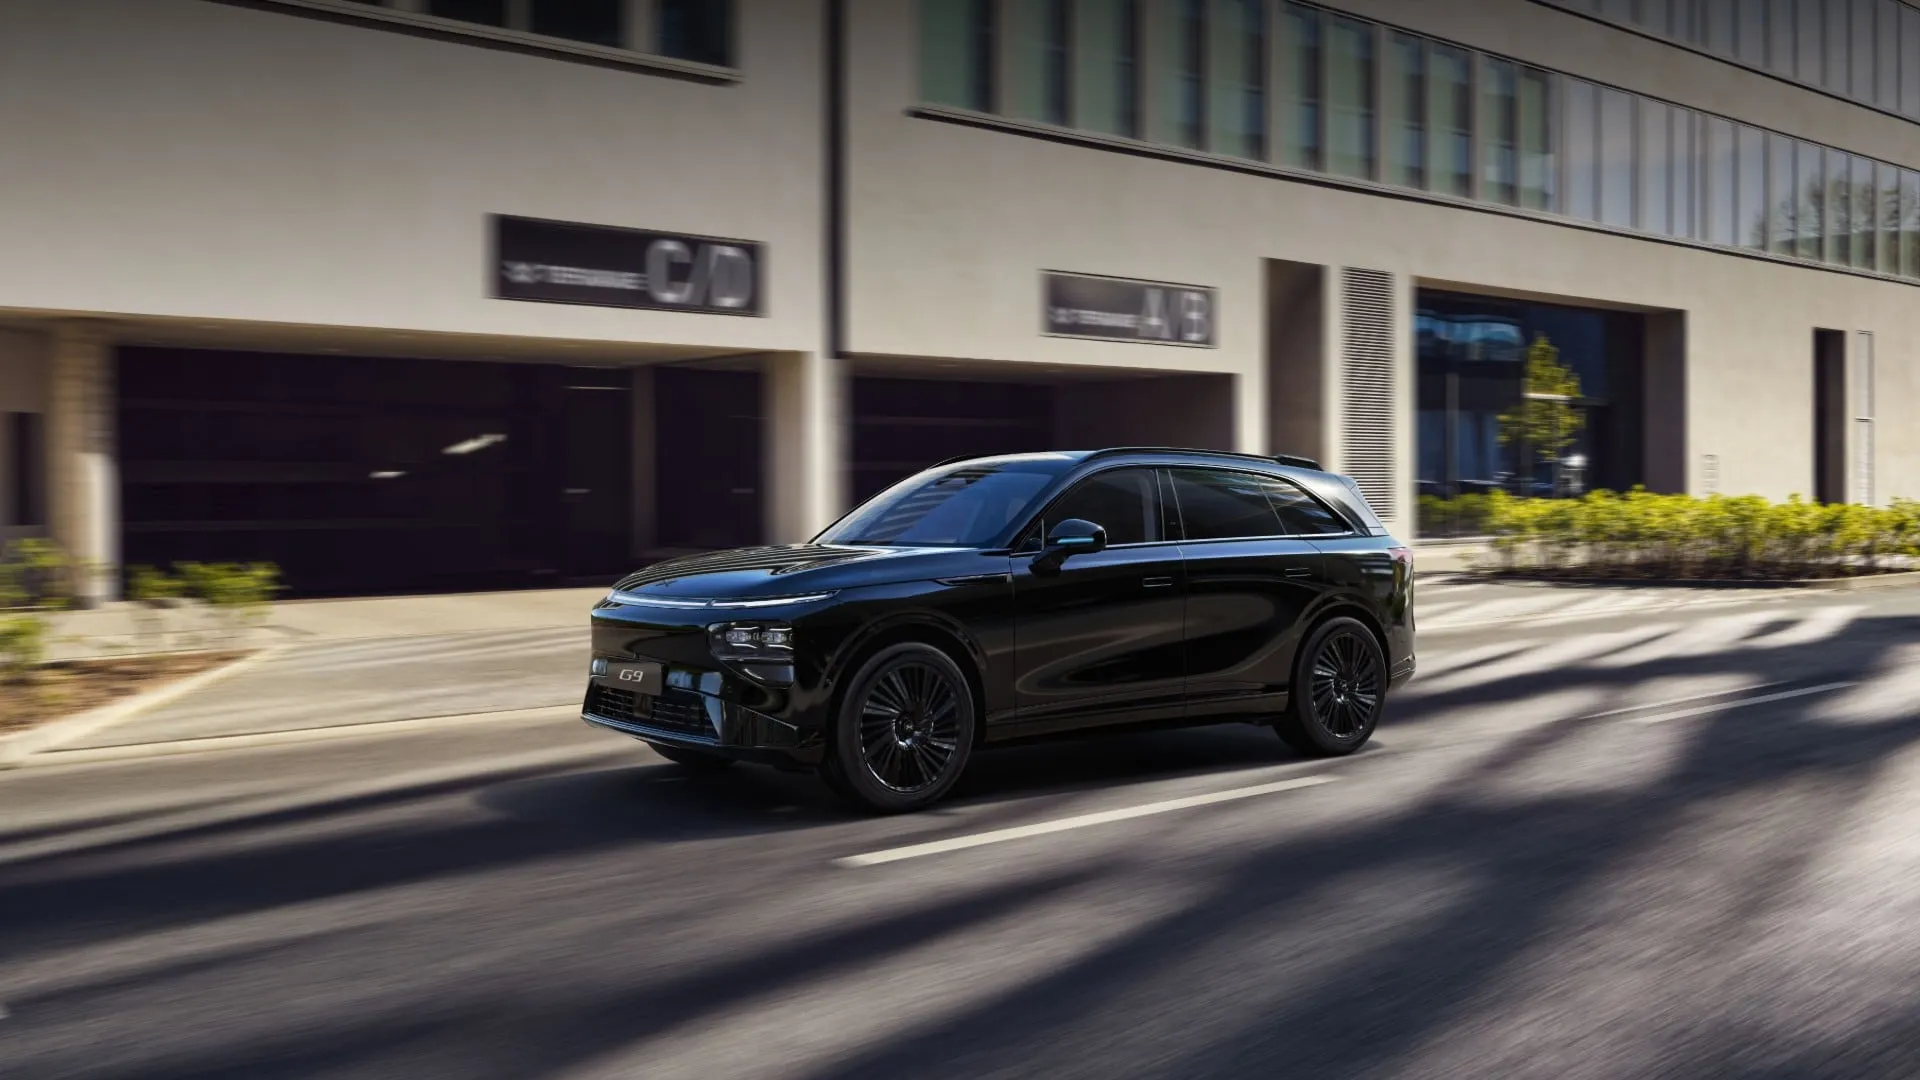
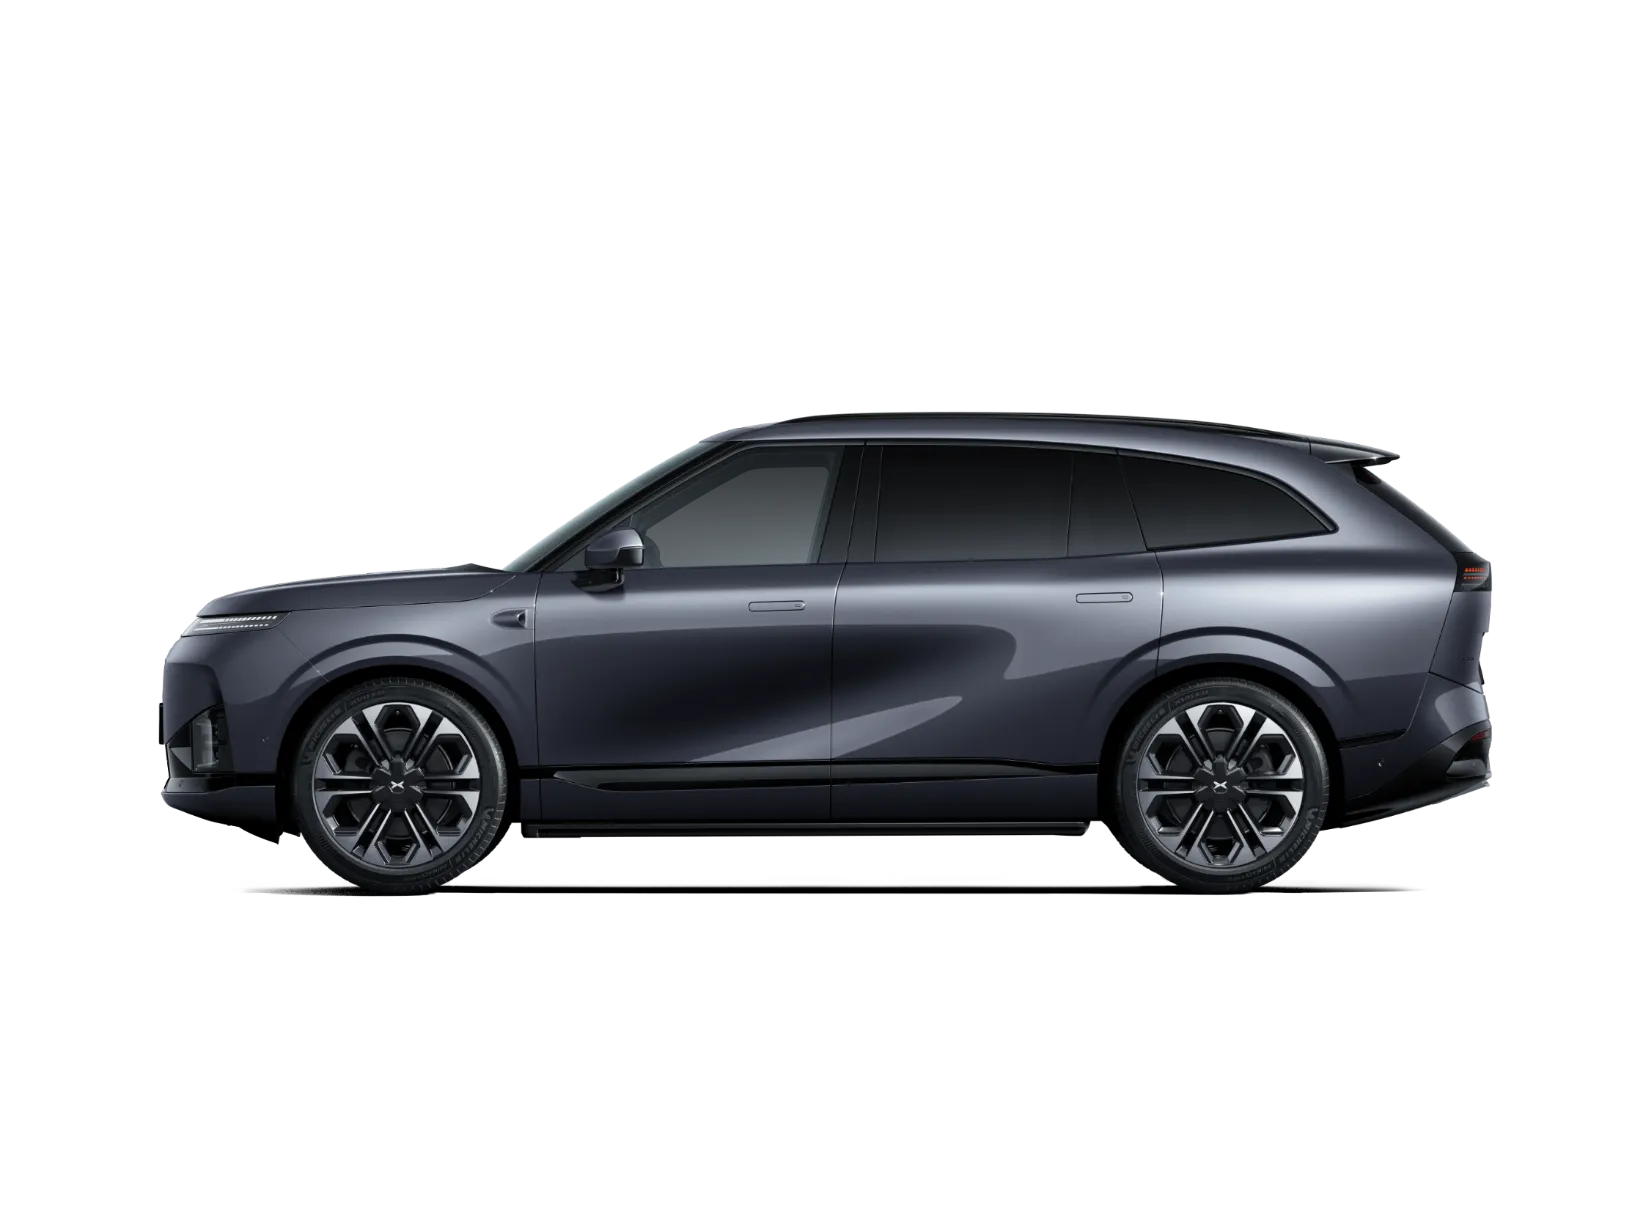
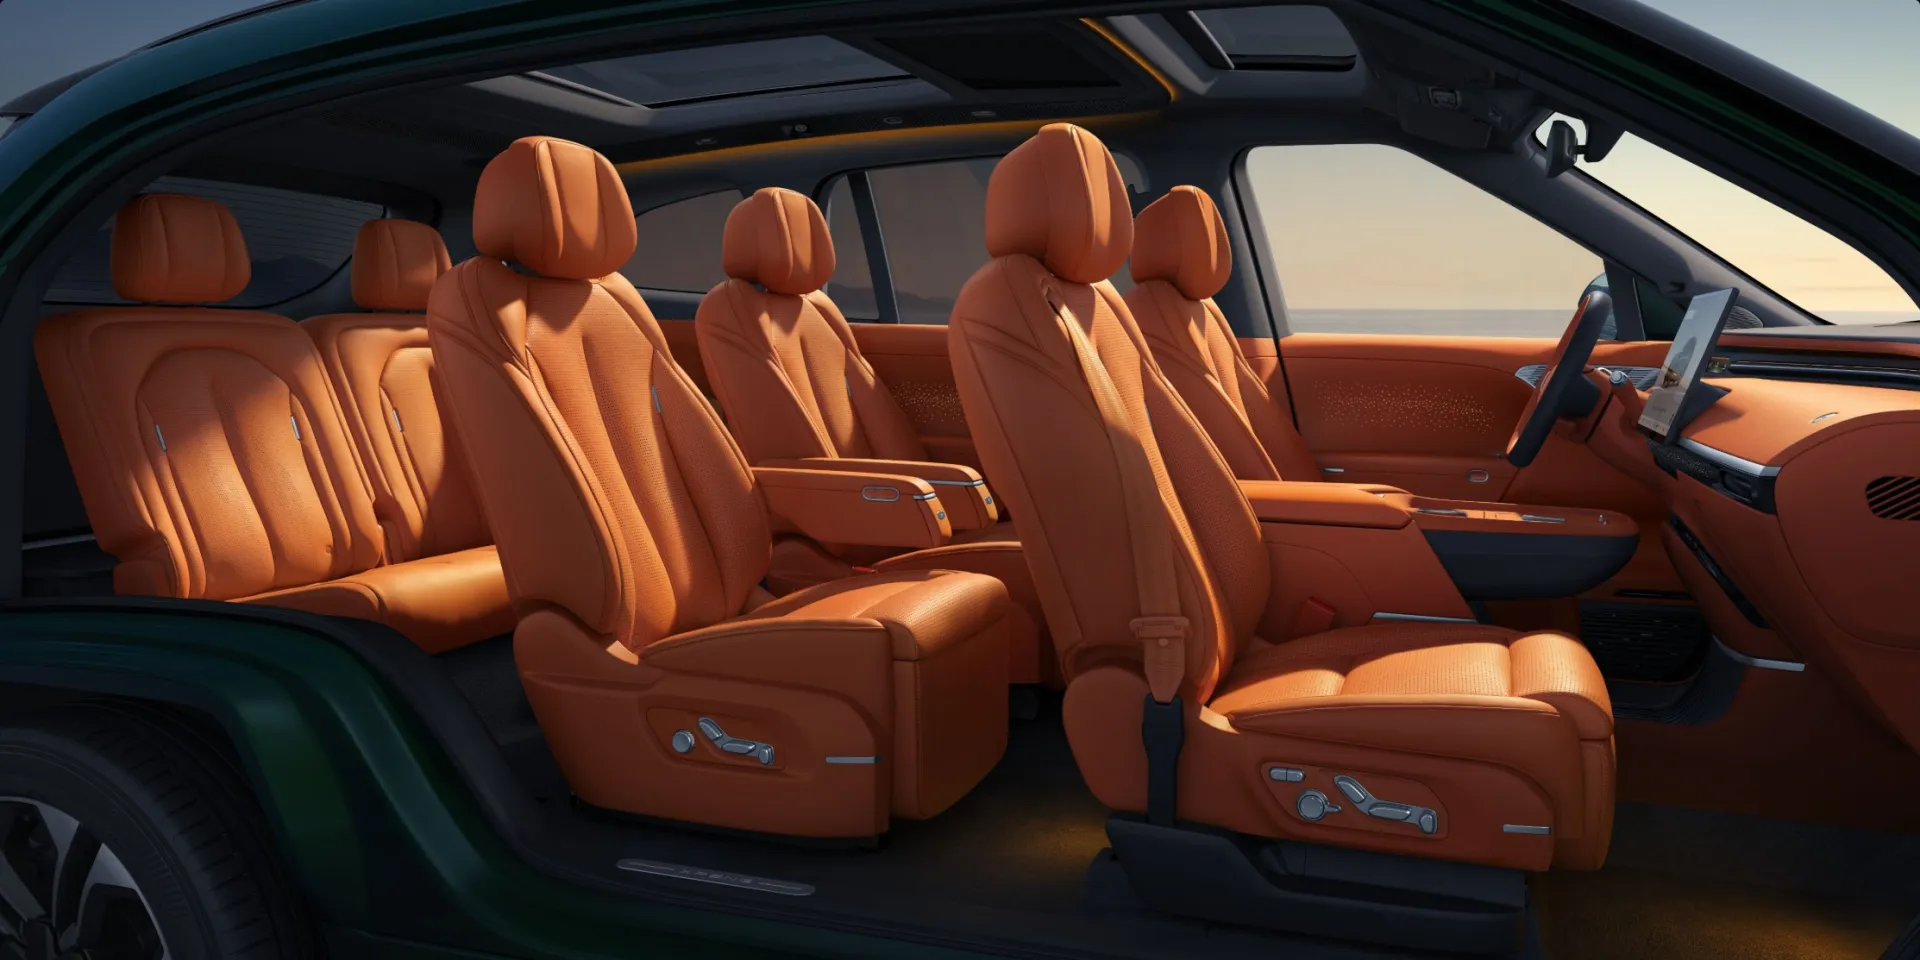
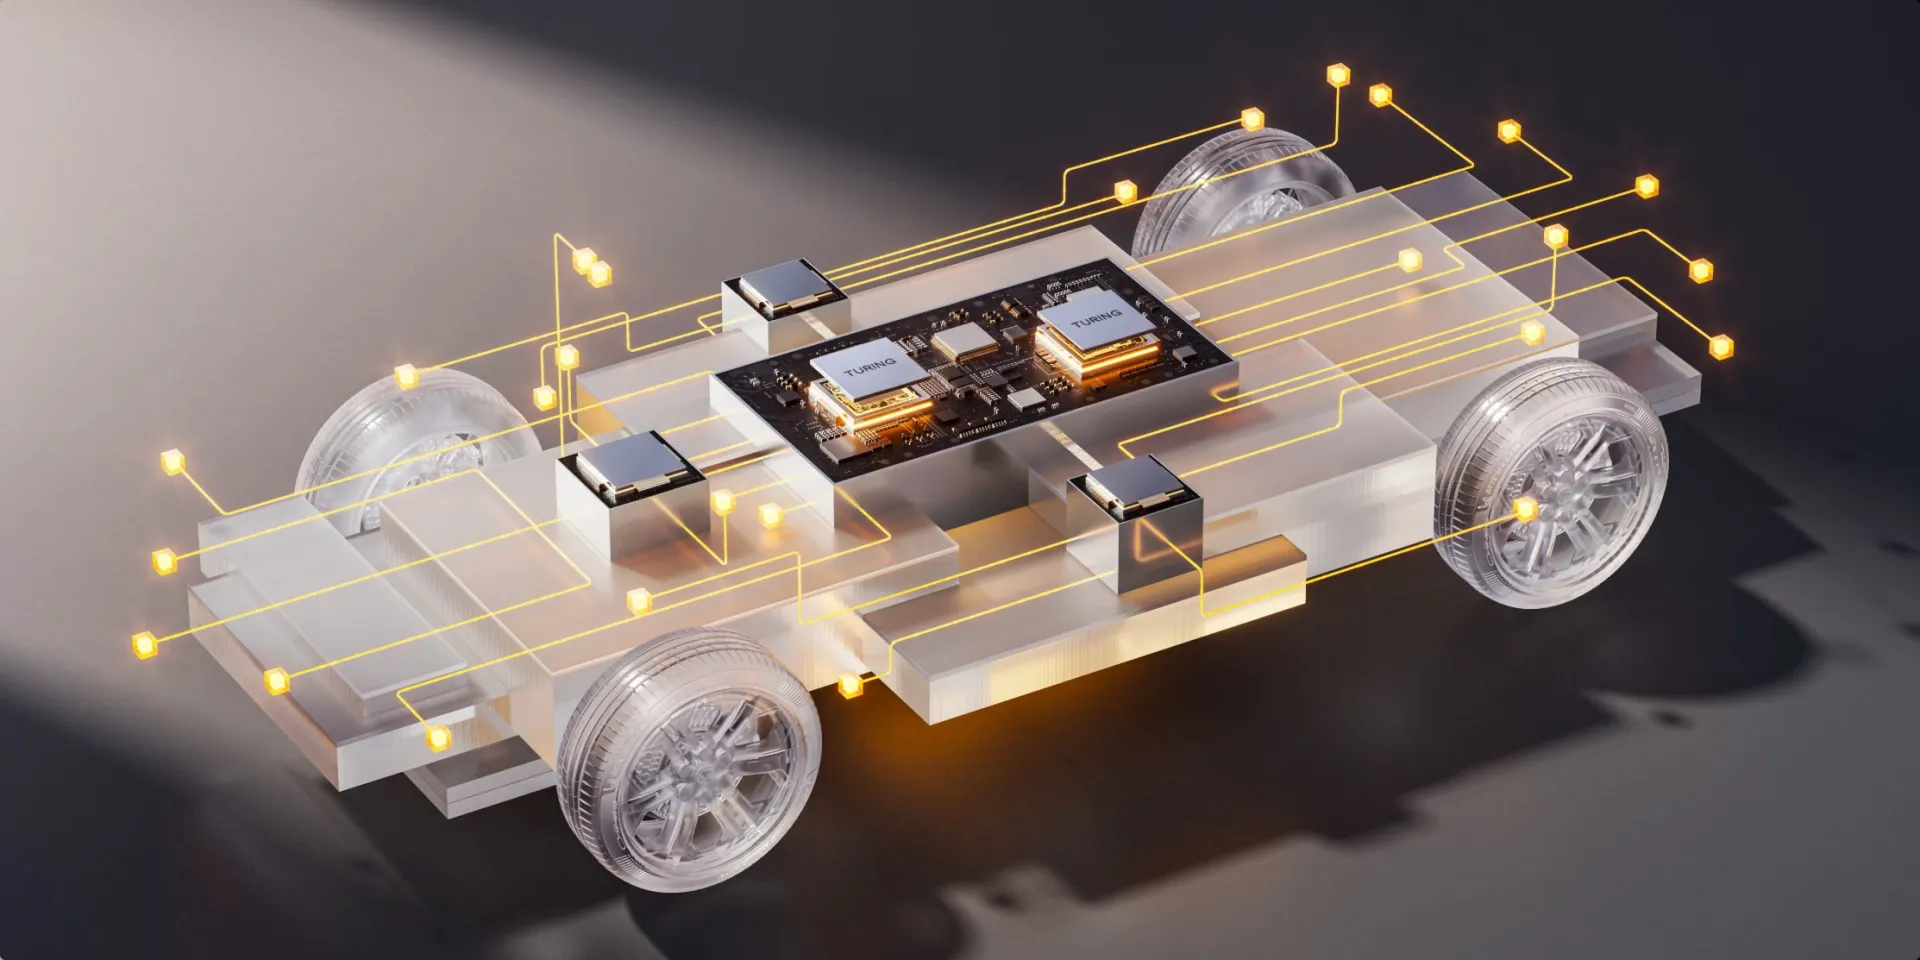
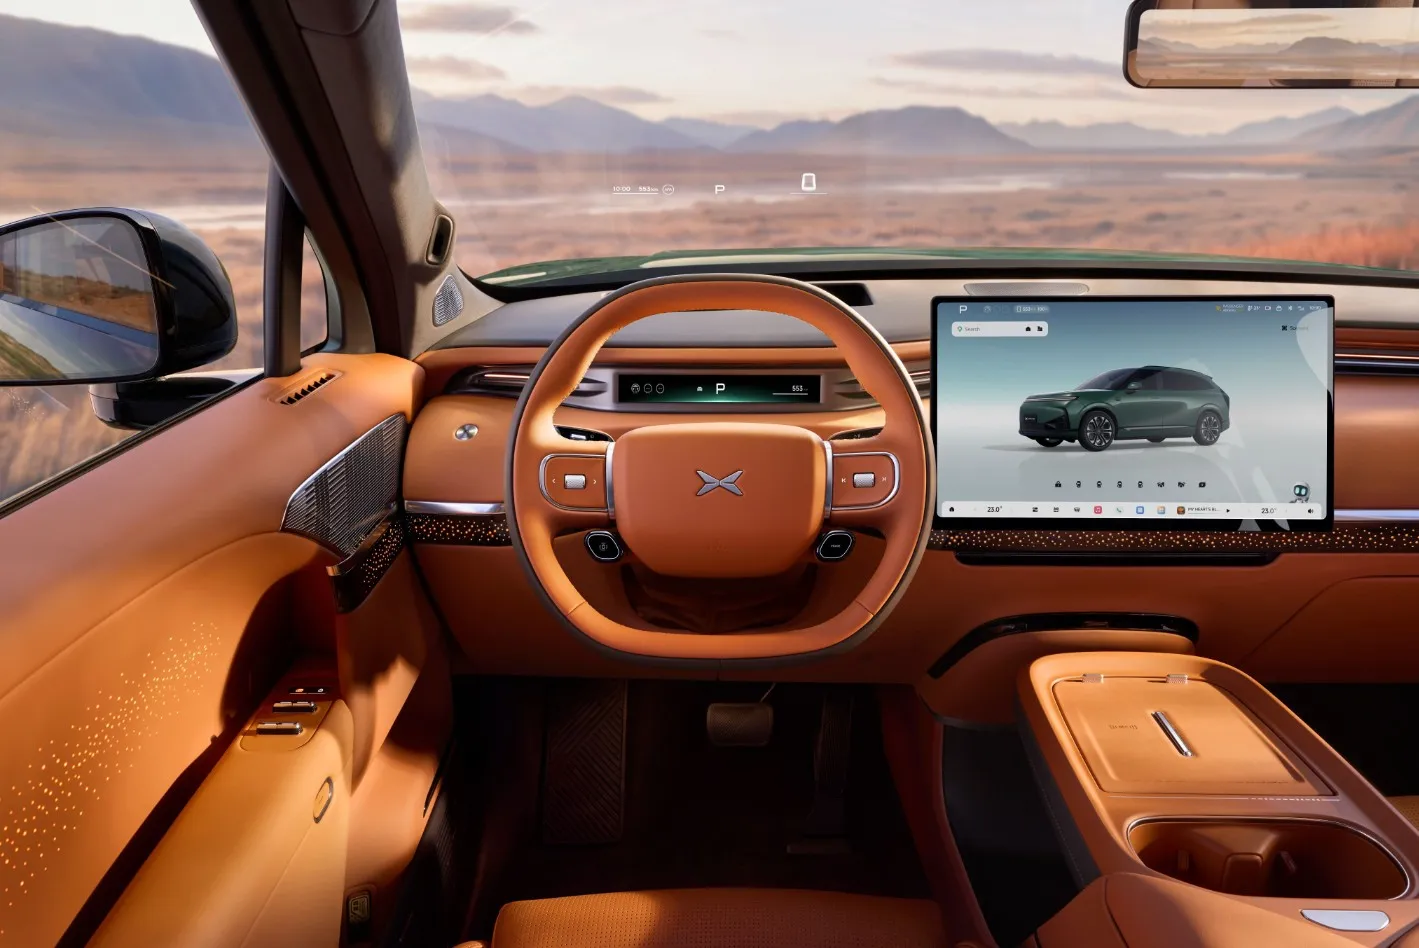
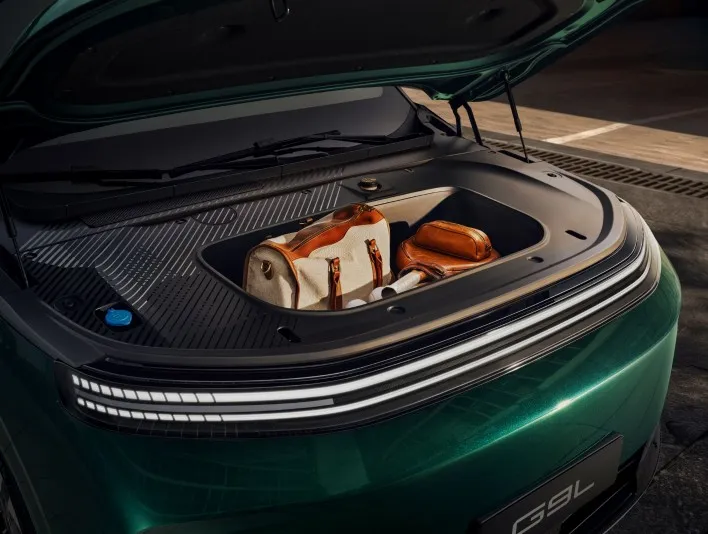
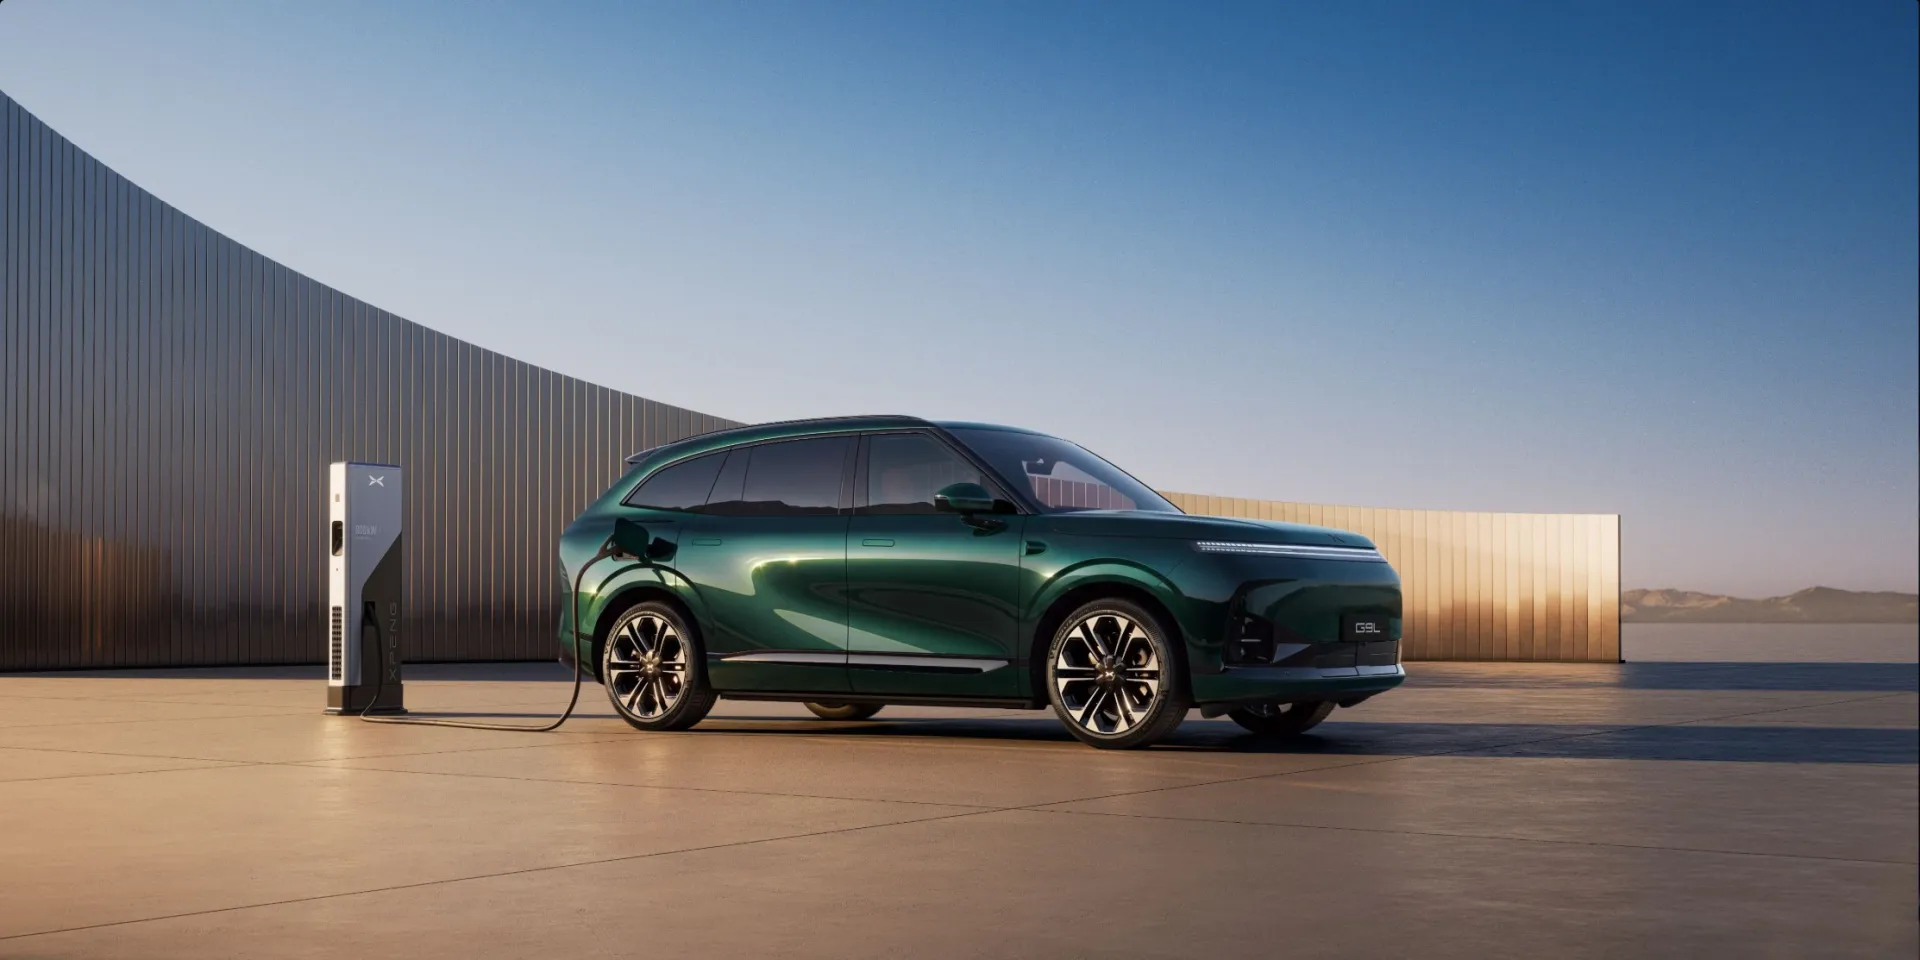
XPeng Inc. is a Chinese electric vehicle manufacturer that designs, develops, manufactures, and markets smart electric vehicles. The company develops in-house full-stack advanced driver-assistance system technology, an in-car intelligent operating system, and core vehicle systems including powertrain and electrical/electronic architecture. Its product lineup includes the XPENG G9L, the XPENG YOYO robotaxi, and the Iron next-generation robot, alongside flying car developments. XPeng serves technology-savvy middle-class consumers primarily in China, with manufacturing facilities in Zhaoqing and Guangzhou. The company maintains offices in Beijing, Shanghai, Silicon Valley, San Diego, and Amsterdam, and engages in global collaboration on automated driving standards. Summarised from the company's own disclosures, fiscal year ended Apr 2026 |
Industry Auto Manufacturers | Homepage xpeng.com |
| Sector Consumer Cyclical | IR page ir.xiaopeng.com | |
|
Tags
electric vehicles, advanced driver-assistance systems, in-car operating systems, robotaxis, humanoid robots, flying cars, over-the-air updates, powertrain technology, electrical/electronic architecture, XPENG G9L, XPENG YOYO, Iron, XPILOT ASSIST, Xmart OS, OTA
|
Press page xpeng.com/news |
Metrics
| Valuation | |
|---|---|
| Market cap | HK$ 73.07B |
| Market cap (USD) | $ 9.312B |
| P/E | -19.91 |
| PEG | — |
| P/BV | — |
| P/S | 0.82 |
| P/OCF | -30.85 |
| P/FCF | — |
| Dividend yield | — |
| Turnover / mcap | 0.59% |
| Returns | |
|---|---|
| ROE | -3.7% |
| ROI | -2.8% |
| ROIC | -5.0% |
| Profit margin | -1.5% |
| Growth | |
|---|---|
| Revenue growing | Yes |
| Profits growing | Yes |
| Revenue up 3y | Yes |
| Revenue up 5y | Yes |
| Earnings growth 3y (net profit CAGR) | — |
| Quality | |
|---|---|
| Profitable | No |
| Margin expanding | Yes |
| Buying back stock | — |
| Diluting (TTM) | Yes |
| Debt/Equity | 70.5% |
| Podcast bulls (TTM) | Sign up |
| Podcast bears (TTM) | Sign up |
| Podcast sentiment (TTM) | Sign up |
| Podcast sentiment % (TTM) | Sign up |
| News sentiment (TTM) | 7 |
| Quality score | 6.7% |
| Insiders | |
|---|---|
| Buys, 1w | Sign up |
| Buys, 1m | Sign up |
| Buys, 1y | Sign up |
| Sells, 1w | Sign up |
| Sells, 1m | Sign up |
| Sells, 1y | Sign up |
Sign up to see this company's insider trades
Filed figures
Lines the statements and their notes report beside the headline figures, read from the filings' XBRL as filed (no restatement applied), with figures computed from one filing's own lines. Cash-flow lines carry their cash direction: an outflow is negative. Each period links to its filing; a figure's period, report date and tag are in its tooltip.
| Figure | Dec 2017 | Dec 2018 | Dec 2019 | Dec 2020 | Dec 2021 | Dec 2022 | Dec 2023 | Dec 2024 | Dec 2025 |
|---|---|---|---|---|---|---|---|---|---|
| Balance sheet detail | |||||||||
| Trade receivables (CNY) | — | — | 539M | 173M | 2.67B | 3.87B | 2.72B | 2.45B | 2B |
| ↳ YoY growth | +44.9% | -29.9% | -9.8% | -18.5% | |||||
| ↳ 5y CAGR | +35.4% | ||||||||
| Borrowings, current (CNY) | — | — | 480M | 26.5M | 0.00 | 3.18B | 5.25B | 6.47B | 6.12B |
| Borrowings, non-current (CNY) | — | — | 1.69B | 252M | 1.68B | 4.61B | 5.65B | 5.66B | 6.59B |
| Lease liabilities (CNY) | — | — | 452M | 72.3M | 1.56B | 3.27B | 2.67B | 2.49B | 5.49B |
| Cash and deposits (CNY) | 115M | 1.63B | 1.95B | 4.48B | 11B | 14.6B | 21.1B | 18.6B | 17.3B |
| Intangible assets (CNY) | — | — | 118M | 93.1M | 879M | 1.04B | 4.95B | 4.61B | 4.25B |
| Right-of-use assets (CNY) | — | — | 440M | 70.7M | 1.56B | 1.95B | 1.46B | 1.26B | 3.73B |
| Net debt (borrowings + leases - cash) (CNY) | — | — | 675M | -4.13B | -7.79B | -3.54B | -7.55B | -3.96B | 868M |
| Cash flow detail | |||||||||
| Operating cash flow (CNY) | — | -1.57B | -3.56B | -21.4M | -1.09B | -8.23B | 956M | -2.01B | 8.26B |
| Purchases of property, plant and equipment (CNY) | — | -770M | -1.83B | -124M | -2.3B | -4.28B | -2.1B | -2.23B | -3.16B |
| Purchases of intangible assets (CNY) | — | -47.5M | -76.8M | -65.3M | -288M | -98M | -125M | -197M | -191M |
| Change in receivables (cash effect) (CNY) | — | -35.4M | -505M | -91.3M | -1.56B | -1.21B | 1.14B | 246M | 387M |
| Change in inventories (cash effect) (CNY) | — | -138M | -394M | -150M | -1.94B | -2.48B | -2.36B | -1.06B | -5.77B |
| Change in payables (cash effect) (CNY) | — | 177M | 739M | 637M | 7.25B | 1.86B | 7.96B | 870M | — |
| Interest paid (cash effect) (CNY) | — | -29.7M | -26.4M | -11.7M | -126M | -162M | -307M | -465M | -504M |
| Income taxes paid (cash effect) (CNY) | — | — | — | — | 0.00 | -36.1M | -25.7M | -33.6M | -17.3M |
| Share-based compensation (CNY) | — | 1.63M | 517,000 | 153M | 380M | 710M | 551M | 474M | 564M |
| Operating cash flow before change in receivables (CNY) | — | -1.54B | -3.06B | 69.9M | 466M | -7.02B | -182M | -2.26B | 7.87B |
| Free cash flow (OCF - PPE - intangibles) (CNY) | — | -2.39B | -5.47B | -210M | -3.68B | -12.6B | -1.27B | -4.44B | 4.91B |
| Income detail | |||||||||
| Research and development expense (CNY) | — | 1.05B | 2.07B | 265M | 4.11B | 5.21B | 5.28B | 6.46B | 9.49B |
| ↳ 5y CAGR | +38.1% | +25.5% | |||||||
| Total comprehensive income (CNY) | — | -1.4B | -3.69B | -530M | -5.78B | -5.95B | -10.1B | -5.53B | -1.47B |
| Comprehensive income to owners (CNY) | — | -1.4B | -3.69B | -530M | -5.78B | -5.95B | -10.1B | -5.53B | -1.47B |
| Provision for credit losses (USD) | — | — | — | 10M | 69.7M | 67.7M | 70.4M | 5.57M | 126M |
| Credit cost ratio (credit losses / average receivables) (%) | — | — | — | 2.8% | 4.9% | 2.1% | 2.1% | 0.2% | 5.7% |
| Reported | Apr 16, 2021 | Apr 16, 2021 | Apr 16, 2021 | Apr 16, 2021 | Apr 17, 2024 | Apr 17, 2024 | Apr 17, 2024 | Apr 16, 2025 | Apr 16, 2026 |
Operating KPIs — quarters
Business figures the company publishes beside its accounts (users, subscribers, same-store sales, production, occupancy ...), read from its results releases and reports, with the growth on the same period a year earlier beneath each: computed from the figures, and as the company states it where it does. Each figure links to its source; counts at a period end show under that period.
| KPI | Dec 24 | Mar 25 | Jun 25 | Sep 25 | Dec 25 | Mar 26 | Jun 26 | Sep 26 |
|---|---|---|---|---|---|---|---|---|
| Units delivered | 91,507 | 94,008 | 103,181 | 116,007 | 116,249 | 62,682 | 103,295 | 118,390 |
| ↳ YoY growth | +52.1% | +330.8% | +241.6% | +149.3% | +27.0% | -33.3% | +0.1% | +2.1% |
| Units shipped / sold | 14.7M | 19.1M | — | 18.1M | 19.1M | 11M | — | 21.6M |
| ↳ YoY growth | +20.0% | +30.0% | +105.3% | +30.0% | -42.3% | +19.8% | ||
| Reported | Mar 18, 2025 | May 28, 2026 | Aug 19, 2025 | Nov 17, 2025 | Mar 20, 2026 | May 28, 2026 | Aug 24, 2026 | Nov 16, 2026 |
Operating KPIs — years
Business figures the company publishes beside its accounts (users, subscribers, same-store sales, production, occupancy ...), read from its results releases and reports, with the growth on the same period a year earlier beneath each: computed from the figures, and as the company states it where it does. Each figure links to its source; counts at a period end show under that period.
Sign up to see institutional holdings
Sign UpPodcast Mentions
Sign up to see podcast mentions and sentiment
Sign UpAnnouncements and reports published on HKEXnews, newest first, monthly and next-day returns, proxy forms and board-meeting notices included. The link opens the announcement on HKEXnews. Material events reported to the SEC on Form 8-K or 6-K, newest first. The link opens the filing itself on EDGAR. Press releases from the company's own website, newest first.
XPENG Reports Third Quarter 2026 Unaudited Financial Results
Bull 3
Bear 0
Results
• Cash positioni was RMB45.41 billion (US$6.77 billion) as of September 30, 2026
• Quarterly total revenues were RMB24.28 billion (US$3.62 billion), a 23.0% increase quarter-over-quarter
• Quarterly gross margin was 18.9%, a decrease of 1.8 percentage points quarter-over-quarter
• Quarterly vehicle margin was 13.1%, an increase of 1.0 percentage point quarter-over-quarter
GUANGZHOU, China, November 16, 2026 — XPeng Inc. (“XPENG” or the “Company,” NYSE: XPEV and HKEX: 9868), a leading global Physical AI company, today announced its unaudited financial results for the three months ended September 30, 2026.
Operational and Financial Highlights for the Three Months Ended September 30, 2026
2026Q3 2026Q2 2026Q1 2025Q4 2025Q3 2025Q2
Total deliveries
• Total deliveries of vehicles were 118,390 for the third quarter of 2026, representing an increase of 2.1% from 116,007 in the corresponding period of 2025.
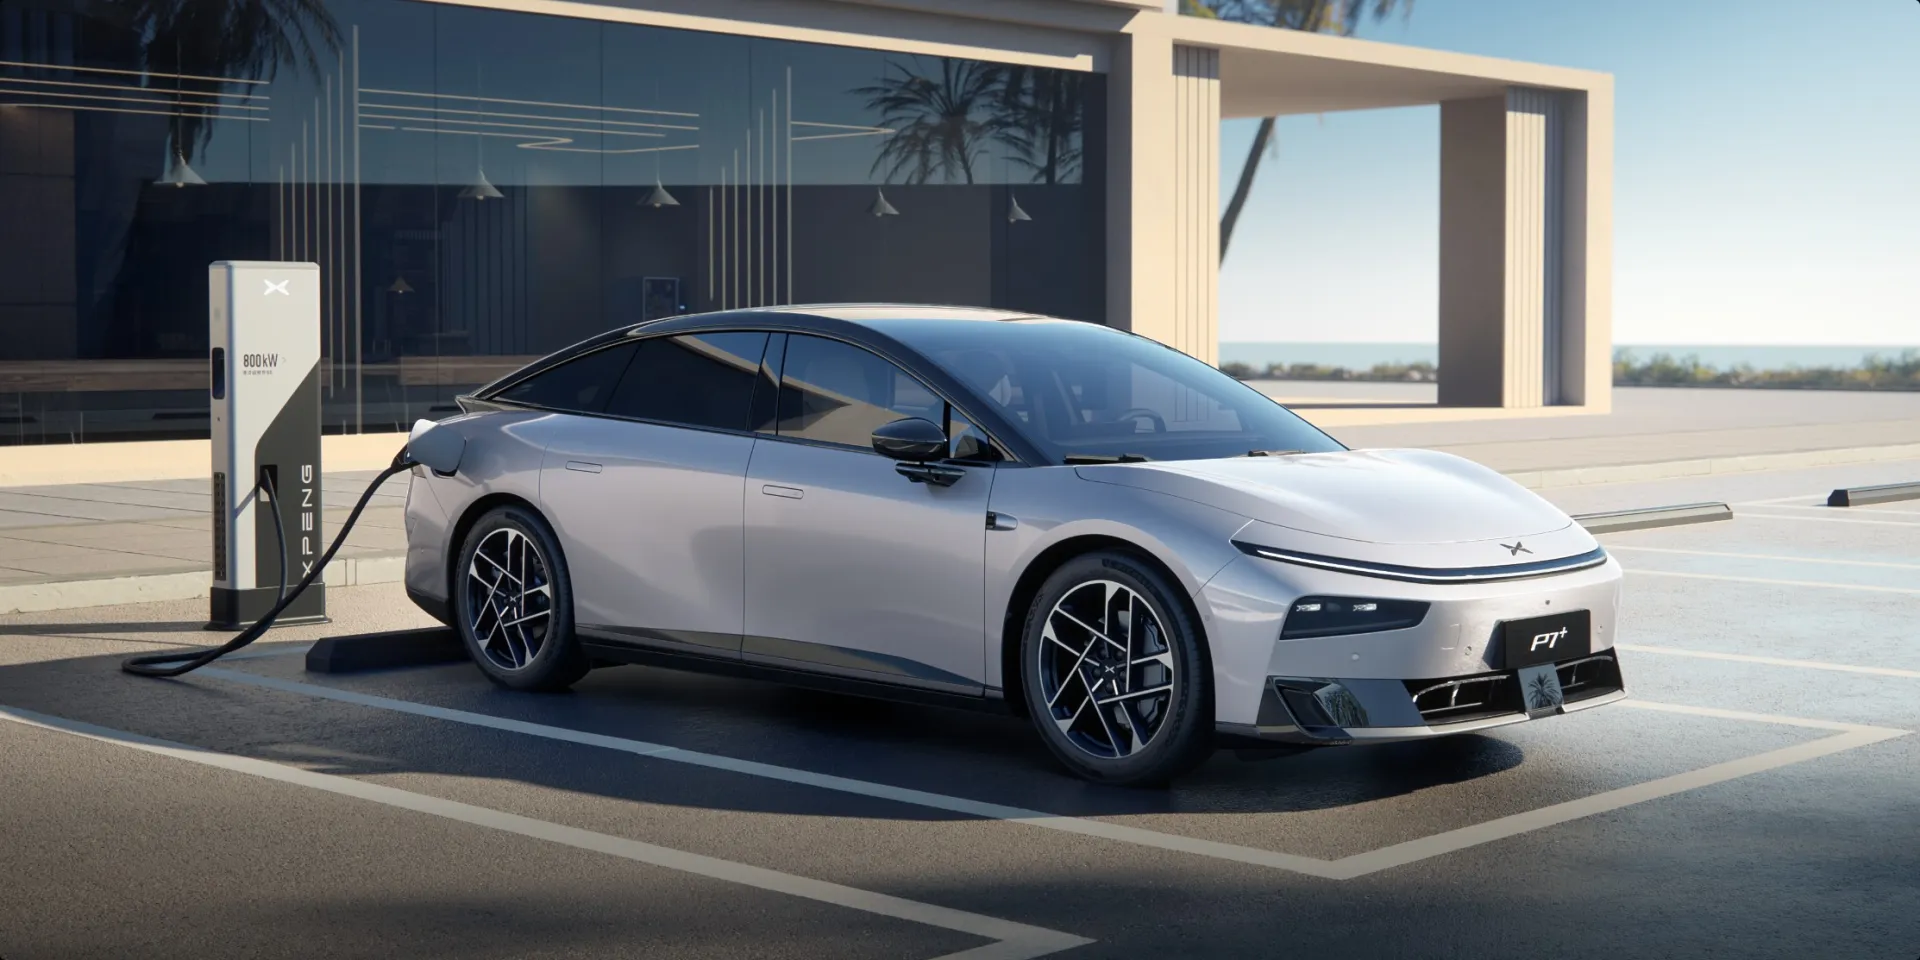
• XPENG’s physical sales network had a total of 731 stores, covering 253 cities as of September 30, 2026.
• XPENG self-operated charging station network reached 4,035 stations as of September 30, 2026.
NOTICE OF BOARD MEETING
Bull 0
Bear 0
Routine































































































































































Prompts
Click prompts to add them under the company line, click again to take one out, then copy the result into your AI chat. Shared by Asian Century Stocks and Uncovered Thai Stocks. Thank you.
Xpeng Inc. (ticker 9868), listed in Hong Kong.
Copied
ETFs Holding Xpeng Inc.
Exchange-traded funds whose newest published daily portfolio holds one of the company's listings, largest weight first.
| ETF | Weight in ETF | Shares | Market value | As of |
|---|---|---|---|---|
| HUMN | 2.02% | 159,341 | $ 1.592M | Nov 17, 2026 |
| CCSO | 1.01% | 43,978 | $ 425.267K | Nov 17, 2026 |
| NXTE | 0.54% | 23,223 | $ 307.473K | Jun 30, 2026 |
| DFSE | 0.05% | 65,300 | $ 317.483K | Nov 12, 2026 |
| APIE | 0.05% | 52,016 | $ 590.902K | Aug 31, 2026 |
| DFEM | 0.05% | 854,500 | $ 4.168M | Nov 12, 2026 |
| DFAE | 0.04% | 703,900 | $ 3.422M | Nov 12, 2026 |
| NTSE | 0.02% | 771 | $ 10.208K | Jun 30, 2026 |
| DFAX | 0.01% | 276,300 | $ 1.343M | Nov 12, 2026 |
| AVEM | 0.00% | 31,117 | $ 300.901K | Nov 16, 2026 |
| AVSE | 0.00% | 950 | $ 9,186.50 | Nov 16, 2026 |