Quarterly Total Revenues Reached RMB32,136.9 Million (US$4,736.4 Million)i Quarterly Vehicle Deliveries Were 107,658 Units SHANGHAI, Sept. 01, 2026 (GLOBE NEWSWIRE) -- NIO Inc. (NYSE: NIO; HKEX: 9866; SGX: NIO) (“NIO” or the “Company”), a pioneer and…
Quarterly Total Revenues Reached RMB32,136.9 Million (US$4,736.4 Million)i
Quarterly Vehicle Deliveries Were 107,658 Units
SHANGHAI, Sept. 01, 2026 (GLOBE NEWSWIRE) -- NIO Inc. (NYSE: NIO; HKEX: 9866; SGX: NIO) (“NIO” or the “Company”), a pioneer and a leading company in the global smart electric vehicle market, today announced its unaudited financial results for the second quarter ended June 30, 2026.
Operating Highlights for the Second Quarter of 2026
- Vehicle deliveries were 107,658 in the second quarter of 2026, representing an increase of 49.4% from the second quarter of 2025, and an increase of 29.0% from the first quarter of 2026. The deliveries consisted of 60,945 vehicles from NIO brand, 29,124 vehicles from ONVO brand, and 17,589 vehicles from FIREFLY brand.
| Key Operating Results | |
| | |
| | 2026 Q2 | 2026 Q1 | 2025 Q4 | 2025 Q3 |
| Deliveries | 107,658 | 83,465 | 124,807 | 87,071 |
| | | | | |
| | 2025 Q2 | 2025 Q1 | 2024 Q4 | 2024 Q3 |
| Deliveries | 72,056 | 42,094 | 72,689 | 61,855 |
| | | | | |
Financial Highlights for the Second Quarter of 2026
-
Vehicle sales were RMB29,058.2 million (US$4,282.7 million) in the second quarter of 2026, representing an increase of 80.1% from the second quarter of 2025 and an increase of 27.5% from the first quarter of 2026.
-
Vehicle marginii was 18.5% in the second quarter of 2026, compared with 10.3% in the second quarter of 2025 and 18.8% in the first quarter of 2026.
-
Total revenues were RMB32,136.9 million (US$4,736.4 million) in the second quarter of 2026, representing an increase of 69.1% from the second quarter of 2025 and an increase of 25.9% from the first quarter of 2026.
-
Gross profitwas RMB5,906.5 million (US$870.5 million) in the second quarter of 2026, representing an increase of 211.3% from the second quarter of 2025 and an increase of 21.6% from the first quarter of 2026.
-
Gross marginwas 18.4% in the second quarter of 2026, compared with 10.0% in the second quarter of 2025 and 19.0% in the first quarter of 2026.
-
Loss from operations was RMB347.2 million (US$51.2 million) in the second quarter of 2026, compared with loss from operations of RMB4,908.9 million in the second quarter of 2025 and loss from operations of RMB308.8 million in the first quarter of 2026. Excluding share-based compensation expenses, adjusted profit from operations (non-GAAP) was RMB206.9 million (US$30.5 million) in the second quarter of 2026, compared with adjusted loss from operations (non-GAAP) of RMB4,040.8 million in the second quarter of 2025 and adjusted profit from operations (non-GAAP) of RMB66.8 million in the first quarter of 2026.
-
Net loss was RMB528.0 million (US$77.8 million) in the second quarter of 2026, compared with net loss of RMB4,994.8 million in the second quarter of 2025 and net loss of RMB332.1 million in the first quarter of 2026. Excluding share-based compensation expenses, adjusted net profit (non-GAAP) was RMB26.1 million (US$3.8 million) in the second quarter of 2026, compared with adjusted net loss (non-GAAP) of RMB4,126.7 million in the second quarter of 2025 and adjusted net profit (non-GAAP) of RMB43.5 million in the first quarter of 2026.
-
Cash and cash equivalents, restricted cash, short-term investment and long-term time deposits were RMB56.7 billion (US$8.4 billion) as of June 30, 2026.
| Key Financial Results for the Second Quarter of 2026 |
| (in RMB million, except for percentage) |
| | | 2026Q2 | 2026 Q1 | | 2025 Q2 | | % Change****iii |
| | | | | | | QoQ | YoY |
| Vehicle Sales | | 29,058.2 | | 22,783.7 | | | 16,136.1 | | | 27.5% | | 80.1% | |
| Vehicle Margin | | 18.5% | | 18.8% | | | 10.3% | | | -30bp | | 820bp | |
| | | | | | | | | |
| Total Revenues | | 32,136.9 | | 25,532.7 | | | 19,008.7 | | | 25.9% | | 69.1% | |
| Gross Profit | | 5,906.5 | | 4,859.1 | | | 1,897.5 | | | 21.6% | | 211.3% | |
| Gross Margin | | 18.4% | | 19.0% | | | 10.0% | | | -60bp | | 840bp | |
| | | | | | | | | |
| Loss from Operations | | (347.2) | | (308.8) | | | (4,908.9) | | | 12.4% | | -92.9% | |
| Adjusted Profit/(Loss) from Operations (non-GAAP) | 206.9 | | 66.8 | | | (4,040.8) | | | 209.7% | | N/A | |
| | | | | | | | |
| Net Loss | | (528.0) | | (332.1) | | | (4,994.8) | | | 59.0% | | -89.4% | |
| Adjusted Net Profit/(Loss) (non-GAAP) | 26.1 | | 43.5 | | | (4,126.7) | | | -40.0% | | N/A | |
| | | | | | | | | | | | | |
Recent Developments
Deliveries in July and August 2026
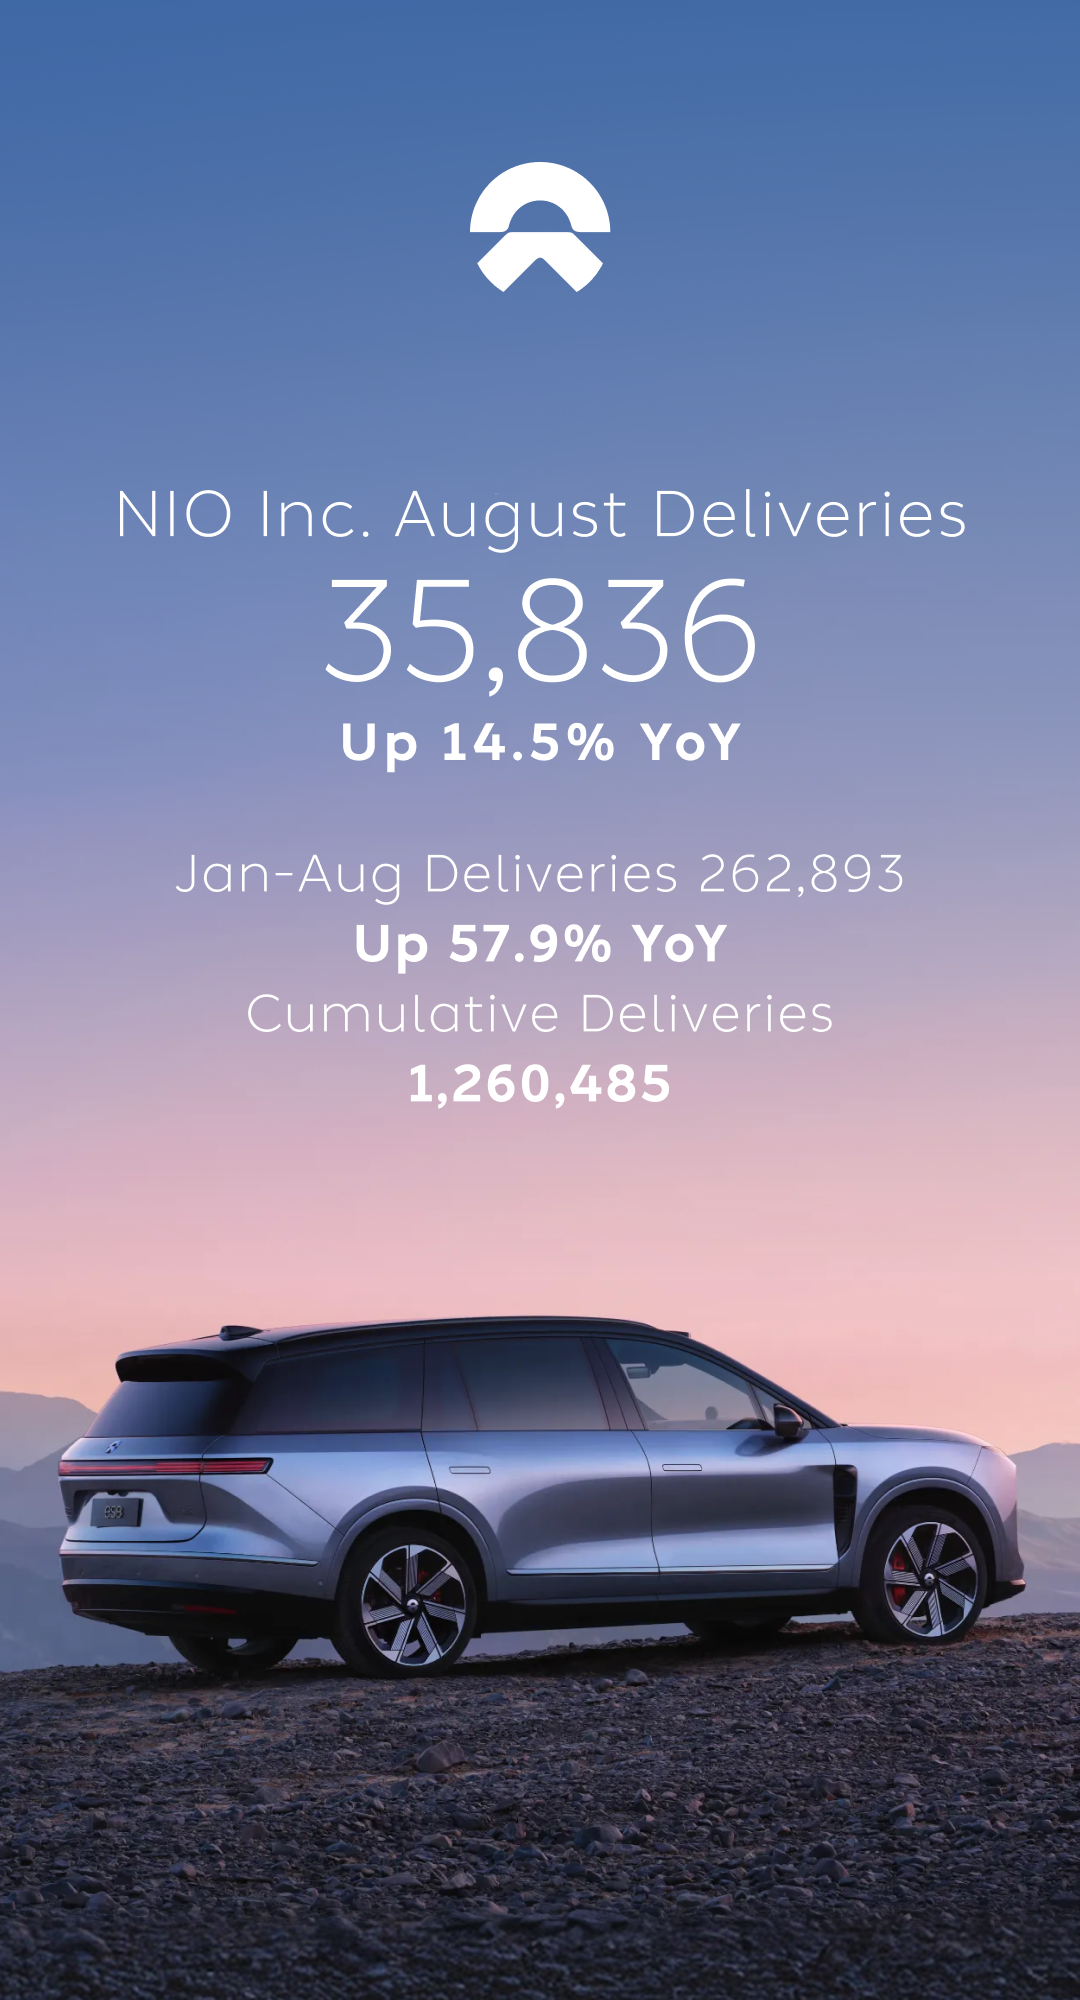
- The Company delivered 35,934 vehicles and 35,836 vehicles in July and August 2026, respectively. As of August 31, 2026, the Company had delivered 262,893 vehicles in 2026, with cumulative deliveries reaching 1,260,485.
Debut of NIO All-New ES8 Five-Seat Version
- On July 9, 2026, the Company officially launched the NIO All-New ES8 Five-Seat Version, with deliveries commencing the following day. Featuring exceptional spaciousness, elevated comfort, and advanced intelligent technologies, the ES8 Five-Seat Version sets a new benchmark for the premium battery electric SUV segment. The enhanced lineup strengthens NIO's presence across the premium large five-seat and premium three-row SUV segments, further reinforcing its leadership in the premium SUV market.
Financing of Shenji
- In June and August 2026, GeniTech Co., Ltd. (“Shenji”), a subsidiary of the Company, entered into definitive agreements across two funding rounds with certain investors in China. Pursuant to these agreements, the investors agreed to subscribe for newly issued shares of Shenji for an aggregate cash consideration of RMB493 million, implying a post-money valuation of RMB12.25 billion. Upon completion of the financing transactions, a subsidiary of NIO will hold a controlling equity interest of 59.95% in Shenji.
CEO and CFO Comments
“In the second quarter of 2026, the Company delivered 107,658 smart electric vehicles, representing a 49.4% year-over-year increase. All three brands, NIO, ONVO, and FIREFLY, achieved growth in both sales volume and average transaction price. For the third quarter, we expect total deliveries to range between 108,000 and 111,000 vehicles, with a year-over-year growth of 24.0% to 27.5%,” said William Bin Li, founder, chairman, and chief executive officer of NIO.
“In the second quarter, the NIO brand ranked first in China’s passenger vehicle market priced above RMB 350,000. The ES8 has sustained strong market momentum since its launch and reached its 140,000th delivery within 335 days, leading China’s RMB 400,000-level passenger vehicle segment and the large SUV segment. The ES9, our executive flagship SUV, continues to win over users from traditional fuel-powered luxury SUVs, ranking first in sales among passenger vehicles priced above RMB 500,000 in China in both June and July. With the compelling product advantages of the ONVO L90 and L80, the ONVO brand has become the sales leader in China’s RMB 200,000 to RMB 300,000 large SUV segment. Meanwhile, the firefly has ranked first in market share in China’s high-end small-car market for 15 consecutive months, further strengthening its leadership in the segment,” added William Bin Li.
“In the second quarter of 2026, the Company continued to improve its overall operating quality. Supported by strong sales of higher-margin models and ongoing optimization of our cost structure, we maintained healthy gross and vehicle margins despite rising cost pressures. Services and community-related businesses continued to contribute to profitability. The Company maintained positive non-GAAP operating profit during the quarter, further increasing our cash reserves and strengthening our financial position to support long-term, sustainable development,” said Stanley Yu Qu, NIO’s chief financial officer. “With our solid, comprehensive systematic capabilities and clear business strategies, we are confident in achieving our full-year operating objectives and delivering high-quality growth.”
Financial Results for the Second Quarter of 2026
Revenues
-
Total revenues in the second quarter of 2026 were RMB32,136.9 million (US$4,736.4 million), representing an increase of 69.1% from the second quarter of 2025 and an increase of 25.9% from the first quarter of 2026.
-
Vehicle sales in the second quarter of 2026 were RMB29,058.2 million (US$4,282.7 million), representing an increase of 80.1% from the second quarter of 2025 and an increase of 27.5% from the first quarter of 2026. The increase in vehicle sales over the second quarter of 2025 was mainly due to an increase in delivery volume and a higher average selling price as a result of changes in product mix. The increase in vehicle sales over the first quarter of 2026 was mainly attributable to an increase in delivery volume.
-
Other salesin the second quarter of 2026 were RMB3,078.6 million (US$453.7 million), representing an increase of 7.2% from the second quarter of 2025 and an increase of 12.0% from the first quarter of 2026. The increase in other sales over the second quarter of 2025 was mainly due to an increase in sales of parts, accessories and after-sales vehicle services as a result of the continued growth in the number of users, and partially offset by a decrease in revenues from sales of used cars and technical research and development services. The increase in other sales over the first quarter of 2026 was mainly due to (i) an increase in revenues from sales of used cars and (ii) an increase in sales of parts, accessories and after-sales vehicle services, partially offset by a decrease in revenues from provision of auto financing services.
Cost of Sales and Gross Margin
-
Cost of sales in the second quarter of 2026 was RMB26,230.4 million (US$3,865.9 million), representing an increase of 53.3% from the second quarter of 2025 and an increase of 26.9% from the first quarter of 2026. The increase in cost of sales over the second quarter of 2025 and the first quarter of 2026 was mainly attributable to an increase in delivery volume.
-
Gross profitin the second quarter of 2026 was RMB5,906.5 million (US$870.5 million), representing an increase of 211.3% from the second quarter of 2025 and an increase of 21.6% from the first quarter of 2026.
-
Gross margin in the second quarter of 2026 was 18.4%, compared with 10.0% in the second quarter of 2025 and 19.0% in the first quarter of 2026. The increase in gross margin over the second quarter of 2025 was mainly attributable to the increased vehicle margin. The slight decrease in gross margin over the first quarter of 2026 was mainly attributable to gross margin from vehicle sales, provision of power solutions, and sales of parts, accessories and after-sales vehicle services.
-
Vehicle margin in the second quarter of 2026 was 18.5%, compared with 10.3% in the second quarter of 2025 and 18.8% in the first quarter of 2026. The increase in vehicle margin from the second quarter of 2025 was mainly attributable to a more favorable product mix. The vehicle margin remained relatively stable from the first quarter of 2026.
Operating Expenses
-
Research and development expenses in the second quarter of 2026 were RMB2,144.9 million (US$316.1 million), representing a decrease of 28.7% from the second quarter of 2025 and an increase of 13.8% from the first quarter of 2026. Excluding share-based compensation expenses, adjusted research and development expenses (non-GAAP) were RMB1,983.2 million (US$292.3 million) in the second quarter of 2026, representing a decrease of 20.3% from the second quarter of 2025 and an increase of 16.1% from the first quarter of 2026. The decrease in research and development expenses over the second quarter of 2025 was mainly due to (i) decreased personnel costs in research and development functions primarily as a result of organizational optimization, and (ii) decreased design and development costs mainly resulting from different stages of development and improved operational efficiency. The increase in research and development expenses over the first quarter of 2026 was mainly due to the incremental design and development costs for new products and technologies as well as the increased personnel costs in research and development functions.
-
Selling, general and administrative expenses in the second quarter of 2026 were RMB4,424.5 million (US$652.1 million), representing an increase of 11.6% from the second quarter of 2025 and an increase of 26.5% from the first quarter of 2026. Excluding share-based compensation expenses, adjusted selling, general and administrative expenses (non-GAAP) were RMB4,039.6 million (US$595.4 million) in the second quarter of 2026, representing an increase of 9.7% from the second quarter of 2025 and an increase of 22.1% from the first quarter of 2026. The increase in selling, general and administrative expenses over the second quarter of 2025 was mainly attributable to an increase in sales and marketing activities associated with new product launches. The increase in selling, general and administrative expenses over the first quarter of 2026 was mainly attributable to (i) an increase in sales and marketing activities associated with new product launches, as well as an increase in personnel and related costs for marketing functions, and (ii) an increase in share-based compensation for general corporate functions.
Loss from Operations
- Loss from operations in the second quarter of 2026 was RMB347.2 million (US$51.2 million), compared with loss from operations of RMB4,908.9 million in the second quarter of 2025 and loss from operations of RMB308.8 million in the first quarter of 2026. Excluding share-based compensation expenses, adjusted profit from operations (non-GAAP) was RMB206.9 million (US$30.5 million) in the second quarter of 2026, compared with adjusted loss from operations (non-GAAP) of RMB4,040.8 million in the second quarter of 2025 and adjusted profit from operations (non-GAAP) of RMB66.8 million in the first quarter of 2026.
Net Loss and Earnings Per Ordinary Share/ADS
-
Net loss in the second quarter of 2026 was RMB528.0 million (US$77.8 million), compared with net loss of RMB4,994.8 million in the second quarter of 2025 and net loss of RMB332.1 million in the first quarter of 2026. Excluding share-based compensation expenses, adjusted net profit (non-GAAP) was RMB26.1 million (US$3.8 million) in the second quarter of 2026, compared with adjusted net loss (non-GAAP) of RMB4,126.7 million in the second quarter of 2025 and adjusted net profit (non-GAAP) of RMB43.5 million in the first quarter of 2026.
-
Net loss attributable to NIO’s ordinary shareholders in the second quarter of 2026 was RMB721.6 million (US$106.4 million), compared with net loss attributable to NIO’s ordinary shareholders of RMB5,141.3 million in the second quarter of 2025 and net loss attributable to NIO’s ordinary shareholders of RMB496.0 million in the first quarter of 2026. Excluding share-based compensation expenses and accretion on redeemable non-controlling interests to redemption value, adjusted net profit attributable to NIO’s ordinary shareholders (non-GAAP) was RMB24.8 million (US$3.7 million) in the second quarter of 2026, compared with adjusted net loss attributable to NIO’s ordinary shareholders (non-GAAP) of RMB4,124.9 million in the second quarter of 2025 and adjusted net profit attributable to NIO’s ordinary shareholders (non-GAAP) of RMB44.5 million in the first quarter of 2026.
-
Basic and diluted net loss per ordinary share/ADSin the second quarter of 2026 were both RMB0.29 (US$0.04), compared with basic and diluted net loss per ordinary share/ADS of RMB2.31 in the second quarter of 2025 and basic and diluted net loss per ordinary share/ADS of RMB0.20 in the first quarter of 2026. Excluding share-based compensation expenses and accretion on redeemable non-controlling interests to redemption value, adjusted basic and diluted net profit per ordinary share/ADS (non-GAAP) were both RMB0.01(US$0.00) in the second quarter of 2026, compared with adjusted basic and diluted net loss per ordinary share/ADS (non-GAAP) of RMB1.85 in the second quarter of 2025 and adjusted basic and diluted net profit per ordinary share/ADS (non-GAAP) of RMB0.02 in the first quarter of 2026.
Balance Sheet
- Balance of cash and cash equivalents, restricted cash, short-term investment and long-term time depositswas RMB56.7 billion (US$8.4 billion) as of June 30, 2026. We recorded net current assets as of June 30, 2026 and generated positive operating cash flows and adjusted net profit (non-GAAP) in the second quarter of 2026, despite recording a net loss under GAAP in this quarter. Based on our going concern and liquidity assessment, which considers our business plan including revenue growth from the sales of existing and new vehicle models, continuous optimization of operation efficiency to improve operating cash flows, working capital management, the ability to raise funds from banks under available credit quotas and other sources when needed, and evaluates uncertainties as to the successful execution of our business plan, we believe that our financial resources, including our available cash and cash equivalents, restricted cash and short-term investments, cash generated from operating activities and funds from available credit quotas and other sources will be sufficient to support our continuous operations in the ordinary course of business for the next twelve months.
Business Outlook
For the third quarter of 2026, the Company expects:
-
Deliveries of vehicles to be between 108,000 and 111,000 vehicles, representing an increase of approximately 24.0% to 27.5% from the same quarter of 2025.
-
Total revenues to be between RMB33,285 million (US$4,906 million) and RMB34,051 million (US$5,019 million), representing an increase of approximately 52.7% to 56.2% from the same quarter of 2025.
This business outlook reflects the Company’s current and preliminary view on the business situation and market condition, which is subject to change.
Conference Call
The Company’s management will host an earnings conference call at 8:00 AM U.S. Eastern Time on September 1, 2026 (8:00 PM Beijing/Hong Kong/Singapore Time on September 1, 2026).
A live and archived webcast of the conference call will be available on the Company’s investor relations website at https://ir.nio.com/news-events/events.
For participants who wish to join the conference using dial-in numbers, please register in advance using the link provided below and dial in 10 minutes prior to the call. Dial-in numbers, passcode and unique access PIN would be provided upon registering.
https://s1.c-conf.com/diamondpass/10056744-ju876y.html
A replay of the conference call will be accessible by phone at the following numbers, until September 8, 2026:
| United States: | +1-855-883-1031 |
| Hong Kong, China: | +852-800-930-639 |
| Mainland, China: | +86-400-1209-216 |
| Singapore: | +65-800-1013-223 |
| International: | +61-7-3107-6325 |
| Replay PIN: | 10056744 |
| | |
About NIO Inc.
NIO Inc. is a pioneer and a leading company in the global smart electric vehicle market. Founded in November 2014, NIO aspires to shape a sustainable and brighter future with the mission of “Blue Sky Coming”. NIO envisions itself as a user enterprise where innovative technology meets experience excellence. NIO designs, develops, manufactures and sells smart electric vehicles, driving innovations in next-generation core technologies. NIO distinguishes itself through continuous technological breakthroughs and innovations, exceptional products and services, and a community for shared growth. NIO provides premium smart electric vehicles under the NIO brand, premium smart electric vehicles for families through the ONVO brand, and high-end smart electric compact cars with the FIREFLY brand.
Safe Harbor Statement
This press release contains statements that may constitute “forward-looking” statements pursuant to the “safe harbor” provisions of the U.S. Private Securities Litigation Reform Act of 1995. These forward-looking statements can be identified by terminology such as “will,” “expects,” “anticipates,” “aims,” “future,” “intends,” “plans,” “believes,” “estimates,” “likely to” and similar statements. NIO may also make written or oral forward-looking statements in its periodic reports to the U.S. Securities and Exchange Commission (the “SEC”), in its annual report to shareholders, in announcements, circulars or other publications made on the websites of each of The Stock Exchange of Hong Kong Limited (the “SEHK”) and the Singapore Exchange Securities Trading Limited (the “SGX-ST”), in press releases and other written materials and in oral statements made by its officers, directors or employees to third parties. Statements that are not historical facts, including statements about NIO’s beliefs, plans and expectations, are forward-looking statements. Forward-looking statements involve inherent risks and uncertainties. A number of factors could cause actual results to differ materially from those contained in any forward-looking statement, including but not limited to the following: NIO’s strategies; NIO’s future business development, financial condition and results of operations; NIO’s ability to develop and manufacture vehicles of sufficient quality and appeal to customers on schedule and on a large scale; its ability to ensure and expand manufacturing capacities including establishing and maintaining partnerships with third parties; its ability to provide convenient and comprehensive power solutions to its customers; the viability, growth potential and prospects of the battery swapping, BaaS, and NIO Assisted and Intelligent Driving and its subscription services; its ability to improve the technologies or develop alternative technologies in meeting evolving market demand and industry development; NIO’s ability to satisfy the mandated safety standards relating to motor vehicles; its ability to secure supply of raw materials or other components used in its vehicles; its ability to secure sufficient reservations and sales of its vehicles; its ability to control costs associated with its operations; its ability to build its current and future brands; general economic and business conditions globally and in China and assumptions underlying or related to any of the foregoing. Further information regarding these and other risks is included in NIO’s filings with the SEC and the announcements and filings on the websites of each of the SEHK and SGX-ST. All information provided in this press release is as of the date of this press release, and NIO does not undertake any obligation to update any forward-looking statement, except as required under applicable law.
Non-GAAP Disclosure
The Company uses non-GAAP measures, such as adjusted cost of sales (non-GAAP), adjusted research and development expenses (non-GAAP), adjusted selling, general and administrative expenses (non-GAAP), adjusted profit/(loss) from operations (non-GAAP), adjusted net profit/(loss) (non-GAAP), adjusted net profit/(loss) attributable to ordinary shareholders (non-GAAP) and adjusted basic and diluted net profit/(loss) per ordinary share/ADS (non-GAAP), in evaluating its operating results and for financial and operational decision-making purposes. The Company defines adjusted cost of sales (non-GAAP), adjusted research and development expenses (non-GAAP), adjusted selling, general and administrative expenses (non-GAAP) and adjusted profit/(loss) from operations (non-GAAP) and adjusted net profit/(loss) (non-GAAP) as cost of sales, research and development expenses, selling, general and administrative expenses, profit/(loss) from operations and net profit/(loss) excluding share-based compensation expenses and organizational optimization charges. The Company defines adjusted net profit/(loss) attributable to ordinary shareholders (non-GAAP) and adjusted basic and diluted profit/(loss) per ordinary share/ADS (non-GAAP) as profit/(loss) attributable to ordinary shareholders and basic and diluted profit/(loss) per ordinary share/ADS excluding share-based compensation expenses, organizational optimization charges and accretion on redeemable non-controlling interests to redemption value. By excluding the impact of share-based compensation expenses, organizational optimization charges and accretion on redeemable non-controlling interests to redemption value, which are either non-cash or not indicative of the Company’s ordinary or ongoing operations due to their size or nature, the Company believes that the non-GAAP financial measures help identify underlying trends in its business and enhance the overall understanding of the Company’s past performance and future prospects. The Company also believes that the non-GAAP financial measures allow for greater visibility with respect to key metrics used by the Company’s management in its financial and operational decision-making.
The non-GAAP financial measures are not presented in accordance with U.S. GAAP and may be different from non-GAAP methods of accounting and reporting used by other companies. The non-GAAP financial measures have limitations as analytical tools and when assessing the Company’s operating performance, investors should not consider them in isolation, or as a substitute for net profit/(loss) or other consolidated statements of comprehensive profit/(loss) data prepared in accordance with U.S. GAAP. The Company encourages investors and others to review its financial information in its entirety and not rely on a single financial measure.
The Company mitigates these limitations by reconciling the non-GAAP financial measures to the most comparable U.S. GAAP performance measures, all of which should be considered when evaluating the Company’s performance.


 GLOBAL/English