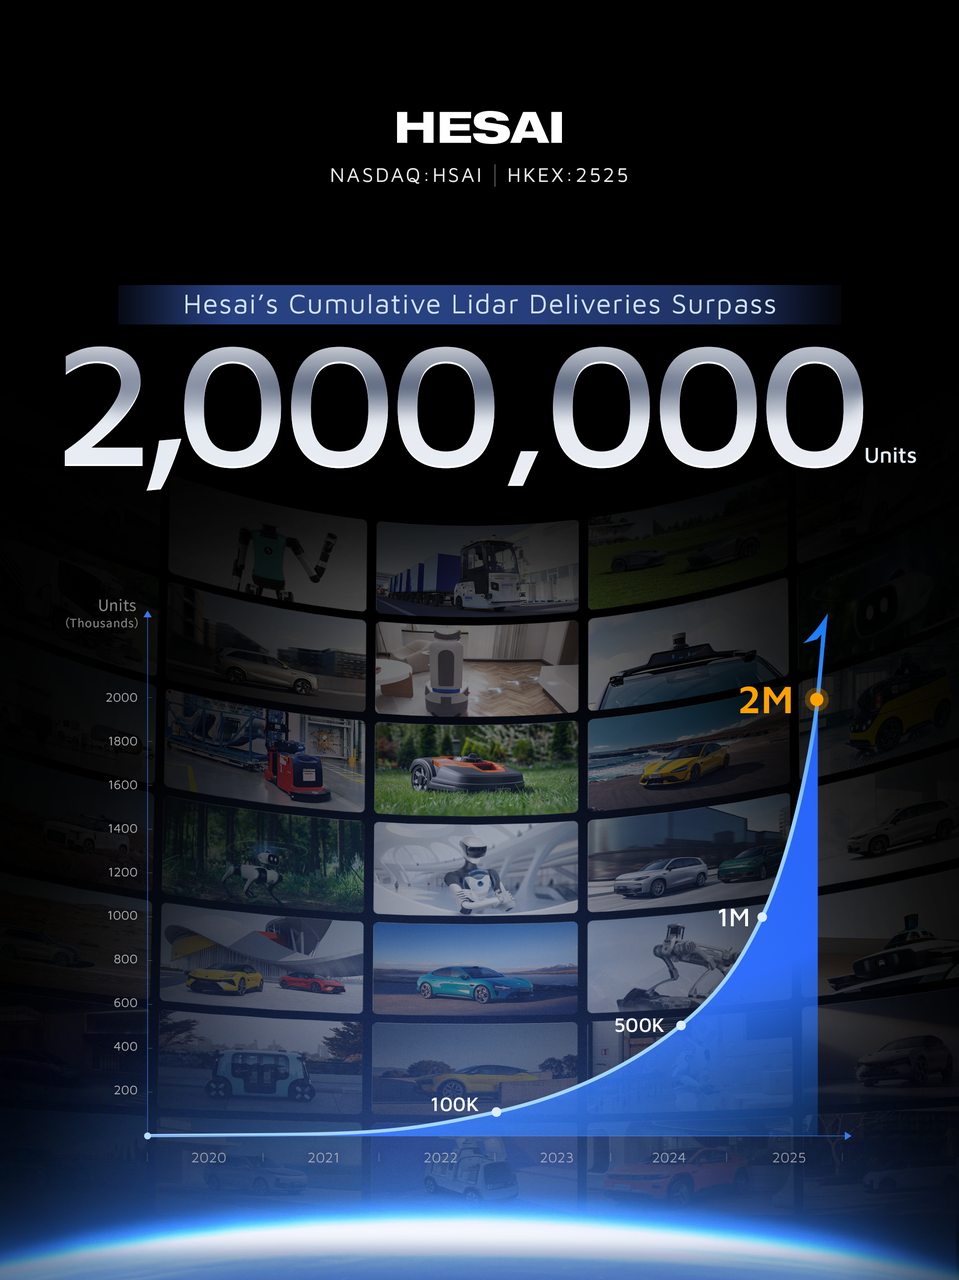
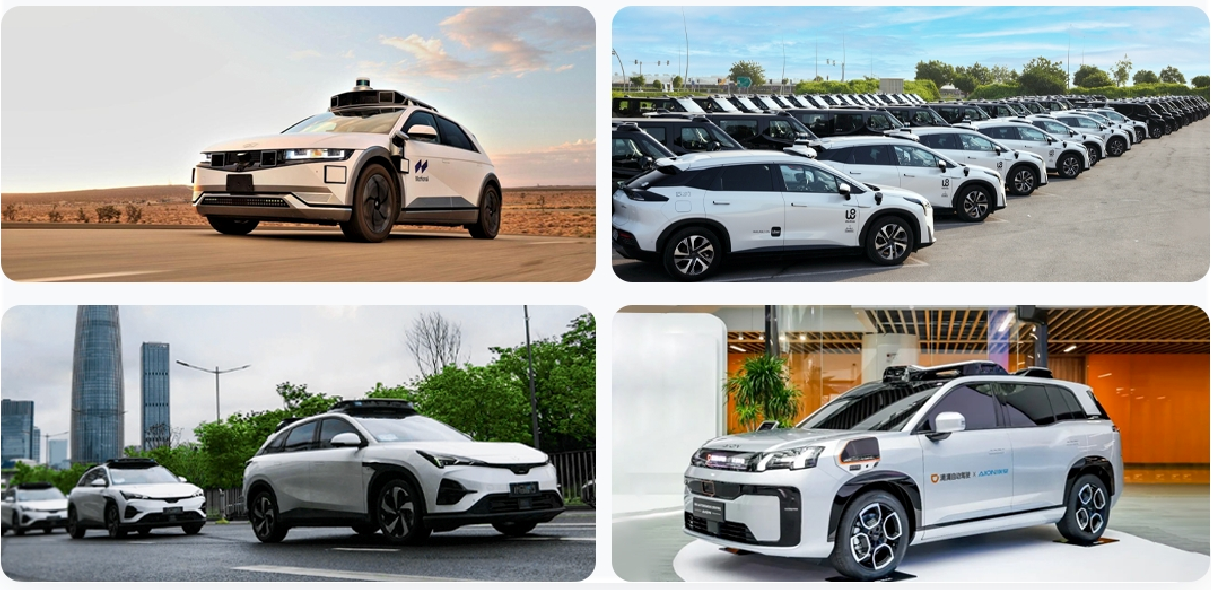
April 20, 2026 Hesai announces a strategic shift to spatial intelligence, introducing Kosmo, a new spatial intelligence AI hardware platform, alongside robotic actuation modules and innovations for the Physical AI era. Hesai Technology (Nasdaq: HSAI;…
April 20, 2026
Hesai announces a strategic shift to spatial intelligence, introducing Kosmo, a new spatial intelligence AI hardware platform, alongside robotic actuation modules and innovations for the Physical AI era.
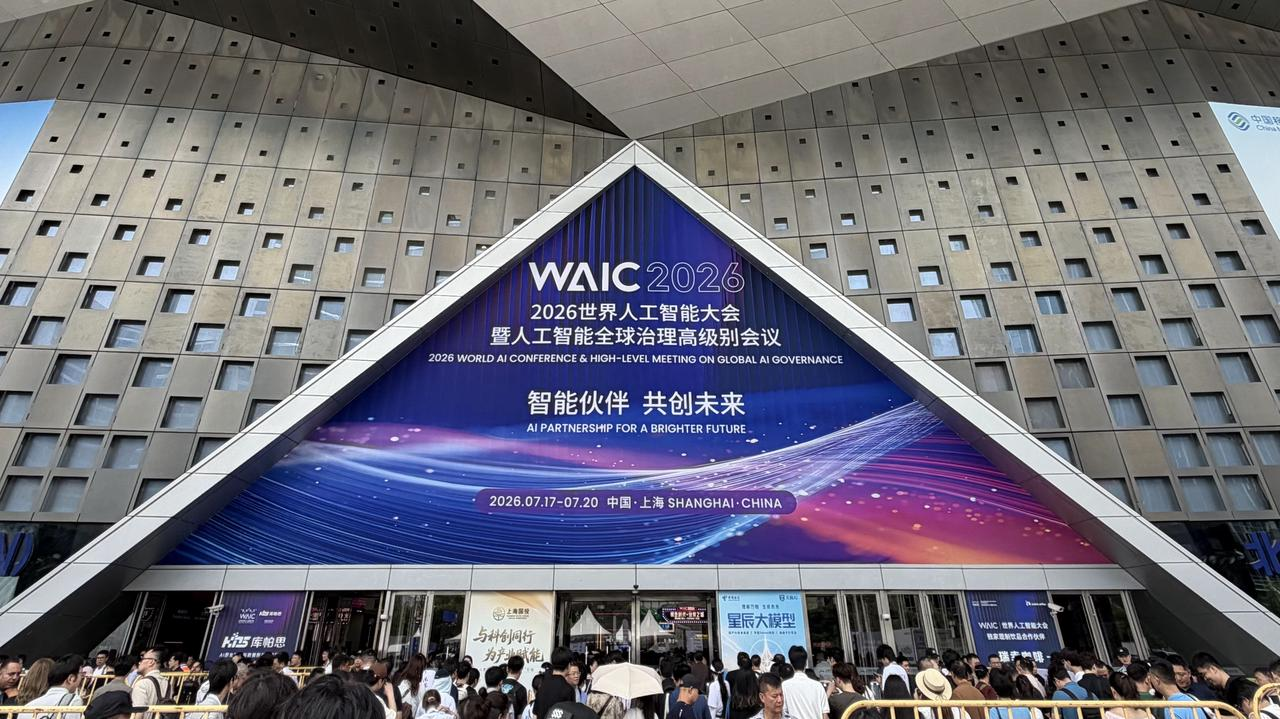
Hesai Technology (Nasdaq: HSAI; HKEX: 2525), a global leader in intelligent technology and 3D perception, hosted its 2026 Technology Open Day on April 17, showcasing its latest generation of lidar technologies spanning full-color perception, ultra-high-resolution imaging, and spatial intelligence applications.
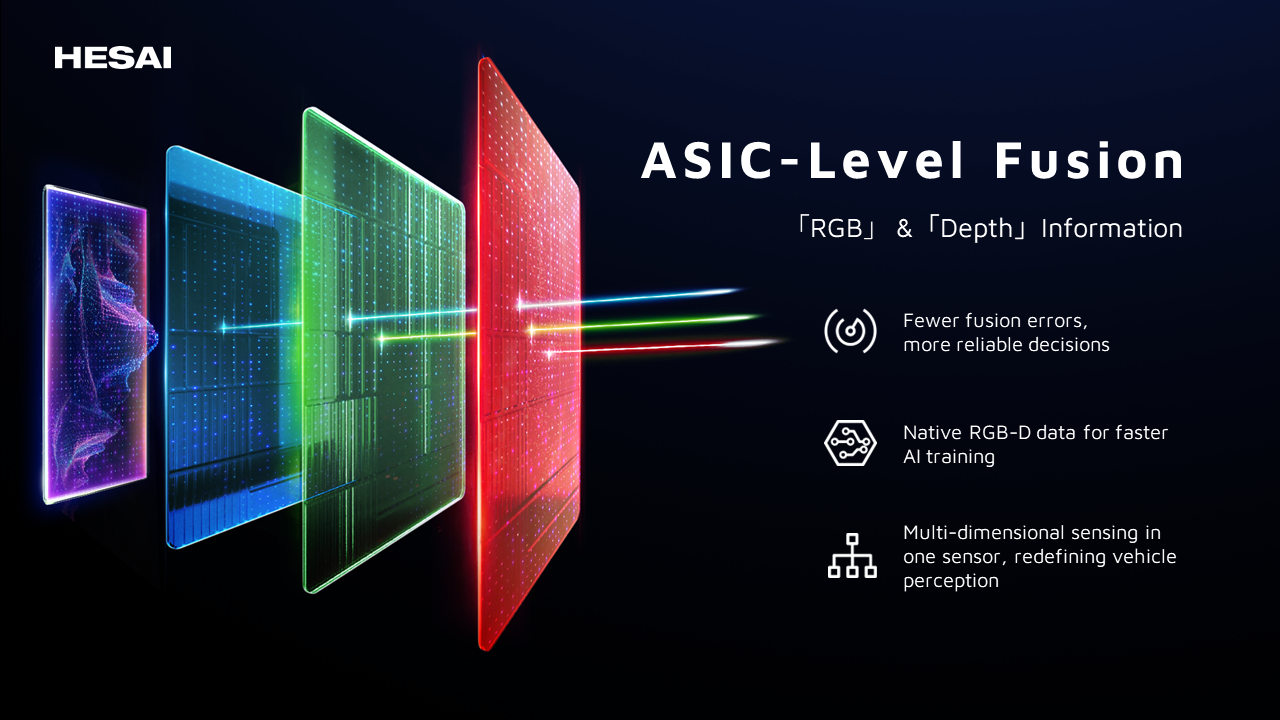
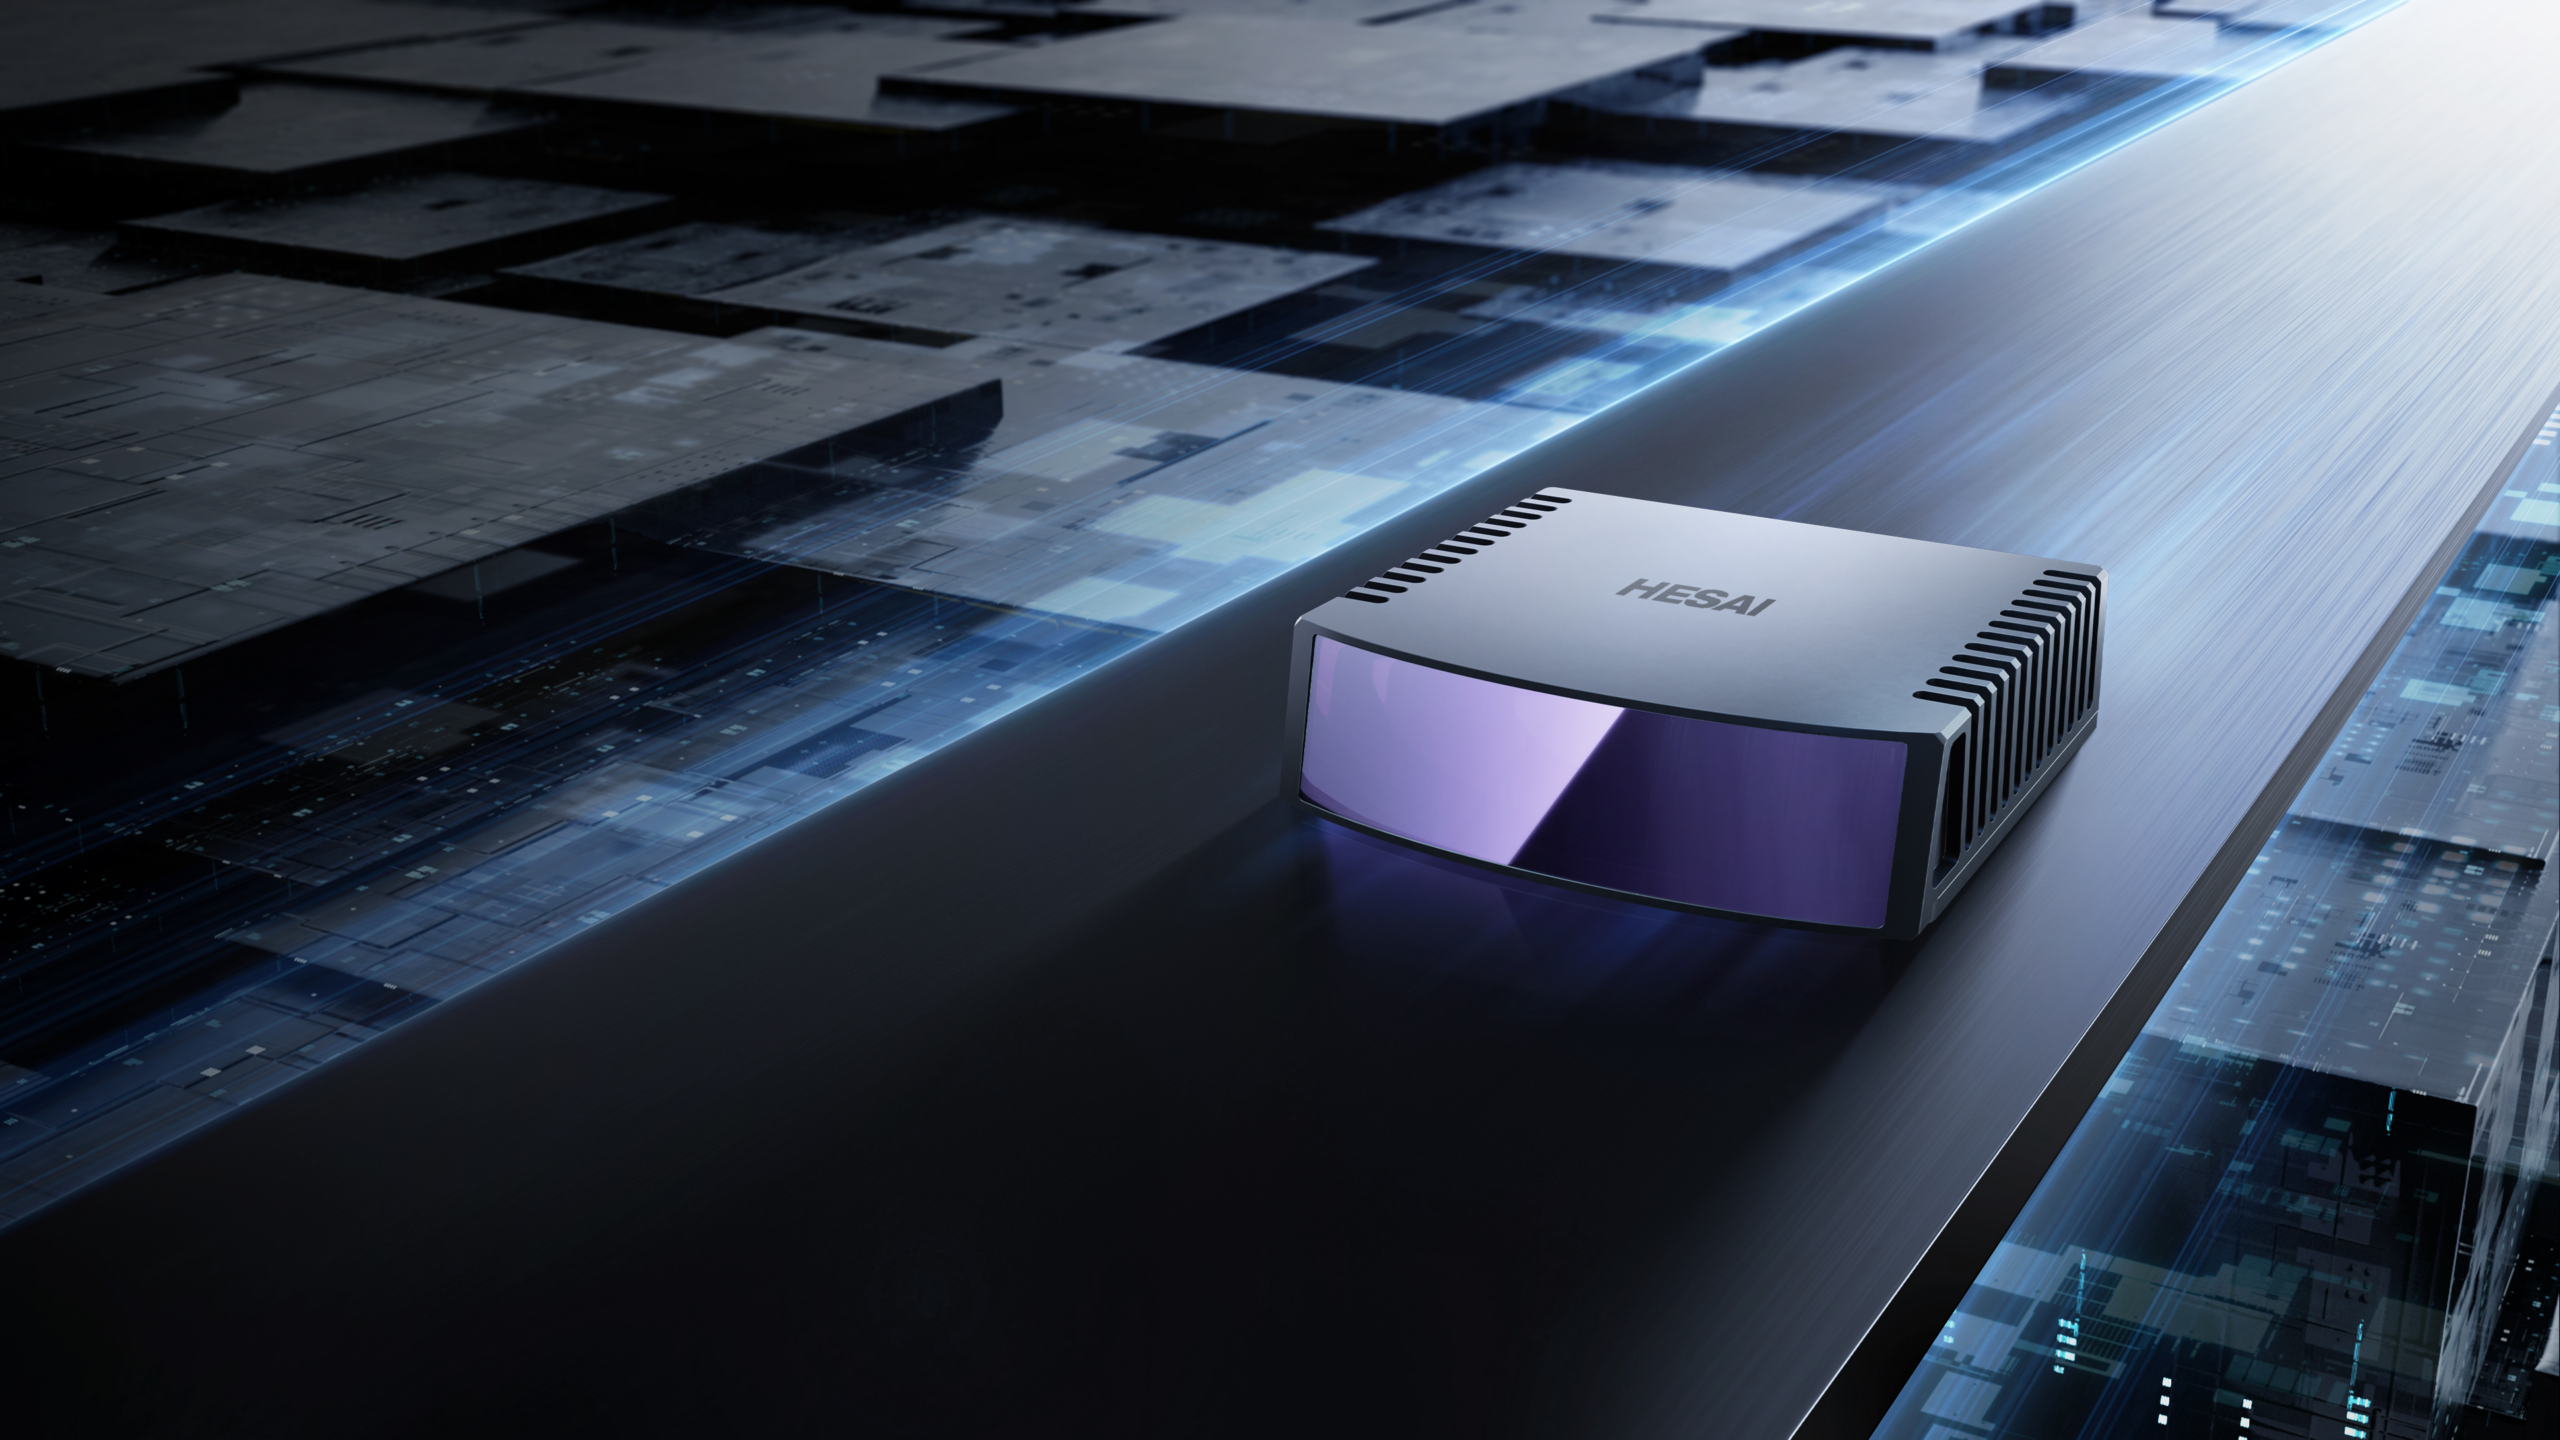
A key highlight was Picasso, the world’s first 6D full-color ultra-sensitive lidar SPAD-SoC, enabling native fusion of spatial and color perception at the ASIC level. Built on this platform, Hesai’s ETX lidar series has been upgraded to support up to 4320 channels and is expected to enter mass production in the second half of 2026. The company also previewed Kosmo, a new spatial intelligence AI hardware product, and outlined a new direction in robotic actuation modules for physical AI systems.
Picasso – The World’s First 6D Full-Color Ultra-Sensitive Lidar ASIC Platform
At the core of today’s announcement is Picasso, Hesai’s fifth-generation 6D full-color ultra-sensitive lidar ASIC platform, designed to enable vehicles to see both geometry and color natively on a single chip.
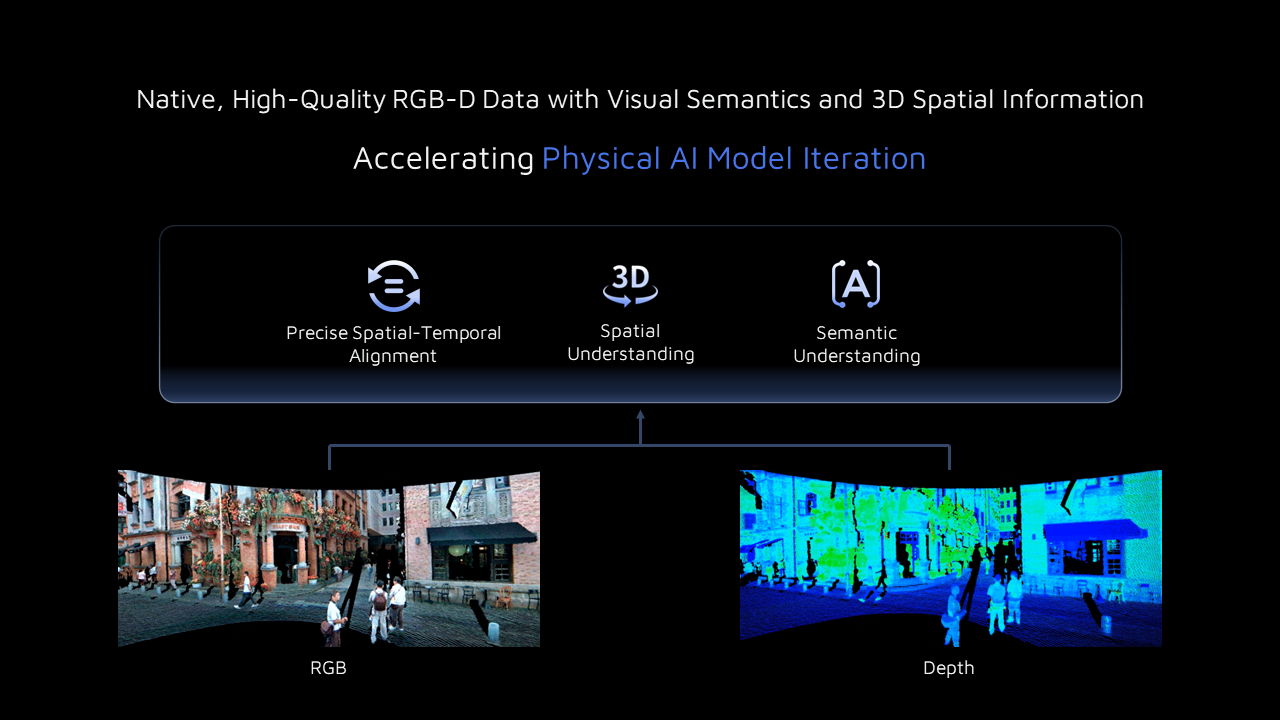
Unlike conventional lidar systems that capture only geometric information such as XYZ, Picasso integrates RGB sensing and time-of-flight (ToF) ranging at the chip-level, enabling the direct generation of colorized point clouds without the need for complex sensor fusion. This 6D full-color capability delivers precise spatial and temporal alignment, resulting in richer environmental understanding and significantly enhancing the perception capabilities of next-generation autonomous systems.

With photon detection efficiency (PDE) exceeding 40%, Picasso delivers industry-leading sensitivity, enabling stronger long-range performance, better detection of small objects, and improved performance in low-light environments within the same power envelope.
Rather than simply combining camera imagery with lidar point clouds, Picasso enables true ASIC-level fusion, with each point inherently carrying color information. This allows autonomous systems to move from spatial perception to real-time understanding of the driving environment, improving performance in different scenarios such as traffic signals, lane markings, and construction zones.

The introduction of Picasso marks a major step in lidar development, moving beyond incremental improvements in resolution toward a new generation of full-color perception. This breakthrough is supported by Hesai’s long-term vertical integration strategy and in-house development across core lidar technologies. Following the launch of Fermi C500, a RISC-V-based high-performance lidar controller SoC that integrates MCU, FPGA functions, and ADC into a single chip, the company has established full-stack in-house ASIC development capabilities. This technology foundation has already translated into large-scale commercialization, with Hesai’s upgraded ATX lidar achieving full-scale mass production and securing over 6 million units in orders from leading OEMs.

Today, Hesai is the only lidar company in the world to develop all seven core components in-house, including its laser transmitter, receiver, driver, TIA, ADC, digital signal processor, and controller. To date, 21 of its in-house designs have achieved AEC-Q automotive-grade certification, with cumulative shipments exceeding 230 million units and expected to surpass 300 million units by the end of 2026.
According to global IP consultancy KnowMade, Hesai ranks No.1 worldwide in both patent volume and overall patent strength, with leading positions across key device categories including SPAD/SiPM detectors, VCSEL transmitters, and APD detectors. In the SPAD/SiPM segment, Hesai’s patent portfolio is approximately twice that of Bosch, the second-ranked company, and up to forty times larger than that of other industry peers.
ETX Platform Upgraded to Full-Color Perception with 1000+ Channels
As the flagship lidar platform built on the Picasso architecture, the next-generation ETX represents a major step forward in high-performance perception. Designed for L3 and above autonomous driving, it combines longer range, higher resolution, and full-color perception in a flexible architecture with 1,080, 2,160, and up to 4,320 channels. With ultra-long-range detection and high-resolution perception, ETX enables vehicles to see farther and capture more detail across complex driving environments.

With a maximum detection range of up to 600 meters and 400 meters at 10% reflectivity, ETX delivers industry-leading performance in both range and small-object detection. It enables high-confidence identification of critical road elements at long distances, including objects as small as a 15 × 25 cm wooden block at 150 meters, significantly improving safety margins.

Real-World Scene with Conventional Lidar Point Cloud*

Real-World Scene with Picasso Full-Color Lidar Point Cloud*
*ETX platform real-world point cloud. Prototype results are for reference only. Mass production versions will be customized based on customer requirements, and final specifications are subject to actual delivery.
Built on the Picasso platform, ETX integrates Hesai’s latest perception technologies to further enhance performance and reliability. These include upgraded Addressable Photon Isolation technology, advanced signal processing through the Intelligent Point Cloud Engine (IPE), and an enhanced anti-interference design, enabling more accurate signal extraction while suppressing noise and reducing false positives and false negatives compared with conventional SPAD-based approaches, significantly enhancing system safety and reliability.

ETX is expected to enter mass production in the second half of 2026, with planned deployment across multiple flagship vehicle models, supporting the large-scale adoption of L3 autonomous driving systems.
From Automotive to Robotics: Enabling the Physical AI Era
Hesai continues to lead the automotive lidar market in China and globally. According to Gasgoo Research Institute, the company held over 40% market share in 2025, ranking first in the industry, and maintained strong momentum into 2026, reaching a 51% share in February, 2.2 times that of the second-ranked player and more than three times that of the third, and extending its market leadership to 13 consecutive months. To date, Hesai has secured production design wins for more than 160 models across 40 automotive brands.

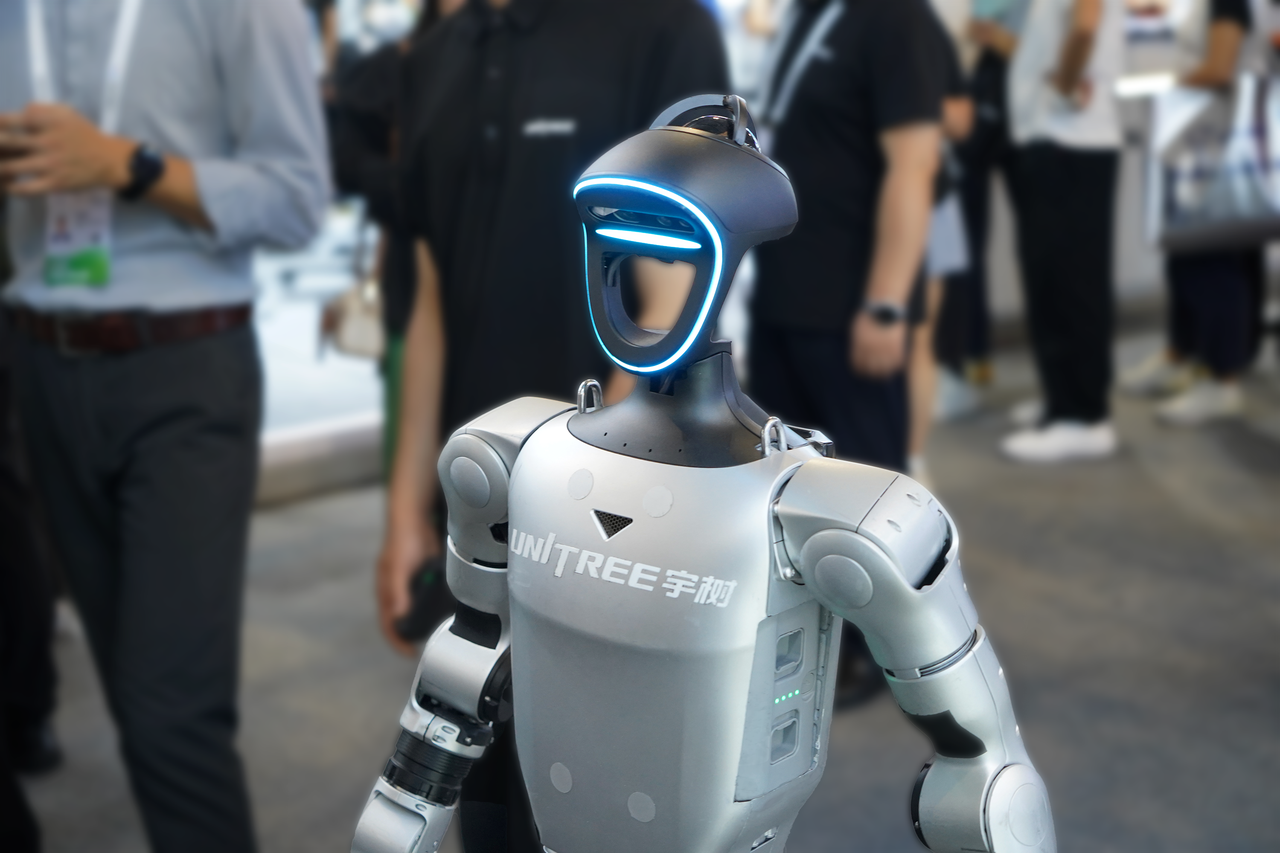
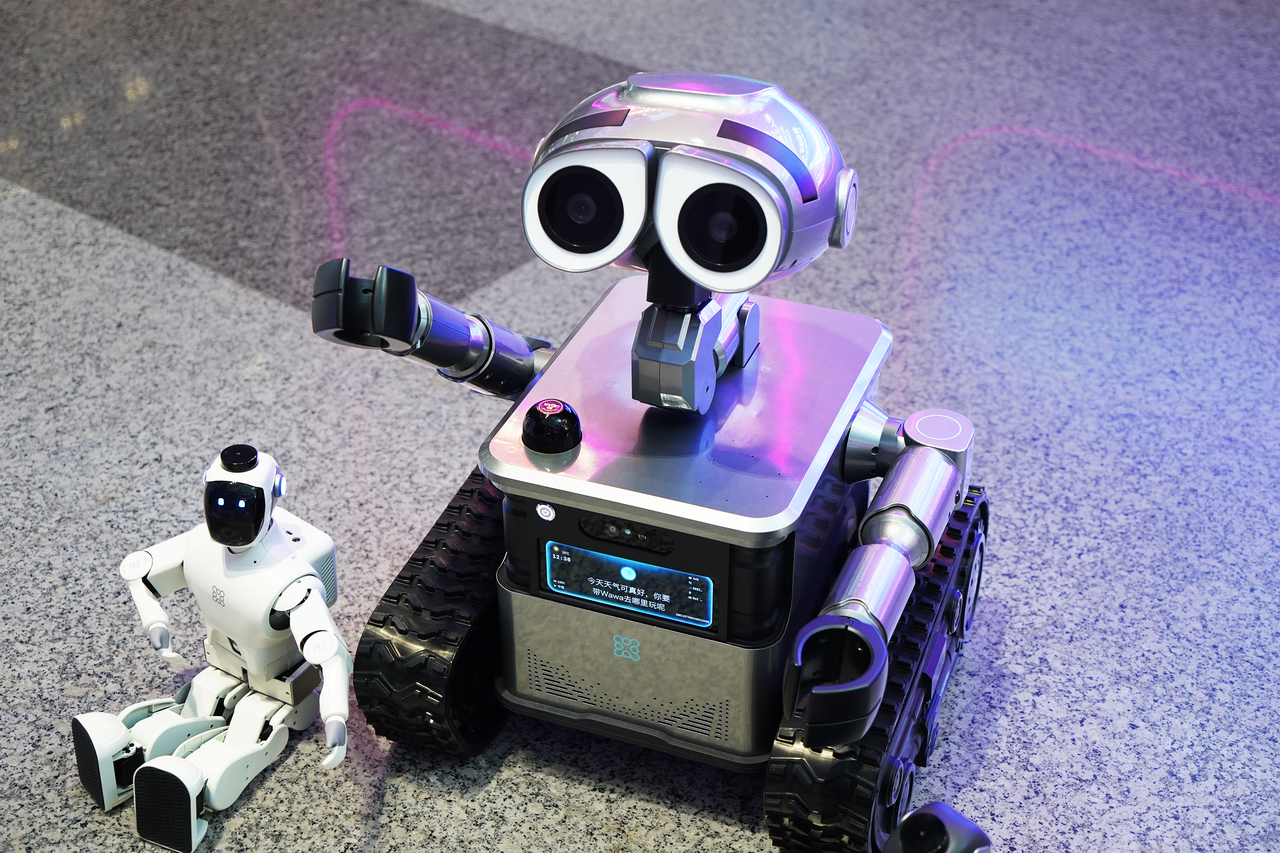
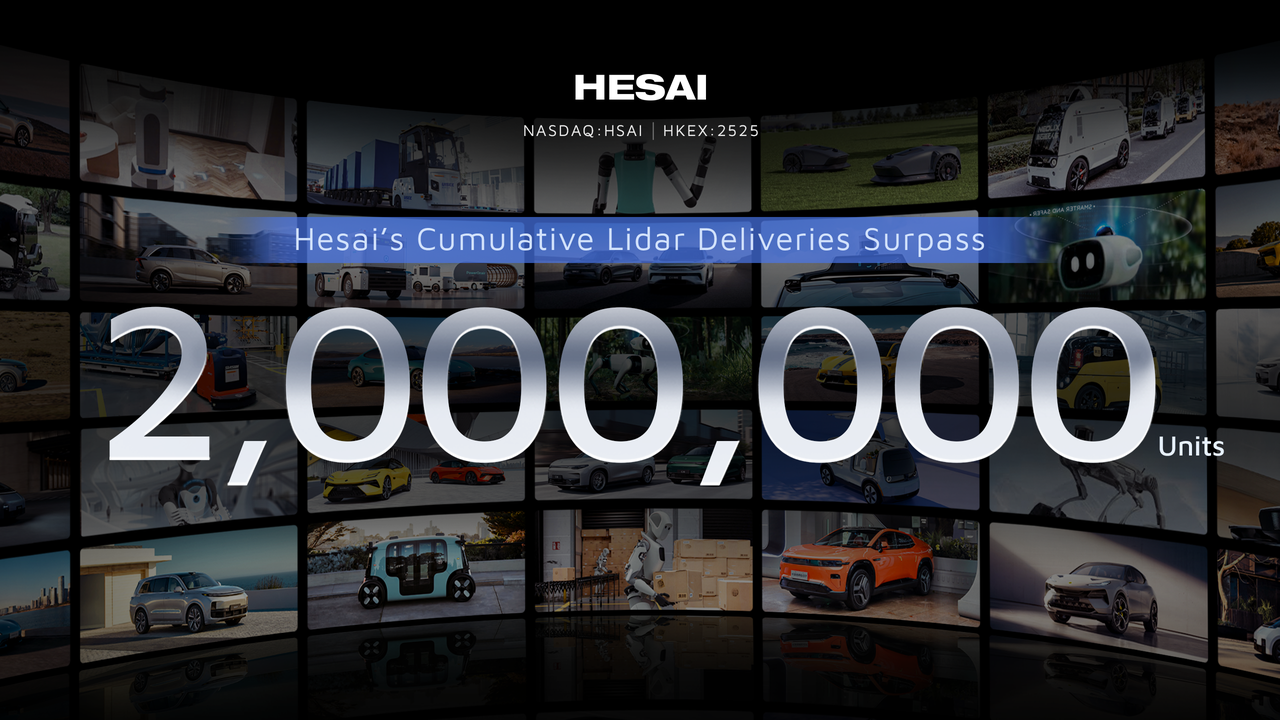
Hesai is extending its leadership beyond automotive into robotics and embodied AI, with lidar solutions deployed across applications including delivery robots, cleaning robots, automated guided vehicles (AGVs), and robotaxi platforms. The company ranks No. 1 globally across multiple robotics lidar segments and is the only lidar company named to Morgan Stanley’s “Humanoid Tech 25” list.
As Physical AI systems scale globally, demand for high-performance perception continues to accelerate. Morgan Stanley estimates that lidar demand could reach 700 million units by 2050, driven by more than 1.4 billion robots, highlighting the growing role of lidar as a core enabling technology for next-generation intelligent systems.
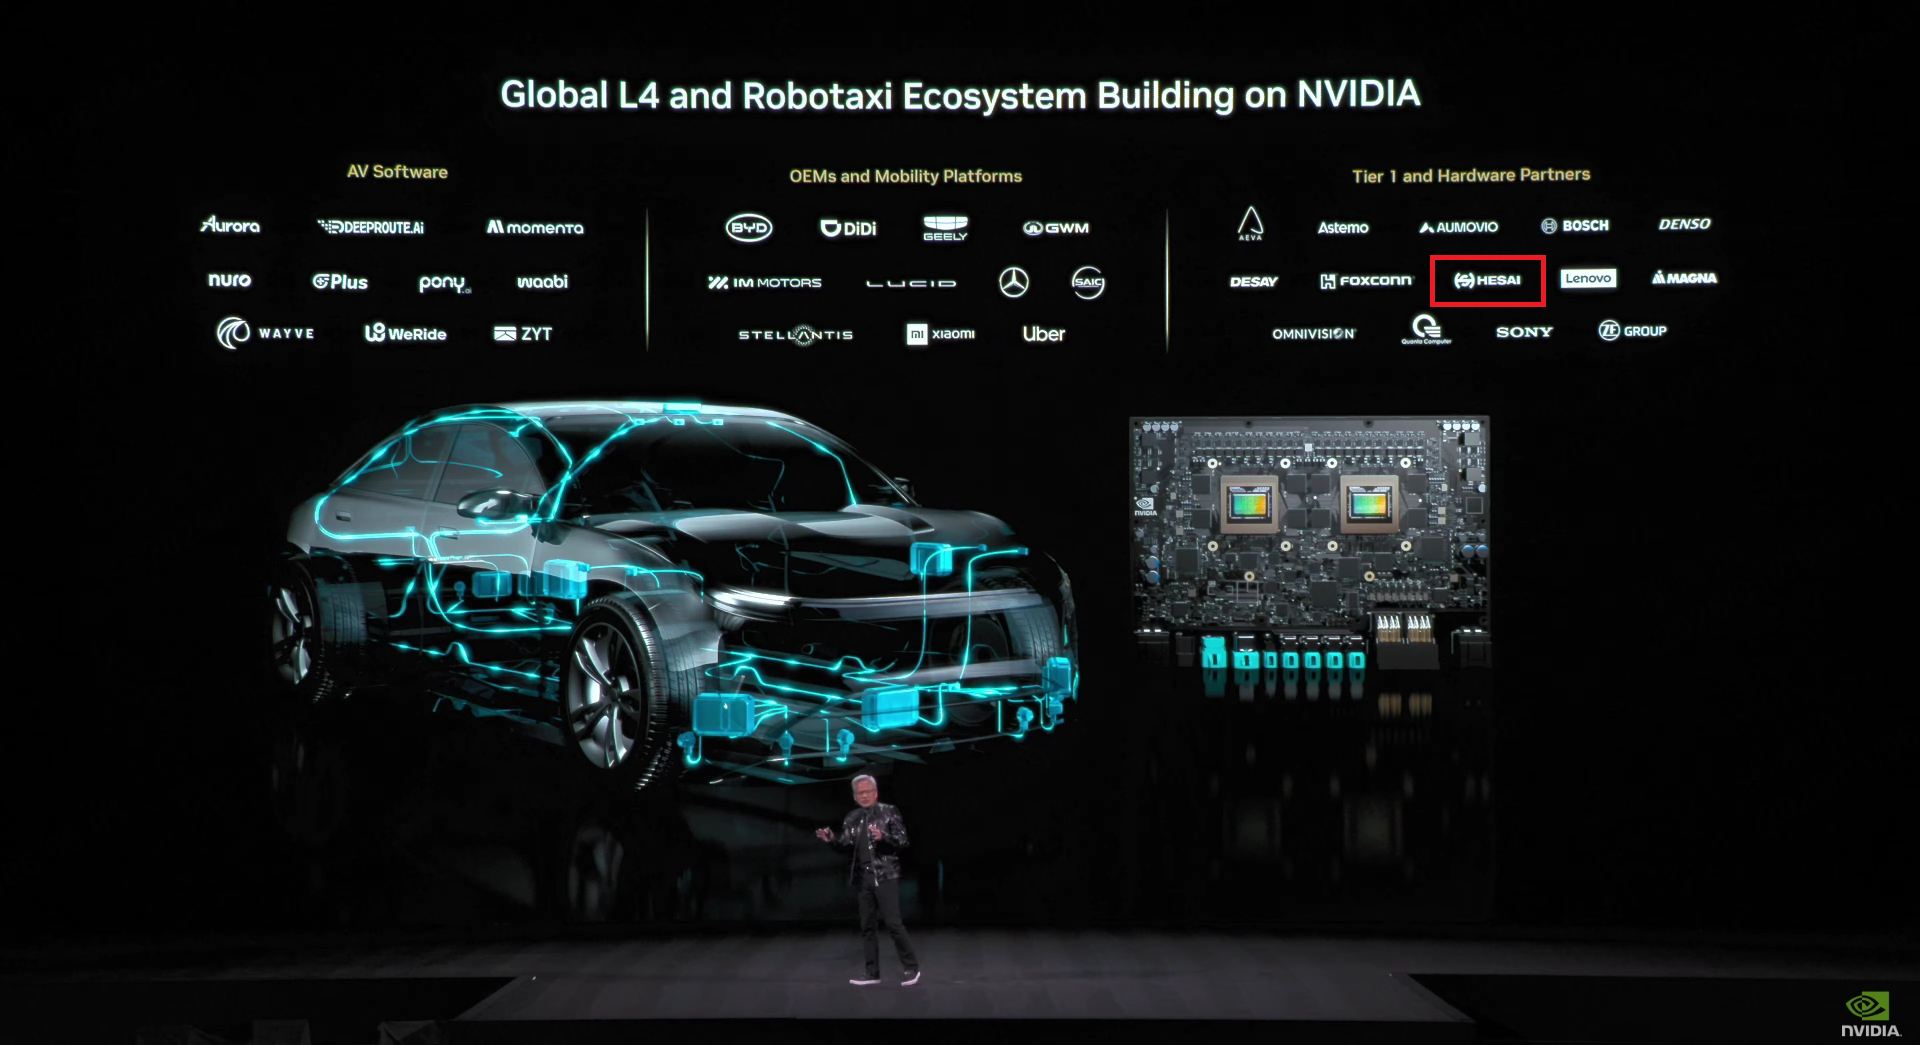
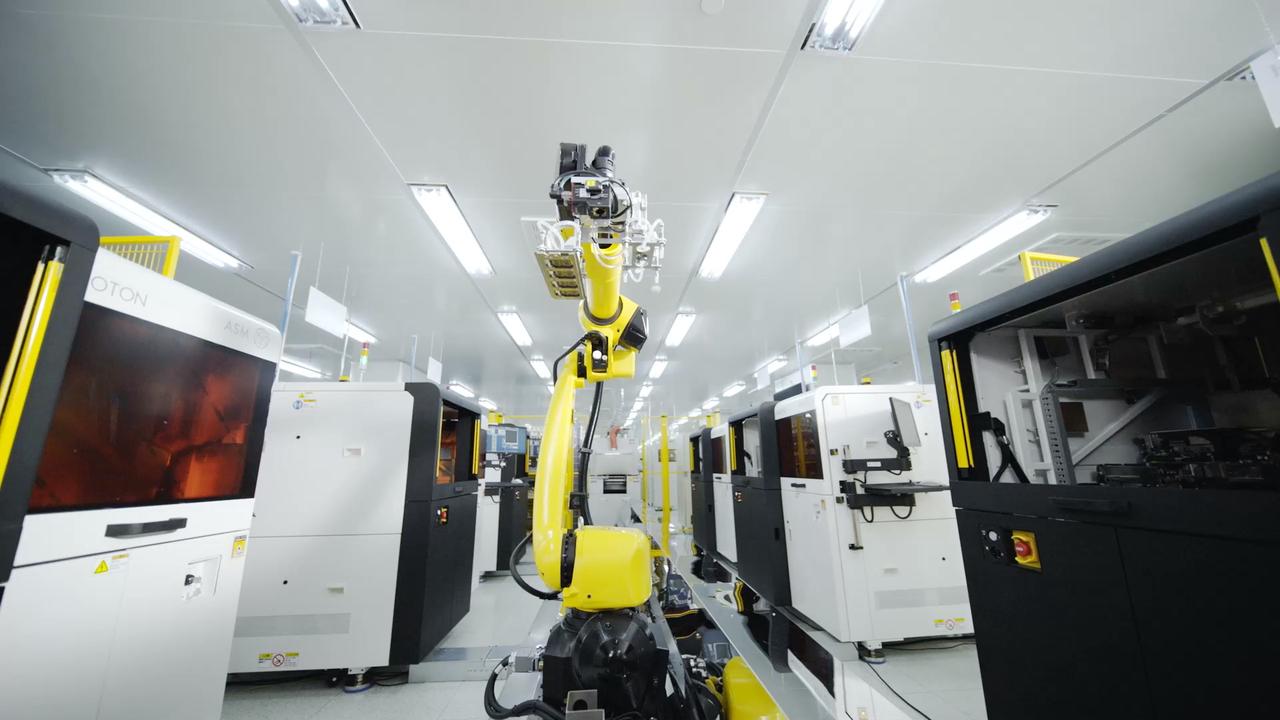
Hesai’s global capabilities form the foundation for scaling its lidar and Physical AI strategy. The company has been selected by NVIDIA as a key partner for the NVIDIA DRIVE Hyperion 10 platform. By leveraging the standardized sensor architecture of Hyperion 10, OEMs can accelerate the development and deployment of autonomous driving systems in a safer, faster, and more scalable way. Backed by clear structural advantages in scalability, quality management, and cost, Hesai has established a leading global market position. This is supported by robust product development, manufacturing, and supply chain processes, as reflected in its A-grade result in a VDA 6.3 process audit, with a 90+ audit score. Today, its lidar solutions are enabling Physical AI applications across industries in over 40 countries worldwide.

Bob in den Bosch, Senior Vice President of Global Sales, Hesai
Kosmo & Robotic Actuation Modules – From Perception to Intelligence
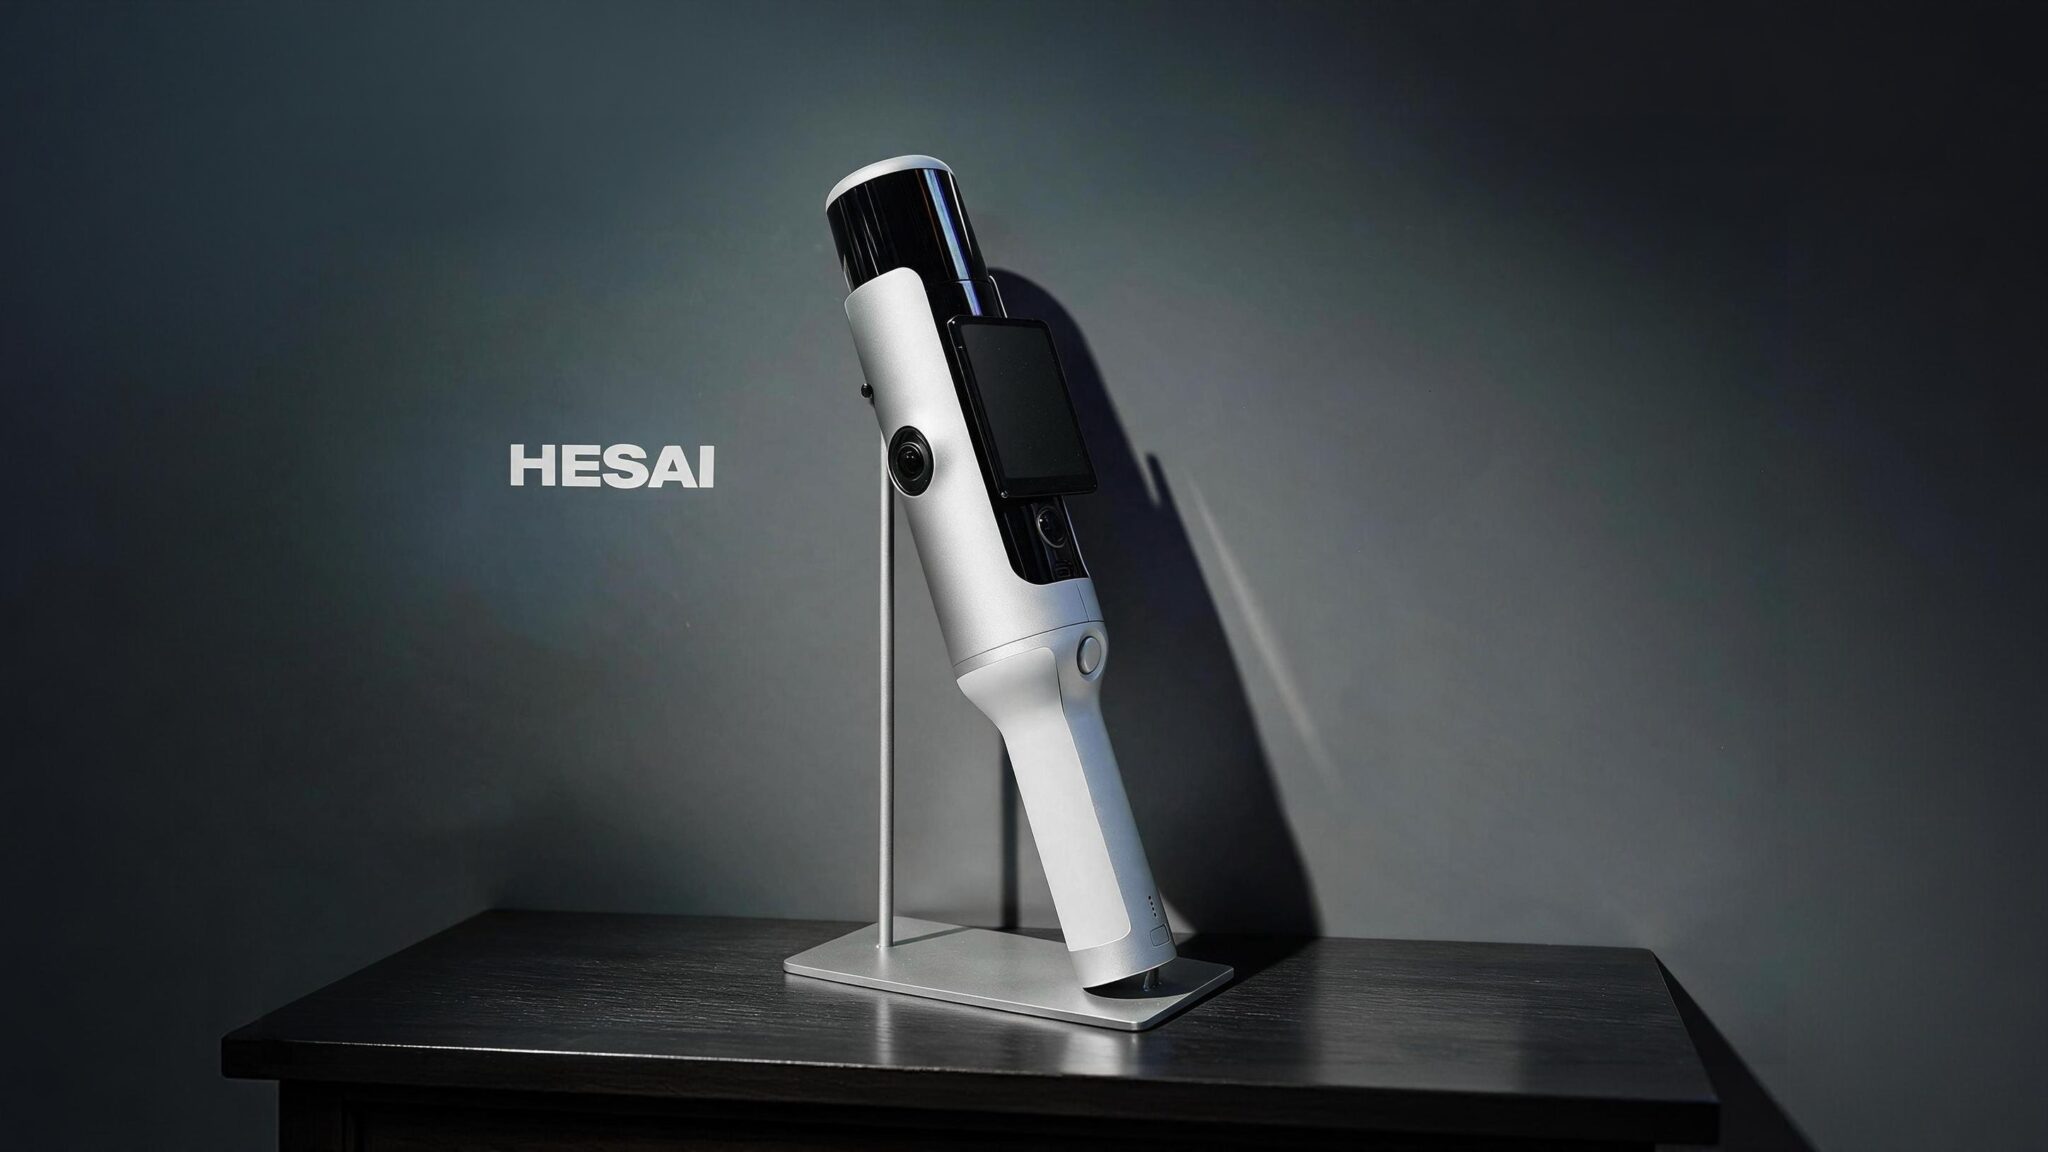
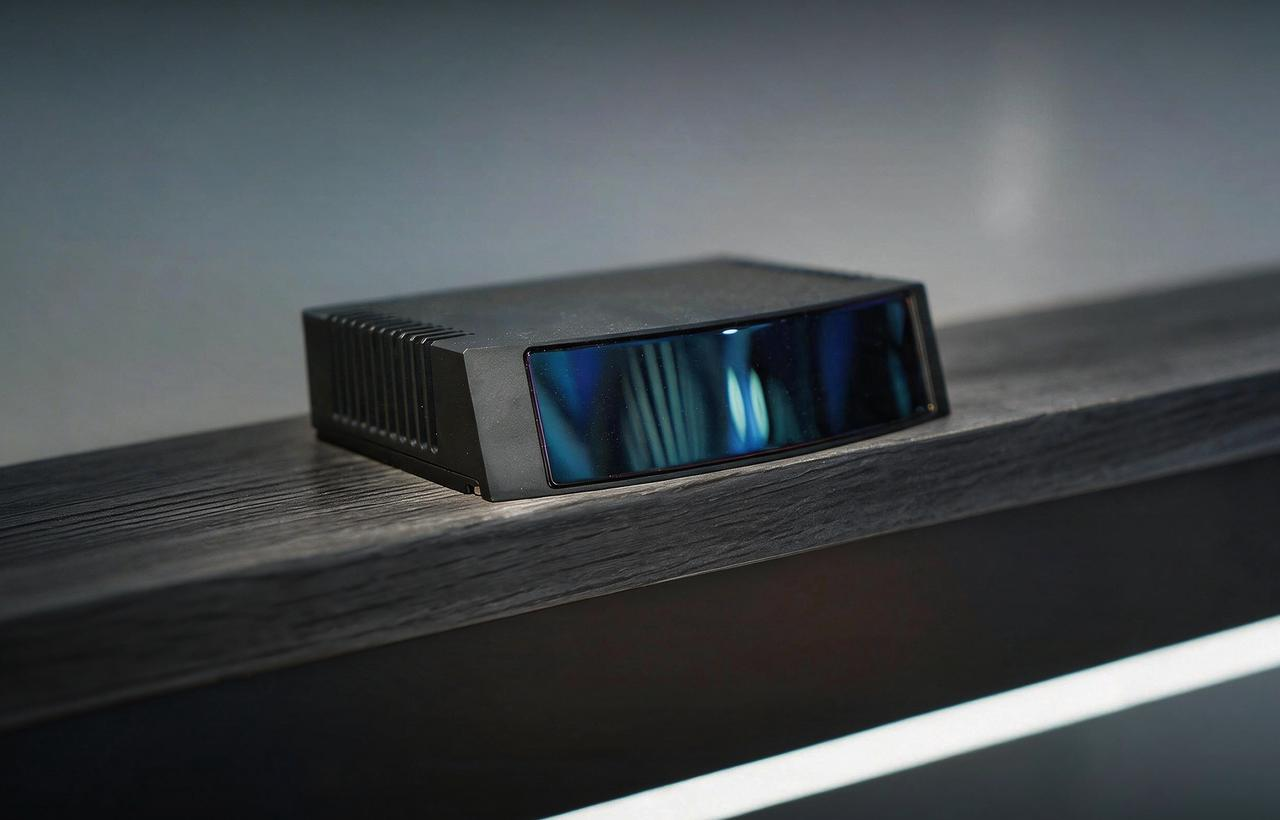
Hesai also previewed Kosmo, a new spatial intelligence AI hardware scheduled for release later this year. Designed to capture the 3D world in high fidelity, bringing the physical world into the digital space for immersive and interactive experiences, Kosmo enables scalable spatial data generation and processing. It helps address the shortage of high quality real world data and accelerates the development of world models and embodied AI systems.
Kosmo powers applications across home design, robotics training and many more. In home design, it transforms real spaces into fully interactive digital environments with precise spatial measurements, allowing users to explore from any perspective, rearrange furniture, and adjust lighting in real time. In robotics training, it creates a high-fidelity digital environment where robots can explore, interact, and learn through trial and error, simulating real-world physics to accelerate embodied intelligence.
Apply for early access: https://www.hesaitech.com/cn/kosmo-contact-form-en

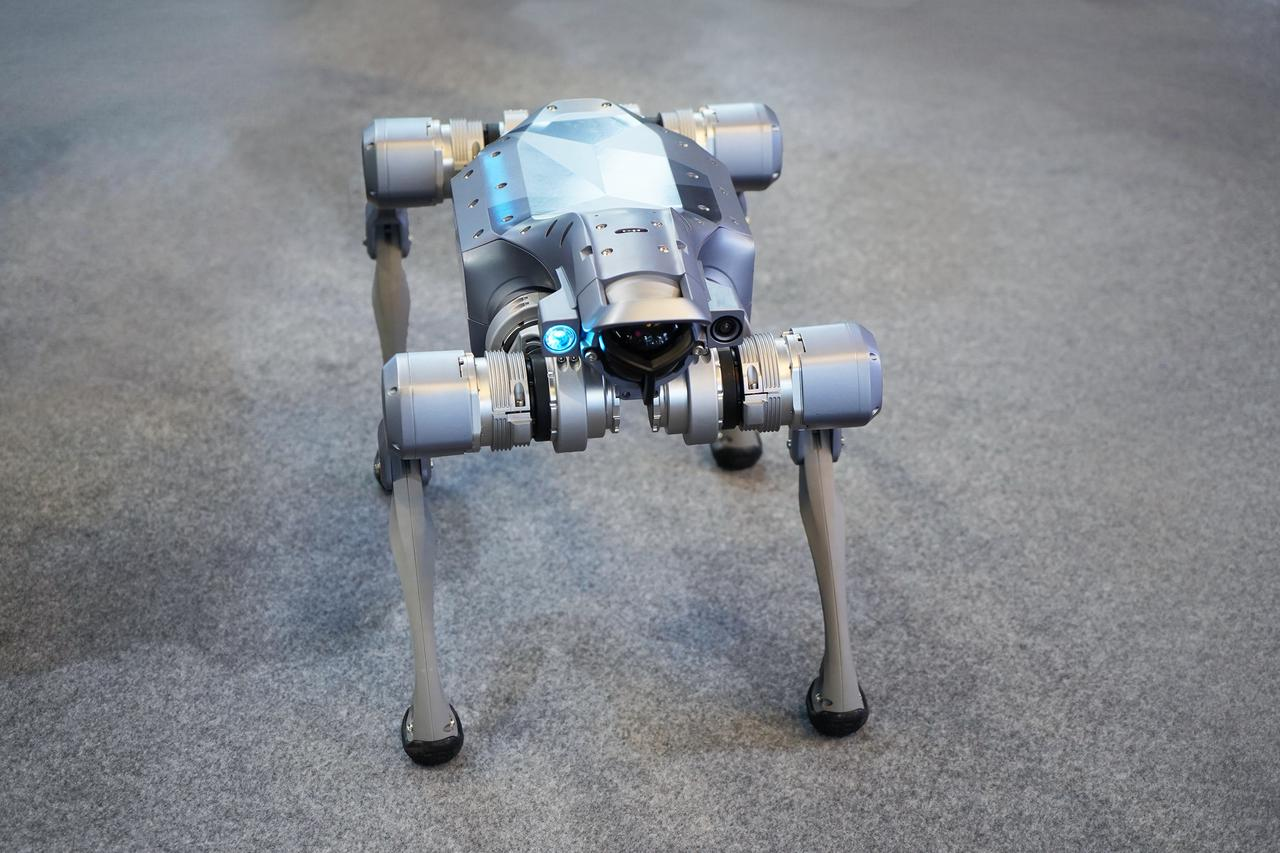
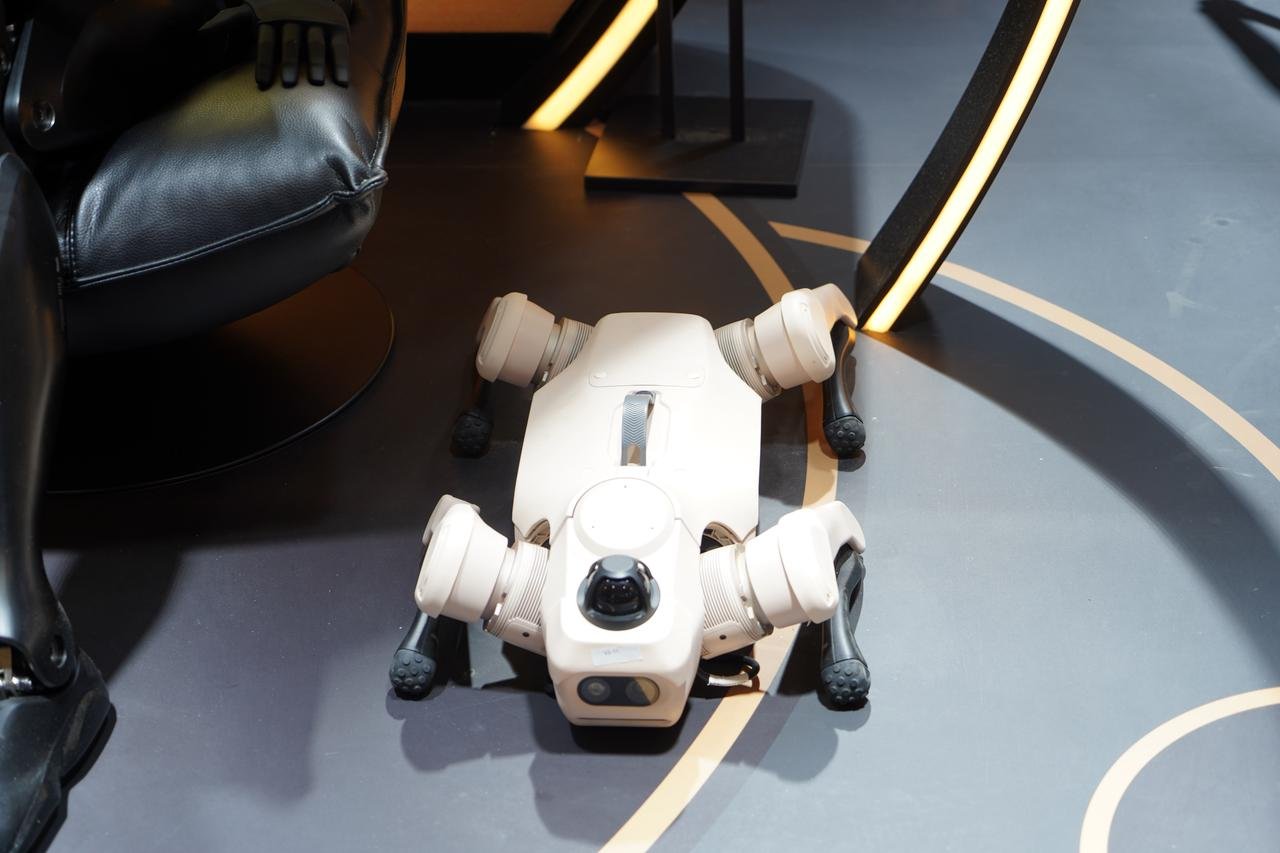
In addition, Hesai unveiled a new strategic direction in robotic actuation modules, core infrastructure for the era of Physical AI. The company has moved into the underlying architecture of robotic actuation modules and independently developed key technologies in this domain. As the Physical AI wave accelerates, robotics is entering a critical stage of real-world understanding and interaction. From the “eyes” of robots to their “muscles,” Hesai is expanding its capabilities across intelligent robotics, autonomous driving, smart industrial systems, and broader applications, positioning itself as a key enabler of the Physical AI ecosystem.

This evolution reflects Hesai’s broader strategic expansion from spatial perception to spatial intelligence, moving beyond helping machines sense the world to supporting how they interpret and interact with it, while enabling emerging applications such as world models, embodied intelligence, AI hardware, immersive interaction, AIGC and 4D entertainment.

Other news
October 28, 2026
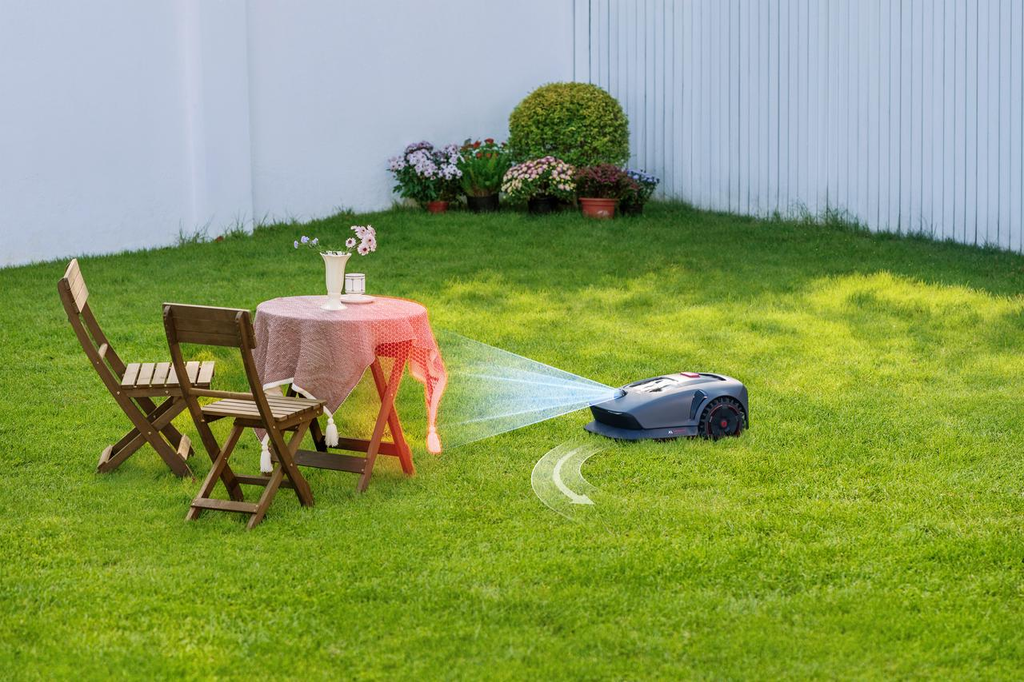
Robots in the Real World: What Lidar Makes Possible

October 26, 2026
From Forklift Routes to Operational Insight with Lidar
October 21, 2026
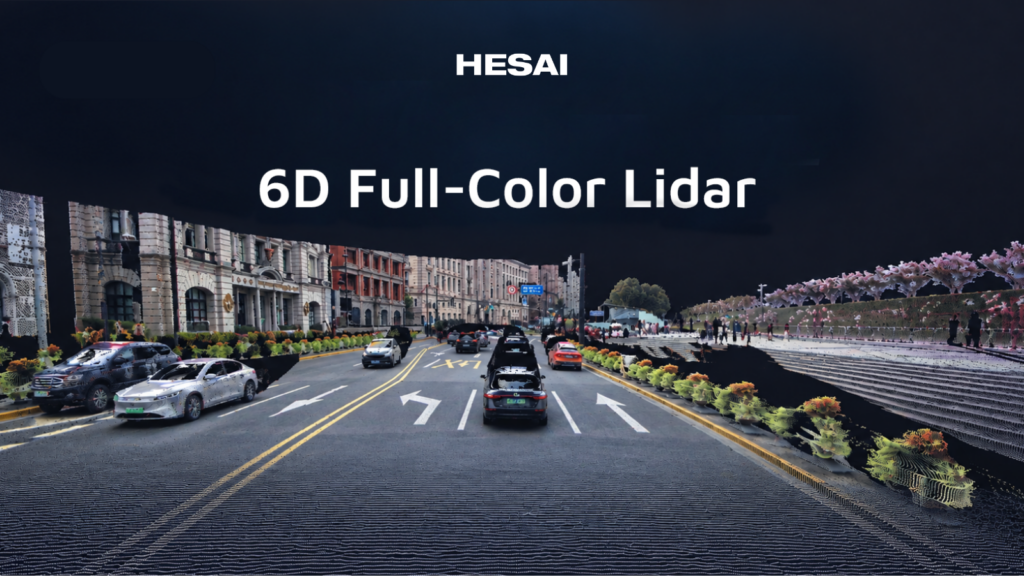
6D Full-Color Lidar, The Ultimate Sensor for the Physical AI Era

Subscribe to HESAI
Sign up to receive news, alerts and insights.
Email(Required)
Submit
ETHICS & COMPLIANCE REPORTING: [email protected]
US Office
3500 W Bayshore Rd,
Palo Alto, CA 94303
European Office
Charles-Lindbergh-Platz 1
71034 Böblingen, Germany
Global Operations Center
Building A, No.658 Zhaohua Rd.,
Changning District, Shanghai
Copyright © 2026 Hesai Group. All Rights Reserved.
X
ACCESS DOWNLOADS NOW
Please fill in all fields
Name(Required)
FIRST NAME LAST NAME
Email(Required)
PHONE(Required)
ORGANIZATION(Required)
INDUSTRY(Required)
ADAS
ROBOTICS / INDUSTRIAL
UNIVERSITY / RESEARCH INSTITUTE
AUTONOMOUS MOBILITY
OTHERS (PLEASE SPECIFY)
REGION(Required)
Asia-PacificEurope, the Middle East, and AfricaNorth America, Central America, and South America
Yes, I would like to receive marketing communications regarding Hesai products, services, and events. i can unsubscribe at any time
I authorize Hesai Technology to contact me with personalized communications about Hesai products and services. See our privacy policy for more detail, you can opt out at any time.
Submit
X
CONNECT WITH A LIDAR EXPERT TODAY
Connect with our sales team to explore how our cutting-edge technology can empower your business today.
"*" indicates required fields
X/Twitter
This field is for validation purposes and should be left unchanged.
Name*
First Last
Email*
Phone*
Job Title*
Organization*
Region*
Asia-PacificEurope, the Middle East, India and AfricaNorth America, Central America, and South America
Countries*
ArgentinaAustraliaAustriaBangladeshBelgiumBrazilCambodiaCanadaChileChina, MainlandColombiaCosta RicaCzech RepublicDenmarkDominican RepublicEgyptFinlandFranceGermanyGreeceHong Kong SARHungaryIndiaIndonesiaIrelandIsraelItalyJapanJordanKazakhstanKenyaKuwaitMalaysiaMexicoMongoliaMoroccoMyanmarNepalNetherlandsNew ZealandNigeriaNorwayOmanPakistanPanamaPeruPhilippinesPolandPortugalQatarRomaniaRussiaSaudi ArabiaSingaporeSlovakiaSouth AfricaSouth KoreaSpainSri LankaSwedenSwitzerlandTaiwan RegionThailandTurkeyUkraineUnited Arab EmiratesUnited KingdomUnited StatesUzbekistanVietnam
States*
AlabamaAlaskaArizonaArkansasCaliforniaColoradoConnecticutDelawareFloridaGeorgiaHawaiiIdahoIllinoisIndianaIowaKansasKentuckyLouisianaMaineMontanaNebraskaNevadaNew HampshireNew JerseyNew MexicoNew YorkNorth CarolinaNorth DakotaOhioOklahomaOregonMarylandMassachusettsMichiganMinnesotaMississippiMissouriPennsylvaniaRhode IslandSouth CarolinaSouth DakotaTennesseeTexasUtahVermontVirginiaWashingtonWest VirginiaWisconsinWyoming
City*
e.g. San Francisco
State/Country*
e.g. California (U.S.) / Germany(Intl.)
Industry*
Automotive(ADAS)
Autonomous Mobility
Robotics & Industrial
Stationary Applications
Spatial Sensing
Ground Truth
Others (please specify below)
Other Organization Type*
Product you are interested in*
ET SERIES - AUTO-GRADE 120° ULTRA-LONG-RANGE LIDAR
AT Series - Auto-Grade 120° Ultra-High Resolution Long-Range Lidar
FT Series - Auto-Grade Fully Solid-State Short-Range Lidar
JT Series - Mini 360° Short-Range 3D Lidar
XT Series - High-Precision 360° Mid-Range Lidar
QT Series - Auto-Grade 360° Ultra-Wide View Short-Range Lidar
Pandar Series - Auto-Grade 360° High-Performance Long-Range Lidar
OT Series - Auto-Grade 360° High-Performance Long-Range Lidar
MT Series - Ultra-High Spatial Resolution Lidar
How did you hear about Hesai?*
Direct Web Search
AI Search
Social Media (LinkedIn/X/Youtube)
Events & Tradeshows
Recommended by Others (Hesai partner/distributor/customer)
Others (please specify below)
How did you hear about Hesai?(Other)*
Detailed Requirements
Terms and Conditions*
I have read and accepted the Privacy Policy
.
CAPTCHA

Submit