DATE OF BOARD MEETING
Bull 0
Bear 0
Routine
2391
|
Tuya Inc. is a global AI cloud platform service provider that offers PaaS and SaaS solutions to enable developers and businesses to build smart IoT devices. The company operates an AI developer ecosystem connecting brands, OEMs, partners, and end users through a network of smart devices. Key offerings include the TuyaOpen open-source development framework, universal AI Agent engines, and the Tuya.AI platform for AI development. Tuya provides industry-focused solutions such as space-intelligence, smart house and real estate applications, and smart hotel scenarios. The company serves customers in the PRC and globally. Tuya partners with entities such as Qualcomm and the European Artificial Intelligence Business Alliance. Founded in 2014, the company listed on the New York Stock Exchange in 2021 and completed a dual primary listing on the HKEX in 2023. Summarised from the company's own disclosures, fiscal year ended Apr 2026 |
Industry Software - Infrastructure | Homepage tuya.com |
| Sector Technology | IR page ir.tuya.com | |
|
Tags
ai-cloud-platform, iot-development, saas, paas, smart-home, ai-agents, developer-ecosystem, spatial-intelligence, open-source-framework, TuyaOpen, Tuya.AI, Tuya PLUS, SmartLife App SDK, Extension SDK, UI BizBundle SDK, Tuya Developer Platform, TuyaGo, TuyaExpo, App Mall
|
Press page — |
Metrics
| Valuation | |
|---|---|
| Market cap | HK$ 7.25B |
| Market cap (USD) | $ 923.951M |
| P/E | 16.03 |
| PEG | — |
| P/BV | 0.81 |
| P/S | 2.71 |
| P/OCF | 13.99 |
| P/FCF | — |
| Dividend yield | 4.0% |
| Turnover / mcap | <0.01% |
| Returns | |
|---|---|
| ROE | 5.7% |
| ROI | 5.7% |
| ROIC | 1.1% |
| Profit margin | 18.0% |
| Growth | |
|---|---|
| Revenue growing | Yes |
| Profits growing | Yes |
| Revenue up 3y | Yes |
| Revenue up 5y | — |
| Earnings growth 3y (net profit CAGR) | — |
| Quality | |
|---|---|
| Profitable | Yes |
| Margin expanding | Yes |
| Buying back stock | No |
| Diluting (TTM) | No |
| Debt/Equity | — |
| Podcast bulls (TTM) | Sign up |
| Podcast bears (TTM) | Sign up |
| Podcast sentiment (TTM) | Sign up |
| Podcast sentiment % (TTM) | Sign up |
| News sentiment (TTM) | 0 |
| Quality score | 31.3% |
| Insiders | |
|---|---|
| Buys, 1w | Sign up |
| Buys, 1m | Sign up |
| Buys, 1y | Sign up |
| Sells, 1w | Sign up |
| Sells, 1m | Sign up |
| Sells, 1y | Sign up |
Sign up to see this company's insider trades
Filed figures
Lines the statements and their notes report beside the headline figures, read from the filings' XBRL as filed (no restatement applied), with figures computed from one filing's own lines. Cash-flow lines carry their cash direction: an outflow is negative. Each period links to its filing; a figure's period, report date and tag are in its tooltip.
| Figure | Dec 2018 | Dec 2019 | Dec 2020 | Dec 2021 | Dec 2022 | Dec 2023 | Dec 2024 | Dec 2025 |
|---|---|---|---|---|---|---|---|---|
| Balance sheet detail | ||||||||
| Trade receivables (USD) | — | — | 12.3M | 32.7M | 12.2M | 9.21M | 7.59M | 13.2M |
| ↳ YoY growth | +165.5% | -62.8% | -24.3% | -17.6% | +73.8% | |||
| ↳ 5y CAGR | +1.4% | |||||||
| Lease liabilities (USD) | — | — | 12M | 21.7M | 9.14M | 7.79M | 4.65M | 5.31M |
| Cash and deposits (USD) | 87.6M | 213M | 159M | 964M | 133M | 499M | 653M | 891M |
| Right-of-use assets (USD) | — | — | 12.3M | 22.2M | 9.74M | 7.65M | 4.55M | 5.65M |
| Cash flow detail | ||||||||
| Operating cash flow (USD) | — | -56.6M | -49.2M | -126M | -70.7M | 36.4M | 80.4M | 81M |
| Purchases of property, plant and equipment (USD) | — | -2.49M | -3.2M | -6.19M | -710,000 | -1.5M | -4.18M | -7.14M |
| Change in receivables (cash effect) (USD) | — | -4.01M | -7.24M | -23.4M | 20.2M | 1.05M | 484,000 | -4.88M |
| Change in inventories (cash effect) (USD) | — | -11M | -19.8M | -22.1M | 13.1M | 9.22M | 7.03M | -8.17M |
| Dividends paid (cash effect) (USD) | — | — | — | — | — | — | -33M | -69.8M |
| Share buybacks (cash effect) (USD) | — | — | — | -64M | -48.7M | -3.34M | -70,000 | -12,000 |
| Income taxes paid (cash effect) (USD) | — | 197,000 | 210,000 | 616,000 | 843,000 | -2.82M | -2.69M | -2.53M |
| Share-based compensation (USD) | 11.8M | 5.22M | 9.45M | 66.1M | 69M | 65.2M | 67.8M | 22.3M |
| Operating cash flow before change in receivables (USD) | — | -52.6M | -42M | -103M | -90.9M | 35.4M | 79.9M | 85.9M |
| Free cash flow (OCF - PPE - intangibles) (USD) | — | -59.1M | -52.4M | -132M | -71.4M | 34.9M | 76.2M | 73.9M |
| Income detail | ||||||||
| Research and development expense (USD) | — | 52M | 77.4M | 174M | 145M | 102M | 95M | 89.7M |
| ↳ 5y CAGR | +12.8% | +3.0% | ||||||
| Total comprehensive income (USD) | — | -70.9M | -64M | -174M | -171M | -55.3M | 2.37M | 62.8M |
| Comprehensive income to owners (USD) | — | -70.9M | -64M | -174M | -171M | -55.3M | 2.37M | 62.8M |
| Provision for credit losses (USD) | — | 366,000 | 278,000 | 1.03M | 288,000 | 1.53M | — | — |
| Credit cost ratio (credit losses / average receivables) (%) | — | — | — | 4.6% | 1.3% | 14.3% | — | — |
| Reported | Apr 28, 2022 | Apr 28, 2022 | Apr 28, 2022 | Apr 28, 2022 | Apr 26, 2023 | Apr 24, 2024 | Apr 24, 2025 | Apr 22, 2026 |
Sign up to see institutional holdings
Sign UpPodcast Mentions
Sign up to see podcast mentions and sentiment
Sign UpAnnouncements and reports published on HKEXnews, newest first, monthly and next-day returns, proxy forms and board-meeting notices included. The link opens the announcement on HKEXnews. Material events reported to the SEC on Form 8-K or 6-K, newest first. The link opens the filing itself on EDGAR. Press releases from the company's own website, newest first.
Tuya to Report Third Quarter 2026 Financial Results on November 23, 2026 Eastern Time
Bull 0
Bear 0
Routine
SANTA CLARA, Calif., November 9, 2026 -- Tuya Inc. ("Tuya" or the "Company") (NYSE: TUYA; HKEX: 2391), a global leading AI cloud platform service provider, today announced that it will report its third quarter 2026 unaudited financial results after the market closes on Monday, November 23, 2026.
Tuya's management will hold a conference call at 07:30 P.M. Eastern Time on Monday, November 23, 2026 (08:30 A.M. Hong Kong Time on Tuesday, November 24, 2026) to discuss the financial results. In advance of the conference call, all participants must use the following links to complete the online registration process. Upon registering, each participant will receive the dial-in information and a unique PIN (personal access code) to join the call as well as an email confirmation with the details.
Participants Online Webcast Registration: https://edge.media-server.com/mmc/p/iihgn3m4
Participants Call Registration: https://register-conf.media-server.com/register/BI2fb6e3c9d60944bab1a0afb0b86df6be
About Tuya Inc.
Tuya Inc. (NYSE: TUYA; HKEX: 2391) is a global leading AI cloud platform service provider with a mission to build an AI developer ecosystem and enable everything to be smart.
DATE OF BOARD MEETING
Bull 0
Bear 0
Routine
The board of directors (the “Board”) of Tuya Inc. (the “Company”, together with its subsidiaries and consolidated affiliated entities, the “Group”) hereby announces that a meeting of the Board of the Company will be held on Monday, November 23, 2026 Beijing/Hong Kong Time, for the purpose of considering and approving, inter alia, (i) the unaudited quarterly results of the Group for the three months ended September 30, 2026 and its publication, and (ii) transacting any other business.
The Company’s management will hold an earnings conference call on Tuesday, November 24, 2026, at 8:30 A.M. Beijing/Hong Kong Time or on Monday, November 23, 2026, at 7:30 P.M. U.S. Eastern Time.
For participants who wish to join the call, please complete online registration using the link provided below prior to the scheduled call start time. Upon registration, each participant will receive the dial-in information and a unique PIN (personal access code) to join the call as well as an email confirmation with the details.
 View original content:
 View original content:
 View original content:
 View original content:
 View original content:
 View original content:


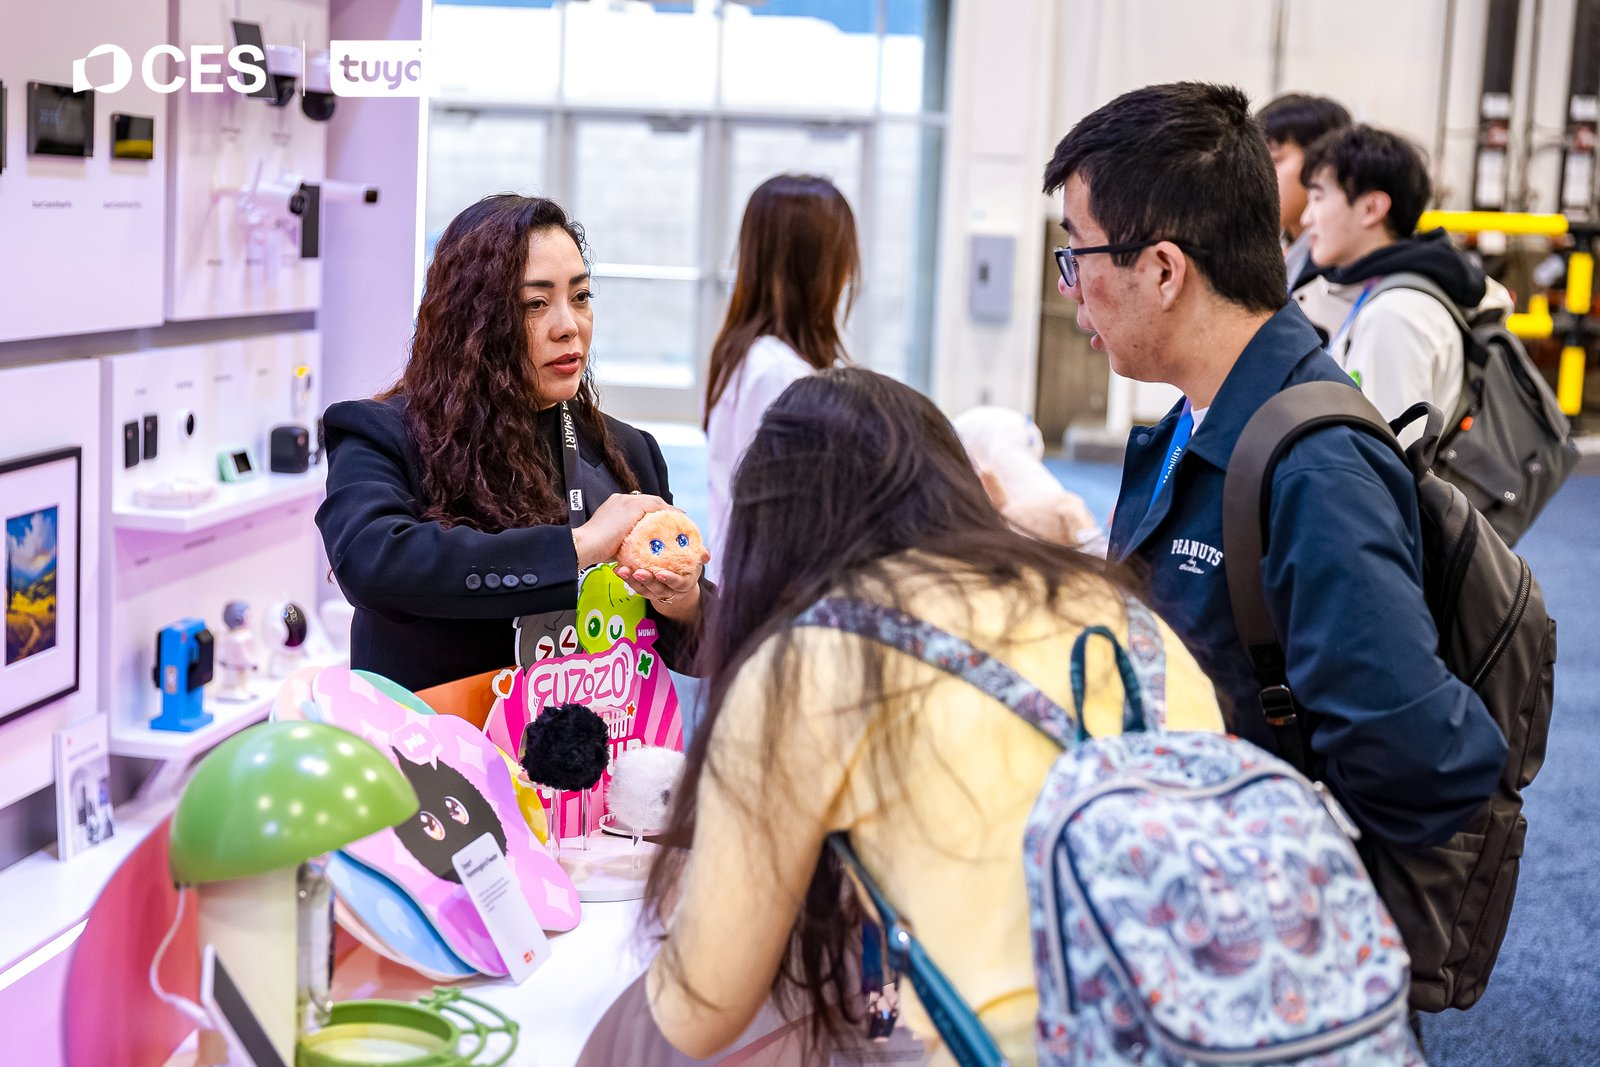



 View original content:
Prompts
Click prompts to add them under the company line, click again to take one out, then copy the result into your AI chat. Shared by Asian Century Stocks and Uncovered Thai Stocks. Thank you.
Tuya Inc. (ticker 2391), listed in Hong Kong.
Copied
ETFs Holding Tuya Inc.
Exchange-traded funds whose newest published daily portfolio holds one of the company's listings, largest weight first.