Date of Board Meeting
Bull 0
Bear 0
Routine
2015
|
LI Auto Inc. is an investment holding company whose subsidiaries engage in the research and development, manufacturing, sales, and after-sales management of automobiles, with a focus on new energy vehicles. The group operates primarily in the People's Republic of China, where substantially all of its operating assets are located and the majority of its revenue and operating profits are derived. Its business activities include technology development and the provision of value-added telecommunication services, surveying, internet map related services, and radio and television production and operation through consolidated affiliated entities. The company utilizes contractual arrangements to maintain control over these entities in compliance with PRC foreign ownership regulations. Its distribution model differs from predominant automaker models, and it relies on third-party suppliers for raw materials and components, including battery packs. Summarised from the company's own disclosures, fiscal year ended Apr 2026 |
Industry Auto Manufacturers | Homepage lixiang.com |
| Sector Consumer Cyclical | IR page lixiang.com | |
|
Tags
new energy vehicles, automobile manufacturing, after-sales management, technology development, value-added telecommunication services, internet map services, radio and television production, vehicle sales, Li Auto App, Beijing CHJ, Beijing CLX, Xindian Information
|
Press page — |
Metrics
| Valuation | |
|---|---|
| Market cap | HK$ 91.97B |
| Market cap (USD) | $ 11.721B |
| P/E | 70.51 |
| PEG | — |
| P/BV | 1.13 |
| P/S | 0.75 |
| P/OCF | -7.85 |
| P/FCF | — |
| Dividend yield | — |
| Turnover / mcap | 0.41% |
| Returns | |
|---|---|
| ROE | — |
| ROI | — |
| ROIC | — |
| Profit margin | — |
| Growth | |
|---|---|
| Revenue growing | No |
| Profits growing | No |
| Revenue up 3y | No |
| Revenue up 5y | No |
| Earnings growth 3y (net profit CAGR) | — |
| Quality | |
|---|---|
| Profitable | No |
| Margin expanding | No |
| Buying back stock | No |
| Diluting (TTM) | Yes |
| Debt/Equity | 0.43% |
| Podcast bulls (TTM) | Sign up |
| Podcast bears (TTM) | Sign up |
| Podcast sentiment (TTM) | Sign up |
| Podcast sentiment % (TTM) | Sign up |
| News sentiment (TTM) | 0 |
| Quality score | -61.5% |
| Insiders | |
|---|---|
| Buys, 1w | Sign up |
| Buys, 1m | Sign up |
| Buys, 1y | Sign up |
| Sells, 1w | Sign up |
| Sells, 1m | Sign up |
| Sells, 1y | Sign up |
Sign up to see this company's insider trades
Filed figures
Lines the statements and their notes report beside the headline figures, read from the filings' XBRL as filed (no restatement applied), with figures computed from one filing's own lines. Cash-flow lines carry their cash direction: an outflow is negative. Each period links to its filing; a figure's period, report date and tag are in its tooltip.
| Figure | Dec 2018 | Dec 2019 | Dec 2020 | Dec 2021 | Dec 2022 | Dec 2023 | Dec 2024 | Dec 2025 |
|---|---|---|---|---|---|---|---|---|
| Balance sheet detail | ||||||||
| Trade receivables (CNY) | — | 8.3M | 17.7M | 18.9M | 7.02M | 20.2M | 18.5M | 17.1M |
| ↳ YoY growth | +6.8% | -62.9% | +188.2% | -8.4% | -7.4% | |||
| ↳ 5y CAGR | -0.7% | |||||||
| Borrowings, current (CNY) | — | 239M | — | 5.81M | 391M | 6.98B | 38.5M | 889M |
| Borrowings, non-current (CNY) | — | — | 512M | 935M | 1.34B | 246M | 1.12B | 472M |
| Lease liabilities (CNY) | — | 779M | 246M | 289M | 383M | 680M | 1.08B | 1.19B |
| Cash and deposits (CNY) | 95.2M | 1.3B | 1.37B | 4.37B | 5.58B | 12.9B | 9.03B | 8.11B |
| Intangible assets (CNY) | — | 674M | 105M | 118M | 121M | 122M | 125M | 170M |
| Right-of-use assets (CNY) | — | 510M | 196M | 323M | 513M | 837M | 1.14B | 1.3B |
| Net debt (borrowings + leases - cash) (CNY) | — | -278M | -6.82B | -3.14B | -3.47B | -4.96B | -6.79B | -5.56B |
| Cash flow detail | ||||||||
| Operating cash flow (CNY) | -1.35B | -1.79B | 481M | 1.31B | 1.07B | 7.14B | 2.18B | -1.23B |
| Purchases of property, plant and equipment (CNY) | -971M | -953M | -103M | -541M | -743M | -917M | -1.06B | -601M |
| Change in receivables (cash effect) (CNY) | — | -8.3M | -16.4M | -857,000 | 10.5M | -13.4M | 1.12M | 2.02M |
| Change in inventories (cash effect) (CNY) | 3.13M | -511M | -79.2M | -96M | -858M | -176M | -425M | -369M |
| Interest paid (cash effect) (CNY) | — | — | -613,000 | -10.2M | -12.7M | -5.84M | -13.2M | -20.4M |
| Income taxes paid (cash effect) (CNY) | — | — | — | 0.00 | -1.33M | -8.26M | -88.4M | -209M |
| Share-based compensation (USD) | — | — | 21.9M | 173M | 298M | 335M | 360M | 180M |
| Operating cash flow before change in receivables (CNY) | — | -1.79B | 498M | 1.31B | 1.06B | 7.15B | 2.18B | -1.23B |
| Free cash flow (OCF - PPE - intangibles) (CNY) | -2.32B | -2.75B | 378M | 768M | 327M | 6.22B | 1.12B | -1.83B |
| Income detail | ||||||||
| Research and development expense (CNY) | 794M | 1.17B | 169M | 516M | 983M | 1.49B | 1.52B | 1.62B |
| ↳ 5y CAGR | +57.2% | |||||||
| Total comprehensive income (CNY) | -1.52B | -2.44B | -180M | -132M | -102M | 1.66B | 1.11B | 69.5M |
| Comprehensive income to owners (CNY) | -1.52B | -2.44B | -180M | -132M | — | — | — | — |
| Provision for credit losses (CNY) | 0.00 | 0.00 | 0.00 | 1.01M | 422,000 | -152,000 | 173,000 | 275,000 |
| Credit cost ratio (credit losses / average receivables) (%) | — | — | 0.0% | 5.5% | 3.3% | 1.1% | 0.9% | 1.5% |
| Reported | Mar 10, 2021 | Mar 10, 2021 | Apr 21, 2023 | Apr 12, 2024 | Apr 12, 2024 | Apr 12, 2024 | Apr 10, 2025 | Apr 10, 2026 |
Operating KPIs — quarters
Business figures the company publishes beside its accounts (users, subscribers, same-store sales, production, occupancy ...), read from its results releases and reports, with the growth on the same period a year earlier beneath each: computed from the figures, and as the company states it where it does. Each figure links to its source; counts at a period end show under that period.
| KPI | Sep 24 | Dec 24 | Mar 25 | Jun 25 | Sep 25 | Dec 25 | Mar 26 | Jun 26 |
|---|---|---|---|---|---|---|---|---|
| Units shipped / sold | 41.3M | 42.6M | 24.7M | 28.9M | 25.9M | 27.3M | 21.5M | 24.1M |
| ↳ YoY growth | +22.9% | +5.6% | +1.8% | -4.7% | -37.4% | -36.1% | -12.7% | -16.7% |
| Reported | Oct 31, 2024 | May 29, 2025 | May 29, 2025 | Aug 28, 2025 | Nov 26, 2025 | May 28, 2026 | May 28, 2026 | Aug 26, 2026 |
Operating KPIs — years
Business figures the company publishes beside its accounts (users, subscribers, same-store sales, production, occupancy ...), read from its results releases and reports, with the growth on the same period a year earlier beneath each: computed from the figures, and as the company states it where it does. Each figure links to its source; counts at a period end show under that period.
Sign up to see institutional holdings
Sign UpPodcast Mentions
Sign up to see podcast mentions and sentiment
Sign UpAnnouncements and reports published on HKEXnews, newest first, monthly and next-day returns, proxy forms and board-meeting notices included. The link opens the announcement on HKEXnews. Material events reported to the SEC on Form 8-K or 6-K, newest first. The link opens the filing itself on EDGAR. Press releases from the company's own website, newest first.
Li Auto Inc. October 2026 Delivery Update November 1, 2026
Bull 1
Bear 0
Other
BEIJING, China, November 1, 2026 — Li Auto Inc. (“Li Auto” or the “Company”) (Nasdaq: LI; HKEX: 2015), a leader in China’s new energy vehicle market, today announced that it delivered 29,025 vehicles in October 2026. As of October 31, 2026, Li Auto’s cumulative deliveries reached 1,862,676.
In October, Li Auto delivered over 3,000 units of the new Li MEGA. The Company also introduced its proprietary Lianshan Battery and Lianshan Motor, along with the Lianshan Battery Warranty Program. The 2026 Li i6, launched on October 28, is equipped with the Lianshan Battery, the MACH M100 chip, and more than 20 additional upgrades in intelligence and configuration, enhancing its range, assisted driving capabilities, and riding experience. In November, Li Auto will begin rolling out OTA 9.2, featuring the upgraded MACH VLA 2.5 and multiple refined cockpit Agent features.
As of October 31, 2026, the Company had 481 retail stores in 159 cities, 527 servicing centers and Li Auto-authorized servicing shops operating in 217 cities. The Company also had 4,206 super charging stations in operation equipped with 23,163 charging stalls in China.
About Li Auto Inc.
Li Auto Inc.
VOLUNTARY ANNOUNCEMENT OCTOBER 2026 DELIVERY UPDATE
Bull 1
Bear 0
Other

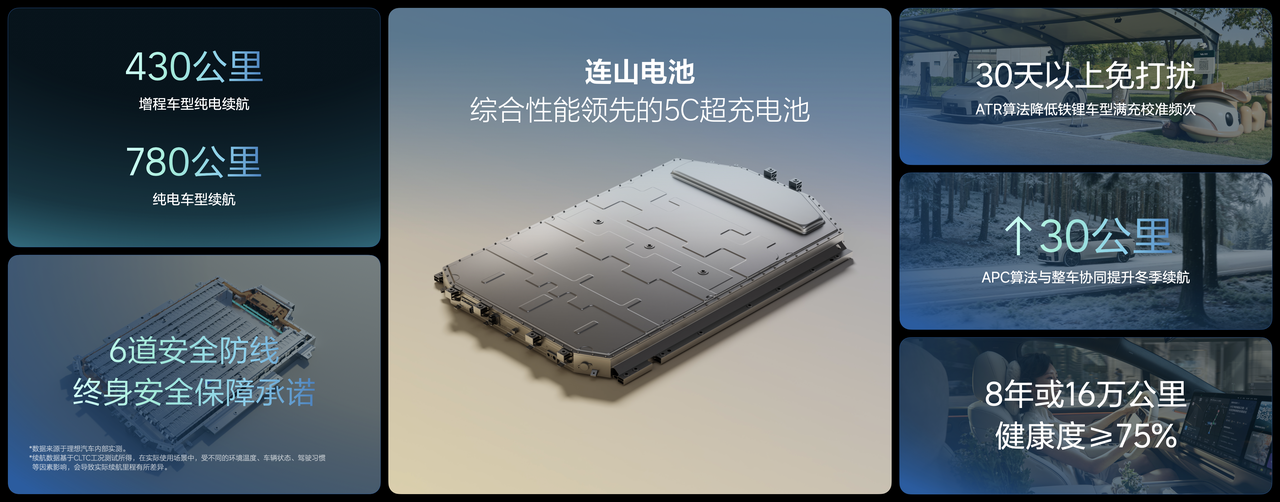
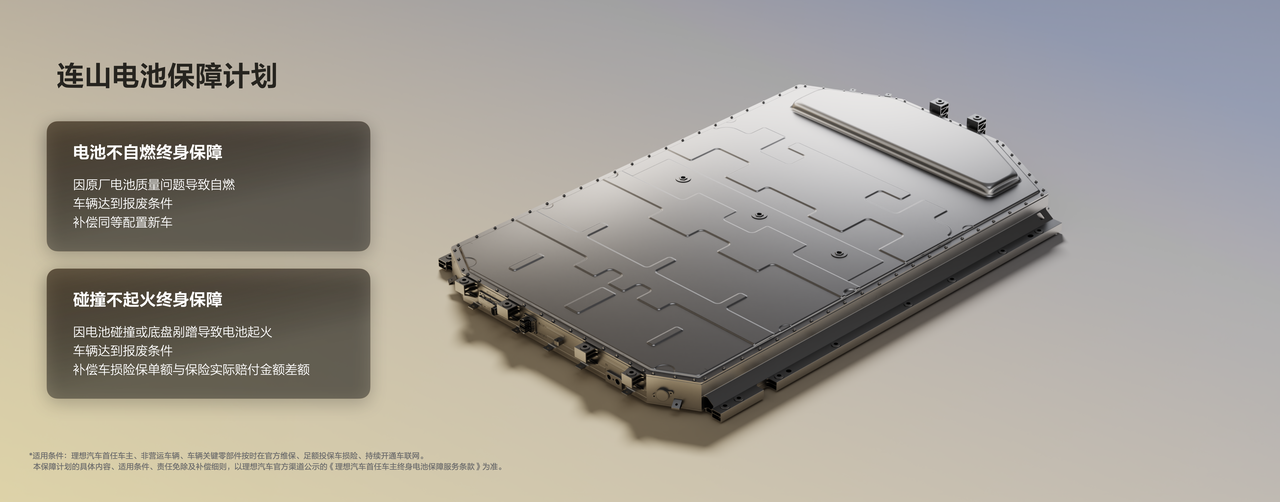
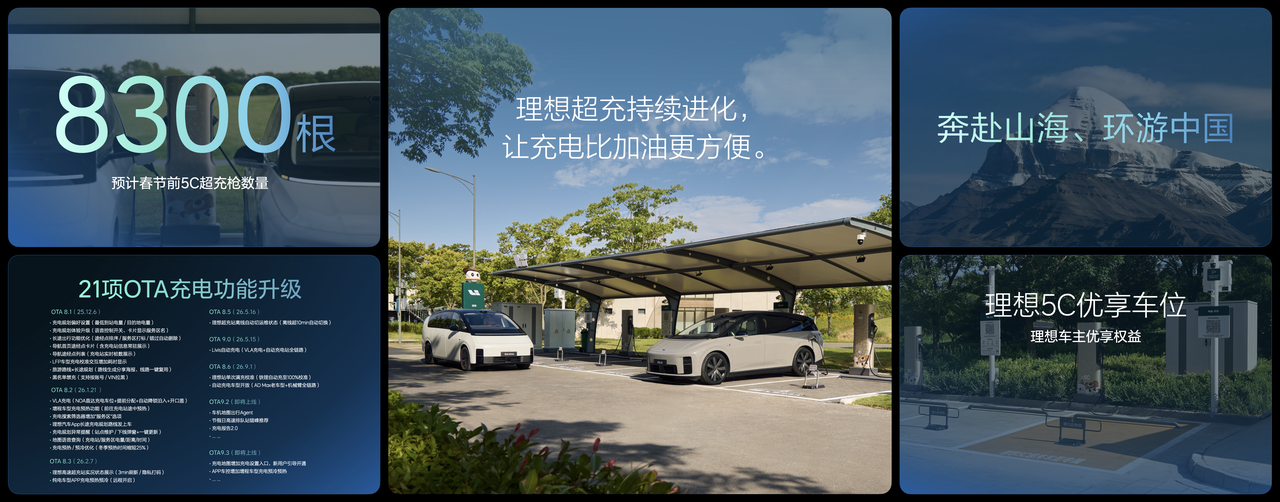 “连山”电动技术体系通过电池、电驱与超充网络的深度协同,持续提升纯电出行的补能效率、使用便利性与安全保障能力。理想汽车将继续从用户需求出发,深化电动技术创新,让复杂的技术转化为更高效、更省心、更安心的出行体验。

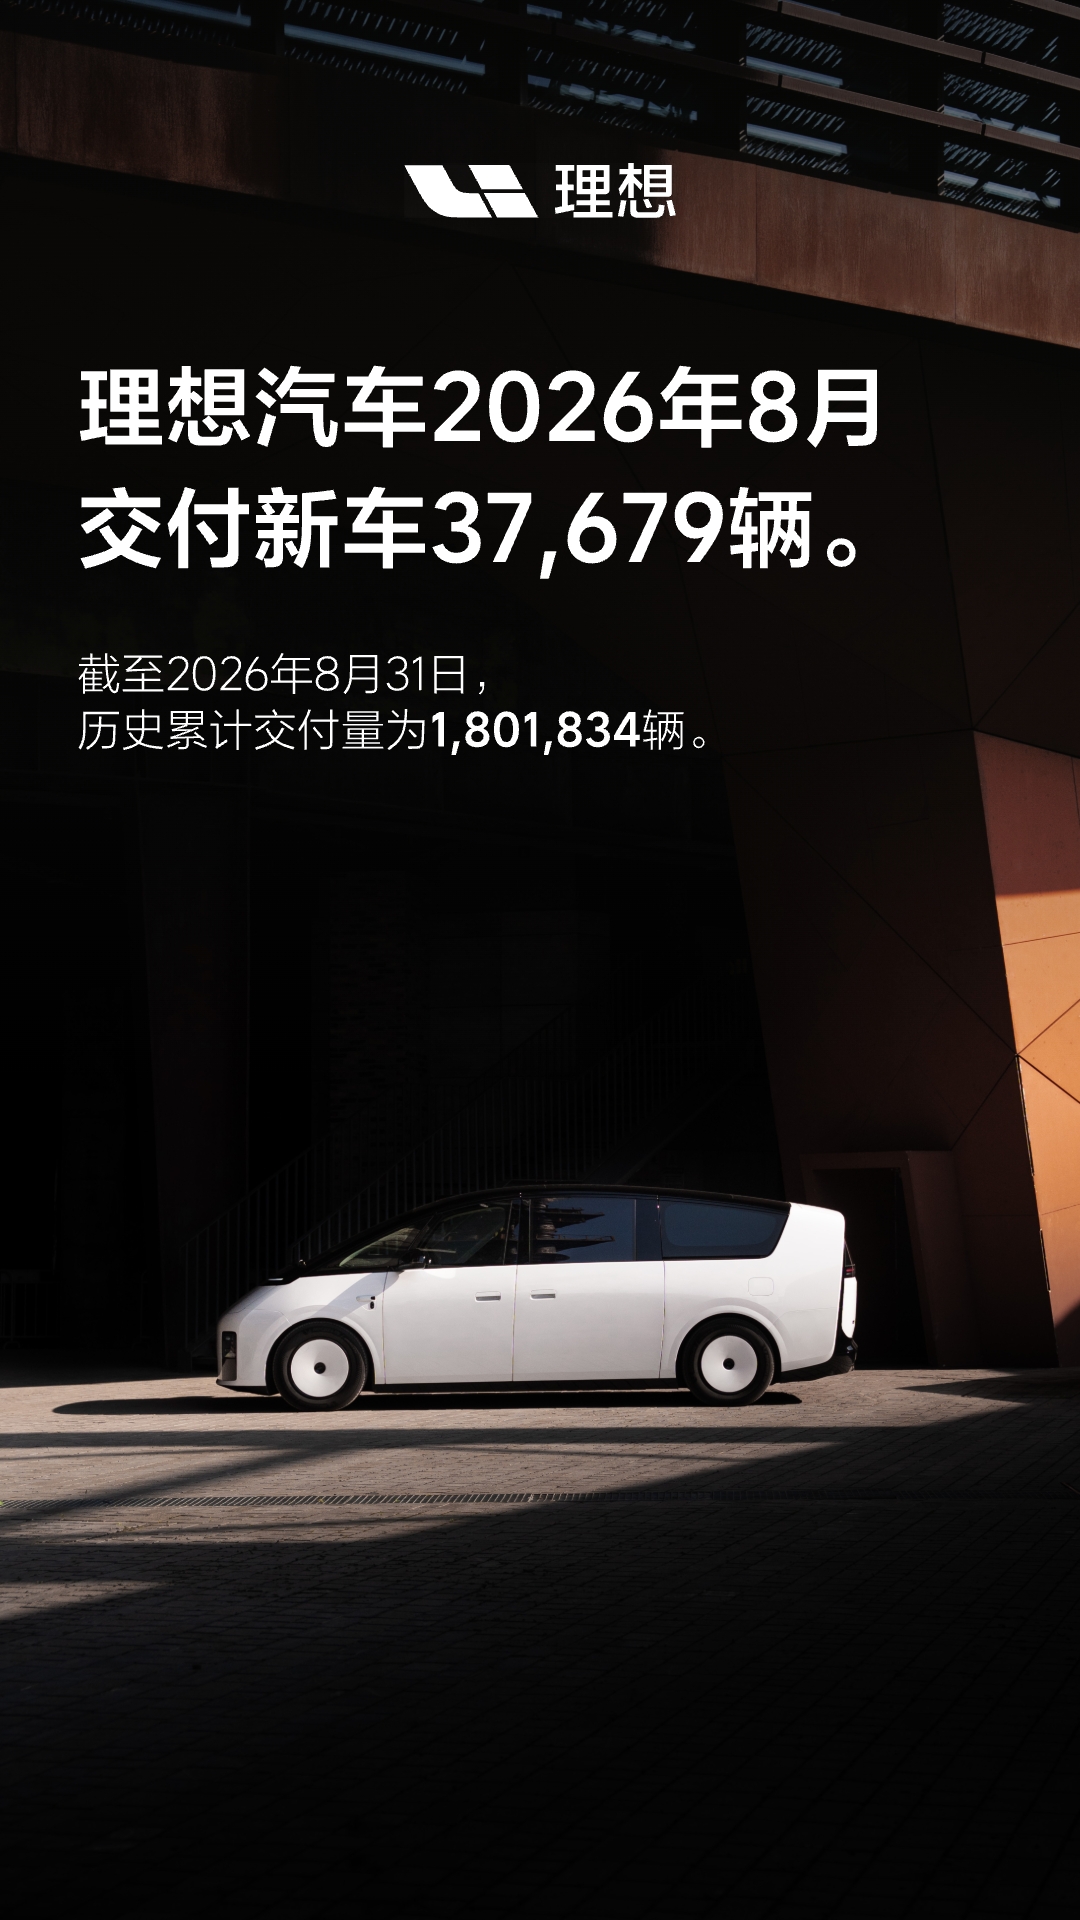

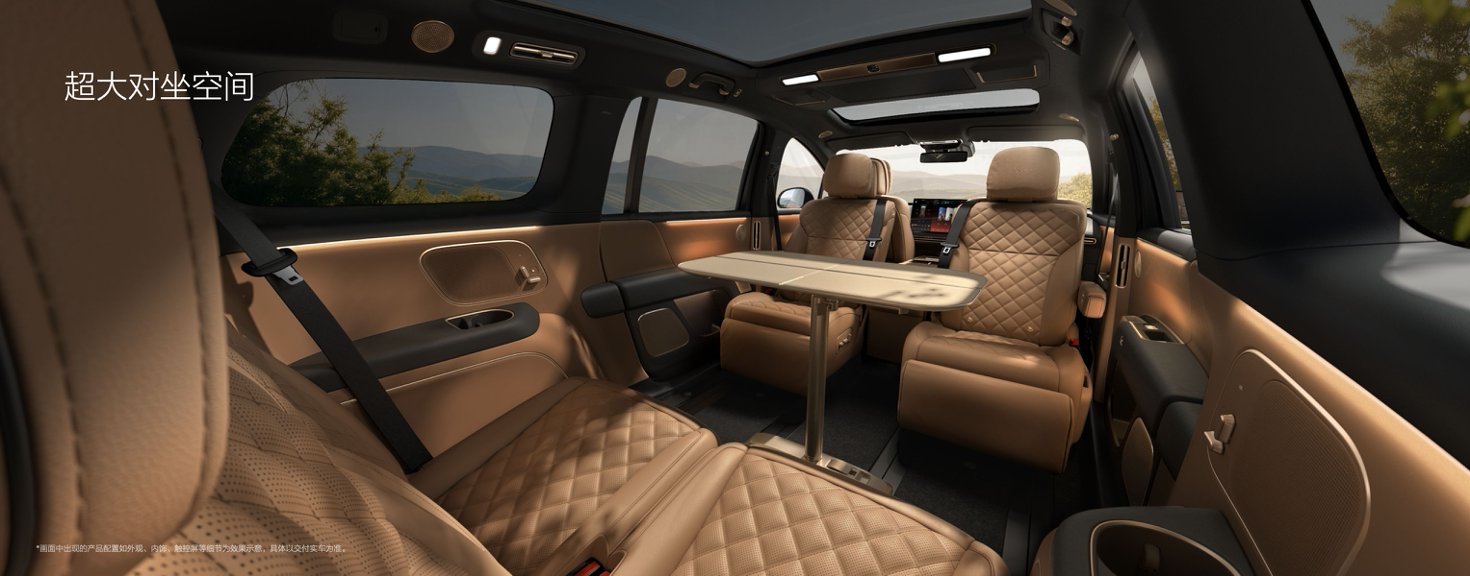
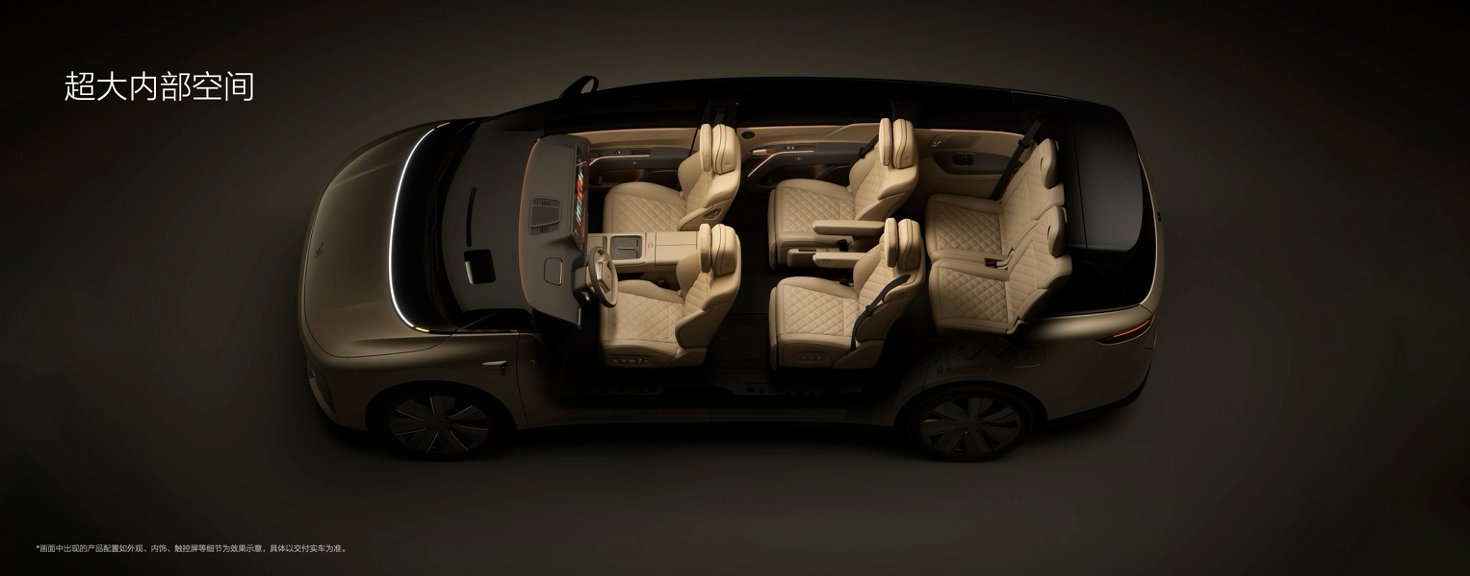
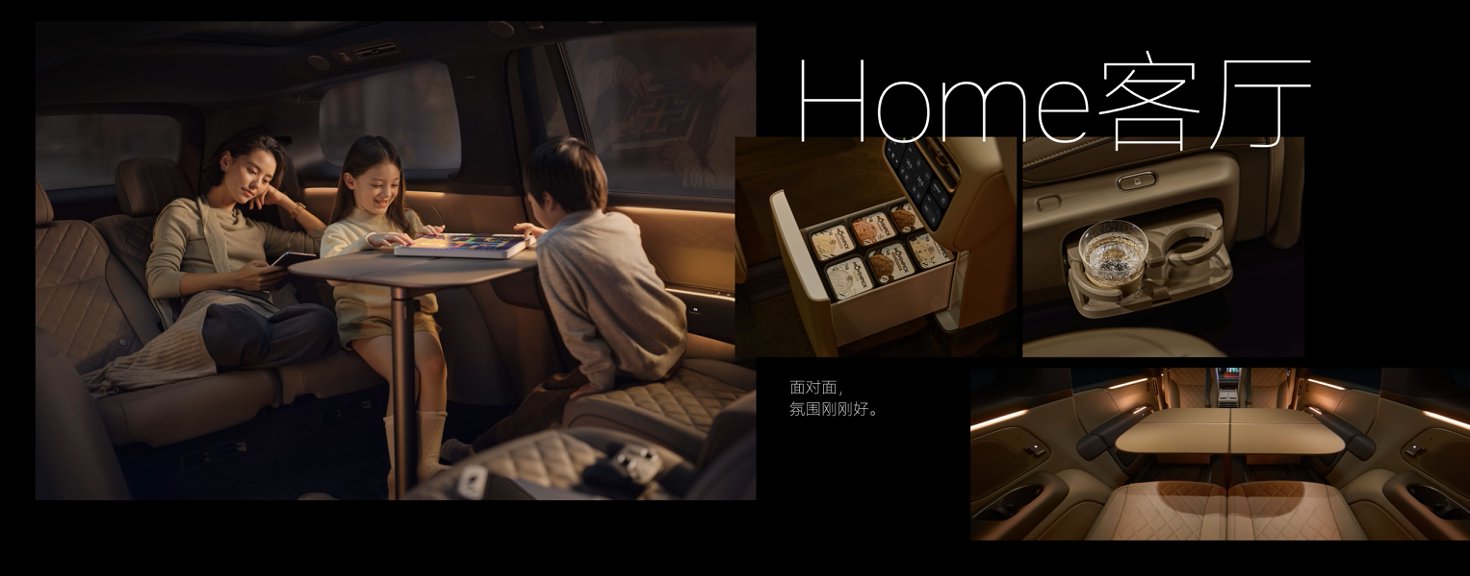

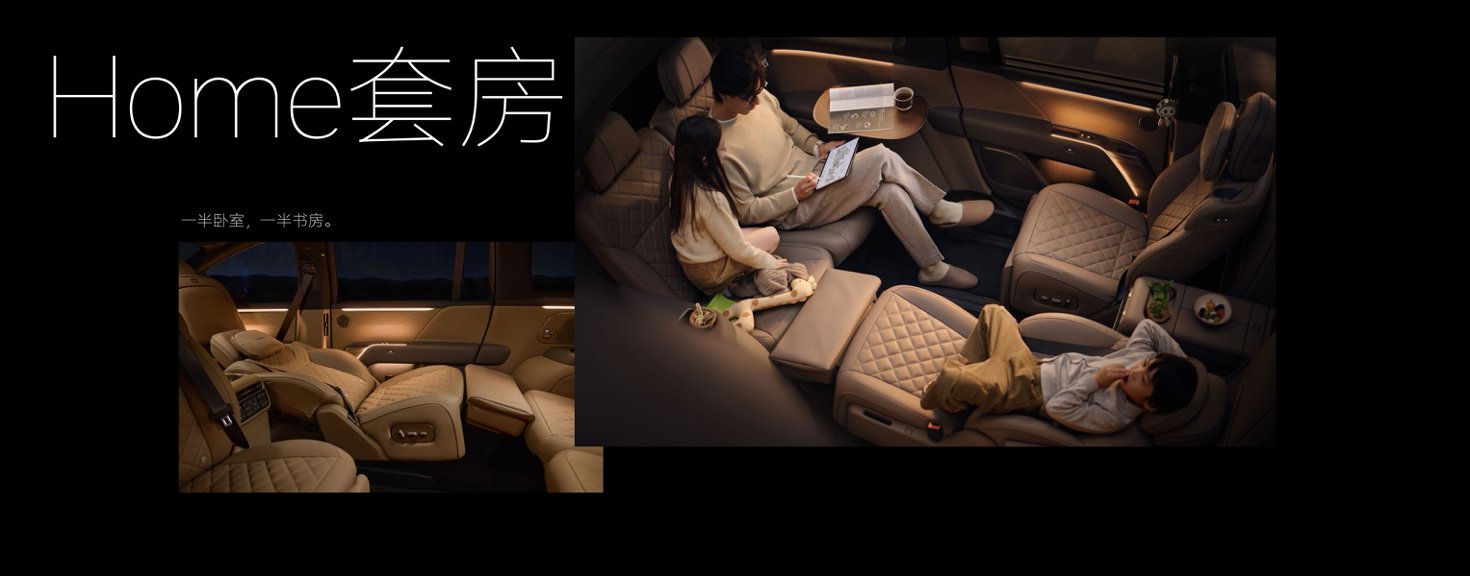
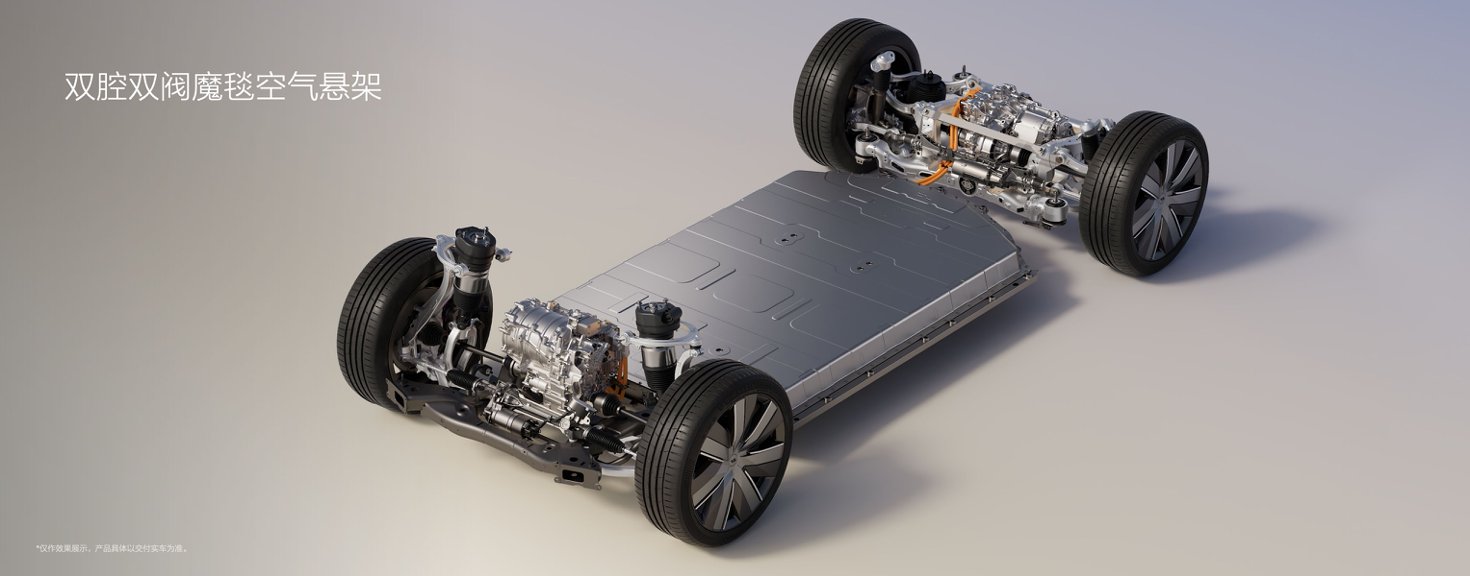
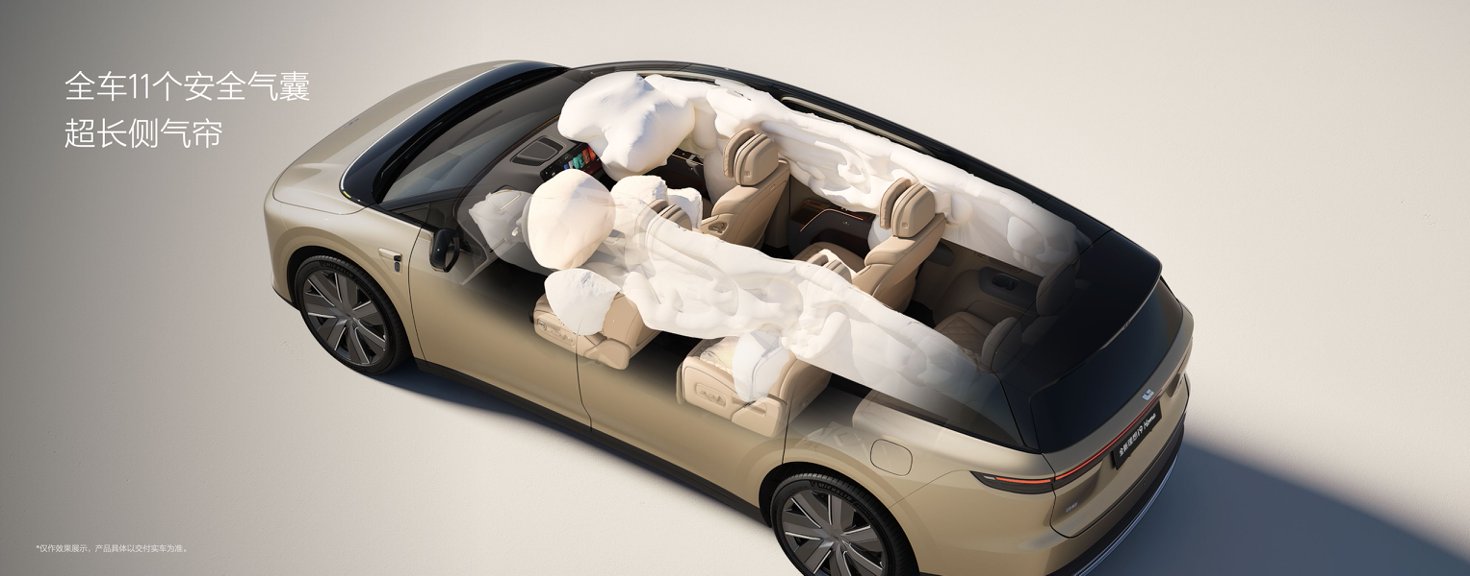
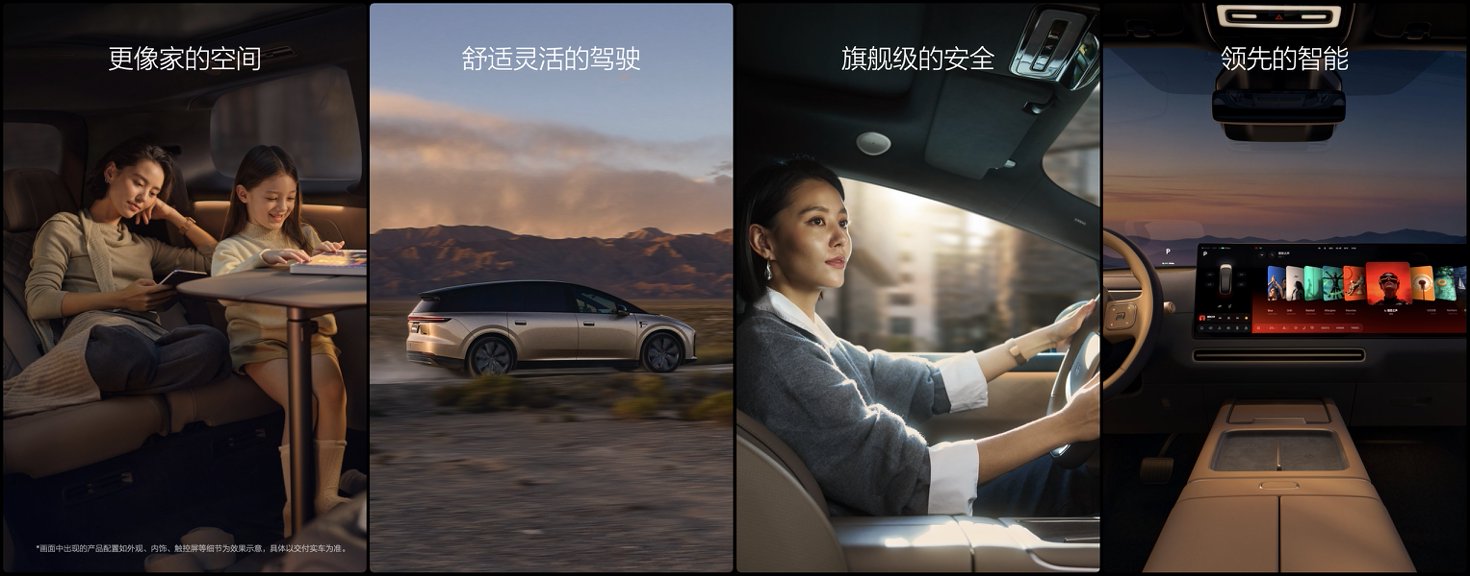
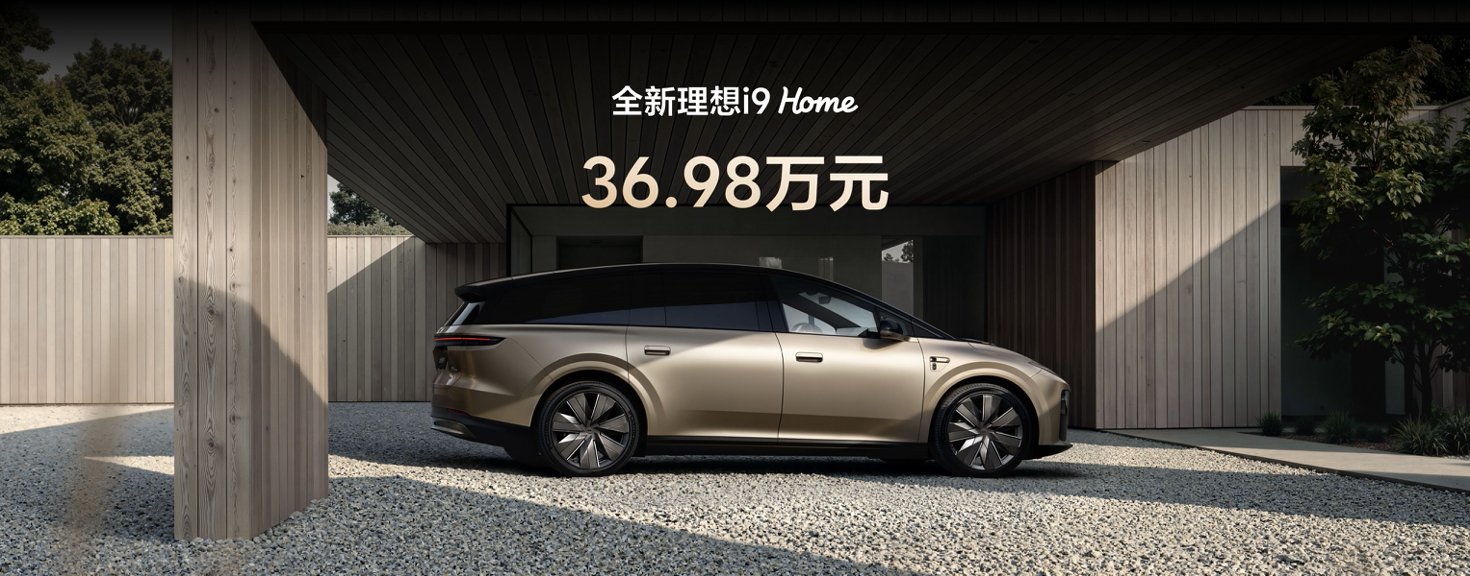


 理想汽车董事长兼CEO李想表示:“过去四年,我们自研800V主动悬架、全线控底盘、马赫M100芯片、5C增程系统,今年这四项自研技术全部上车。这不只是为了提车那一天的快乐,更是为了三年、五年之后,当别人的车开始过时,我们的车还在进化。这就是底层全栈自研给用户带来的真正不可替代的价值。全新理想L8,就是基于全新一代自研技术为五座旗舰用户交出的答卷。我们给它定了三个目标:顶级乘坐舒适与豪华,极致驾驶乐趣,行业天花板的智能。同时实现三个目标,没有妥协。”


Prompts
Click prompts to add them under the company line, click again to take one out, then copy the result into your AI chat. Shared by Asian Century Stocks and Uncovered Thai Stocks. Thank you.
LI Auto Inc. (ticker 2015), listed in Hong Kong.
Copied
ETFs Holding LI Auto Inc.
Exchange-traded funds whose newest published daily portfolio holds one of the company's listings, largest weight first.
| ETF | Weight in ETF | Shares | Market value | As of |
|---|---|---|---|---|
| CCSO | 1.38% | 49,932 | $ 576.715K | Nov 17, 2026 |
| LCTD | 0.30% | 22,589 | $ 945.73K | Nov 16, 2026 |
| ENHI | 0.13% | 662 | $ 27.716K | Nov 16, 2026 |
| IDYN | 0.10% | 2,559 | $ 107.137K | Nov 16, 2026 |
| DFEV | 0.09% | 326,600 | $ 1.947M | Nov 12, 2026 |
| AVEM | 0.07% | 1,489,735 | $ 17.206M | Nov 16, 2026 |
| AVSE | 0.06% | 10,625 | $ 122.719K | Nov 16, 2026 |
| DFSE | 0.05% | 52,600 | $ 313.535K | Nov 12, 2026 |
| IALT | 0.05% | 91,832 | $ 3.845M | Nov 16, 2026 |
| APIE | 0.04% | 34,046 | $ 411.957K | Aug 31, 2026 |
| DFEM | 0.03% | 486,100 | $ 2.898M | Nov 12, 2026 |
| FTLS short | -0.03% | -69,887 | $ 0.00 | Nov 16, 2026 |
| NTSE | 0.02% | 1,070 | $ 12.562K | Jun 30, 2026 |
| DFAX | 0.02% | 354,500 | $ 2.113M | Nov 12, 2026 |
| DFAE | 0.00% | 50,400 | $ 300.422K | Nov 12, 2026 |