200 years in hospitality. It's a passion. The story of how we got here goes back a long way. Play We are IHG 1777-1899 Our story starts in a brewery Click to open accordion At this time In a period when James Watt perfected the steam engine and…
200 years in hospitality.
It's a passion.
The story of how we got here goes back a long way.
Play
We are IHG
1777-1899
Our story starts in a brewery
Click to open accordion
At this time
In a period when James Watt perfected the steam engine and American independence was recognised, social change dominated the 19th Century. The first telephone call, the first light bulb and the abolishment of slavery soon followed, sweeping in a second industrial revolution that saw William Bass open his first brewery. As the railways opened, mobility and urbanisation exploded, enabling Bass to take his beer worldwide and become the world’s largest brewer by the end of the century.
1777
William Bass opens a brewery in Burton-on-Trent, UK
IHG®’s story starts here, as Bass begins a journey from local brewery to global hospitality player, acquiring what would become world-famous hotel brands along the way.

1875
Bass registers the UK’s first trademark
A pioneer in international brand marketing, Bass registers its Red Triangle under the UK's Trade Marks Registration Act 1875 – the first trademark in the UK.
The Act came into effect on 1 January 1876 and legend has it that a Bass employee queued overnight outside the registrar's office on New Year's Eve in order to be the first in line to register. As a result, Bass received the first two registrations, the Bass Red Triangle for their pale ale and a Bass Red Diamond for their strong ale.

1900-1949
Luxury takes flight with InterContinental
Click to open accordion
At this time
The 20th-century began without cars, planes, TVs and computers, but that was all to change. Breakthrough inventions transformed lives, including the first flight by the Wright brothers, Henry Ford's first Model-T, and Albert Einstein's Theory of Relativity. Propelled by the continuing popularity of rail, the emergence of the automobile, and the first jet air flights, travel grew and sparked innovation in hospitality.
1935
Bass is listed on the London Stock Exchange's FT30
The FT30 Index is the oldest of the indices, and was created to track the UK’s top 30 companies. It was replaced in 1984 with the FTSE100, where IHG is listed today.

1946
Hospitality begins to take flight
Pan American Airways founder, Juan Trippe, founds the InterContinental® brand, embarking on a vision to provide luxury accommodation at the end of every flight.

1949
The first InterContinental hotel opens in Belem, Brazil
Almost 50 years before the InterContinental brand becomes part of the IHG family - the brand is born.

1950-1959
Holiday Inn changes family travel forever
Click to open accordion
At this time
The 1950s are remembered as a prosperous time of recovery from the Great Depression and the war years. A time of looking forward and optimism, of new heroes like Elvis Presley, Marilyn Monroe and Grace Kelly. The first commercial air flights from London to Johannesburg and Colombo signaled the dawn of the jet age, heralding the start of the modern tourism industry. Holiday club destinations arrived on the scene, a precursor for today’s all-inclusive resorts.
1952
Holiday Inn opens its doors in Memphis, Tennessee
On a family trip to Washington DC, businessman Kemmons Wilson has the idea of providing travelling families with comfortable and affordable accommodation they could trust.
Starting in Memphis, his vision would become a reality in a big way.

1954
Holiday Inn is the first hotel brand to franchise
Pioneering a new business concept, franchising was adopted as a strategy to expand the Holiday Inn® brand. And it worked, with worldwide growth just around the corner.

1955
InterContinental - home to the world famous
Grace Kelly meets Prince Rainier III of Monaco in the foyer of the InterContinental® Carlton Cannes, during the Cannes Film Festival. The couple would soon marry and the hotel names a suite after her.

1956
Holiday Inn – the world's largest hotel brand
The now famous brand becomes the first hotel company to reach 300,000 rooms.

1960-1969
As the sixties swing, Bass booms
Click to open accordion
At this time
The swinging sixties. An era defined by a counterculture revolution of social norms that swept away the calm and predictable feel of the late 1950s. As traditional taboos relaxed, the demand for greater individual freedoms increased. As worldwide GDP grew, driven by the proliferation of new domestic technology and expanding middle classes, prosperity boomed.
1961
Bass acquires pubs owner Mitchells & Butlers
The first of many acquisitions for Bass during the 1960s of well-known regional pub and brewing companies across the UK.

1963
InterContinental and Martin Luther King
Sat in his suite at InterContinental® The Willard Hotel, Martin Luther King puts the finishing touches to his now famous ‘I have a dream’ speech on the night before the pivotal Washington civil rights rally.
Press release

1965
Holiday Inn launches Holidex, the world’s first computerised hotel reservation system
Kemmons Wilson’s pioneering spirit continues as Holiday Inn launches Holidex®, the world’s first electronic reservation system. Booking a room would never be the same again.

1967
Bass merges with Charrington United Breweries
Bass becomes one of the largest brewers and pub owners in the UK.

1970-1979
From Memphis to Kyoto, Holiday Inn goes global
Click to open accordion
At this time
The 1970s was defined as a "pivot of change". Economic upheavals and recession end the postwar economic boom and modern computing is born, with the world's first microprocessor and email. Social progressive values such as increasing political awareness and the economic liberty of women grew, and technology was brought to life through microwave ovens, VCRs, and cell phones.
1972
‘The Nation’s Innkeeper’ becomes ‘The World's Innkeeper’
With its eye-catching roadside sign - a familiar sight on US highways and its most successful form of advertising, Holiday Inn edges towards worldwide domination, opening a new hotel every three days.

1975
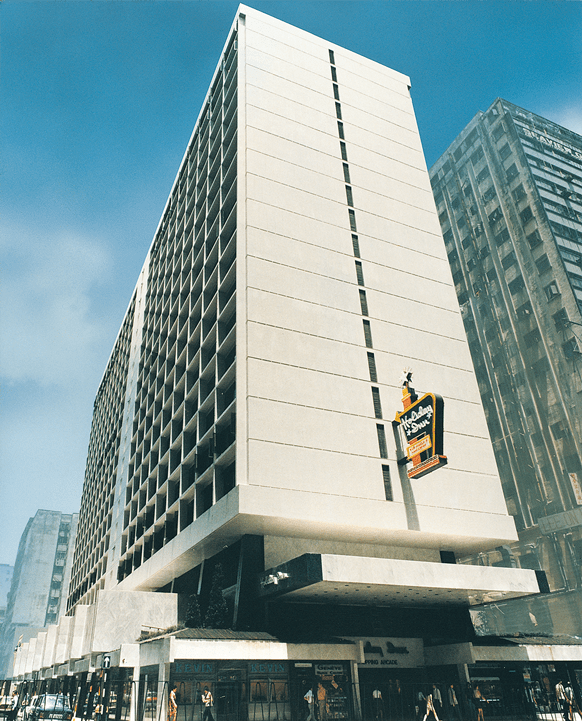
A new journey in Greater China
Holiday Inn Golden Mile Hong Kong marks IHG’s debut in Greater China.
1977
Holiday Inn connects the industry and transforms the way we book
Holidex becomes the first hotel reservation system to link directly with airline and travel agents systems - bringing together the full power of the travel industry.

1980-1989
Boutique is born
Click to open accordion
At this time
The decade saw tremendous population growth worldwide, increasingly sophisticated technology and growing individual empowerment. The Internet took shape as Tim Berners Lee formalised the concept of the World Wide Web, video games became a major industry, and the boom box and Walkman had a profound impact on youth culture.
1981
Boutique is born with Kimpton Hotels & Restaurants
Decades before Kimpton joins forces with IHG, Bill Kimpton founds a different kind of hotel experience. Inspired by his European travels and a desire for a more bespoke stay, his idea was simple – a stay that was more beautiful, liveable and stylish. The idea caught on.

1983
Holiday Inn gives business travellers Crowne Plaza
The first Crowne Plaza® in Rockville, Maryland, brought a new style of service and facilities for guests travelling on business.

Industry's first loyalty programme arrives
Priority Club Rewards, the industry’s first loyalty programme, is launched by Holiday Inn, rewarding guests every time they stay.

1984
Holiday Inn is the first international hotel brand in mainland China
The Holiday Inn® Lido opens in Beijing, bringing international branded hotels to Greater China for the first time.

1988
Bass makes its move into the hotel industry
The acquisition of Holiday Inn International (excluding North America) represented the first significant step by Bass to gain a foothold in the hospitality industry.

1989
Bass cranks up its focus on hotels
New British legislation limits the number of tied pubs major brewers can own, heralding a new direction for Bass as it reduces its pub estate and increases investment in hotels.

1990-1999
Holiday Inn Express arrives as Bass chooses hotels
Click to open accordion
At this time
Prosperity reigned, with steady economic growth for much of the decade characterised by the rise of multiculturalism and alternative media. Movements such as grunge, rave and hip hop spread around the world, influenced by Generation X, Generation Y and the Millennials. Youth culture embraced environmentalism and entrepreneurship with increased individuality. By now, Internet access was available in more than 50% of some Western countries, its use revolutionising travel services and transforming tourism and hospitality into big business.
1990
Bass takes full control of Holiday Inn; Holiday Inn Express joins the party
Bass buys the remaining North American part of the Holiday Inn business and, owning the world-famous brand entirely, sets its sights on expansion.
Its first move is to launch Holiday Inn Express® , aimed at smart travellers with a new service style.

1994
Bass expands in hospitality with new pubs and restaurants
Reflecting a fast-growing appetite for casual dining, Bass buys the Harvester and Browns restaurant chains, and opens its first O'Neill's and All Bar One pubs.

1995
Candlewood Suites, the home from home hotel, arrives
Years before it becomes part of the IHG family, Jack DeBoer founds the extended stay concept with the launch of his Candlewood Suites® brand, introducing free guest laundry and a 24hr locker for the first time.

An online revolution
Holiday Inn takes the world’s first hotel booking over the internet.

1997
Bass sells its leased pubs and smaller businesses
Bass renews its focus on hotels and pubs after the British Government blocks its attempt to acquire half of the Carlsberg-Tetley brewing business.
The business splits into separate brewing and retailing divisions, and sells off its leased pubs and other businesses, including Gala bingo and Coral bookmakers.

Bass launches Staybridge Suites
Bass launches Staybridge Suites® by Holiday Inn across North America, looking after travellers spending long periods away from home.
At the same time, Bass sells its North American midscale hotel buildings but retains control of their branding through innovative franchise agreements.

1998
Bass adds InterContinental to its growing hotel portfolio
Bass buys the InterContinental Hotels & Resorts brand, and takes Juan Trippe’s vision worldwide.

2000-2009
Bass says goodbye to beer, IHG is born
Click to open accordion
At this time
The new millennium was met with confidence and optimism around the world, and marked by a new focus. Following long term growth, energy resources started diminishing and global warming properly hits the world agenda. The Internet became a mainstay, driving faster communications through mobile phones, e-mail and social networking sites. The decade ends with a crisis in housing credit in the US, which sparks a major global financial recession.
2000
Bass swaps beer for hotels
Bass acquires Southern Pacific Hotels Corporation in Australia and US-based hotel management company, Bristol Hotels & Resorts Inc.
Meanwhile Bass’s brewing operations, and the name Bass, are bought by Interbrew (now AB InBev). The deal re-shaped the UK’s brewing industry and paved the way for the conglomerate to refocus its sights on hotels and global hospitality.

2001
Bass gets a new name: Six Continents plc
Emphasising the company’s global spread, the name was chosen after more than 10,000 staff submitted suggestions, and was already in use as the name of Bass's Inter-Continental hotels loyalty scheme.

Six Continents sells almost 1,000 pubs and buys the European Posthouse chain of hotels
Most of the Posthouse chain of hotels are converted into Holiday Inn branded properties, massively boosting the brand’s reach.

2003
IHG is born
Six Continents plc splits into two, creating a separate hotels and soft drinks company named InterContinental Hotels Group plc (IHG), and a retail business called Mitchells & Butlers plc. The split completes in April 2003 and IHG becomes a standalone company.

IHG acquires Candlewood Suites
Complementing its Staybridge Suites extended stay brand, the addition of Candlewood Suites gives IHG a big presence in the US.

2004
IHG launches boutique brand Hotel Indigo
The first of many Hotel Indigo® properties designed to reflect their surroundings so that no two are ever alike, IHG’s Hotel Indigo brand starts life in the eclectic arts and entertainment district of Midtown Atlanta, US.

2005
IHG becomes a dedicated hospitality business
IHG sells its holding in Britvic plc, the soft drinks business, and focuses on its leadership in worldwide hospitality.

2006
IHG Academy launches, building skills in True Hospitality
A pioneering collaboration between hotels, schools and communities across the globe begins, helping local people develop hospitality skills. Initially launched in China, IHG Academies are now all over the world, helping thousands.
More on IHG® Academy

2007
A new brand for Holiday Inn and a $1bn refresh
Holiday Inn Resort® is launched as a destination for family fun and relaxation, and IHG announces a $1 billion refresh of the Holiday Inn brand family, the industry’s biggest ever investment.

2008
Holiday Inn Club Vacations arrives
Created in an alliance with Orange Lake Resorts and Holiday Inn founder Kemmons Wilson, Holiday Inn Club Vacations® completes the Holiday Inn Brand Family.
Press release

Staybridge Suites goes global
Following the success of Staybridge Suites in North America, IHG opens ground-breaking properties in Liverpool, UK and Cairo, Egypt.
Press release

2009
IHG starts to build sustainable hotels with IHG Green Engage
IHG’s Green Engage™ system launches, helping hotels globally to measure, monitor, manage and report on energy, carbon, water and waste.

2010-2019
New brands. New fans. IHG defines True Hospitality
Click to open accordion
At this time
The 2010s began amidst a global financial crisis, and the decade is characterised by economic and political upheaval. China replaced the US as the world's largest trading nation, and politics increasingly polarises as governments grapple with a far wider range of social, economic and environmental issues. In the home, the baby boomers generation approached retirement, increasing the ageing population, and rapidly developing technology changes how we all work and live.
2010
IHG is the first to offer a booking app across all platforms
Connecting guests with hotels all over the world, wherever they are.

2011
IHG Shelter in a Storm programme launches
Equipping hotels to respond quickly and effectively in times of disaster, IHG Shelter in a Storm provides vital assistance and shelter to employees and communities.

2012
IHG launches EVEN Hotels brand
Launched in the US, EVEN® Hotels is built on growing demand for a hotel brand that helps wellness-minded travellers maintain their balance on the road.
News release

IHG unveils HUALUXE Hotels and Resorts in China
With HUALUXE® translating from Hua, which means majestic China, and luxe representing luxury, IHG introduces the first international hotel brand designed specifically for Chinese guests.
News release

IHG - home to the 2012 Olympics
Welcoming athletes and spectators from all over the world, Holiday Inn and Holiday Inn Express serve as official hotel services providers to the London 2012 Olympic and Paralympic Games.
News release

2013
IHG Rewards Club brings new benefits to guests
Priority Club Rewards, now the industry’s largest and oldest loyalty programme, is relaunched as IHG® Rewards Club. Bigger and better, it includes free internet access across all hotels globally – an industry first.
News release

2015
IHG buys Kimpton Hotels & Restaurants
Now a famous brand in the US with a cult following, IHG buys the Kimpton® brand with the aim of sharing it with the world. Announced in 2014, the deal completes in January 2015.
News release

IHG opens 5,000th hotel
Cementing its position as a world leader in hospitality, IHG reaches a milestone with the opening of its 5,000th hotel - the Hotel Indigo® Lower East Side in New York City.
News release

2016
IHG Foundation launches to make the world a more hospitable place
IHG creates the IHG® Foundation, an independent charity incorporating IHG Shelter in a Storm. The IHG Foundation increases its agenda to include local community investment and environmental sustainability.

2017
IHG extends mainstream leadership with launch of avid hotels
Redefining every day travel for millions of Americans, avid™ hotels introduces a fresh, new high-quality midscale hotel brand to IHG’s portfolio.
News release

Roll out starts of next generation guest booking system – IHG Concerto
50 years on from introducing Holidex, IHG begins roll-out of its cloud-based hotel platform, IHG Concerto™, which includes its next generation Guest Reservation System. A game-changer for the industry.
News release

2018
Regent Hotels & Resorts joins the IHG family
IHG buys a 51% stake in the Regent Hotels & Resorts brand, securing a strong presence at the top end of the luxury segment.
News release

IHG takes leading position in UK luxury market
IHG agrees a deal to rebrand and operate 13 outstanding UK hotels, bringing Kimpton to the market for the first time and making IHG the UK's leading luxury hotelier.
News release

IHG launches new upscale brand, voco
Combining the informality and charm of an individual hotel, with the quality and reassurance of a global and trusted brand, IHG strengthens its offer in the fast-growing upscale segment with the launch of voco™ hotels.
News release

IHG launches True Hospitality for Good
IHG’s programme for communities and charitable giving works with partners to help change lives for the better through building skills and education in hospitality, and supporting communities when disasters strike. Giving for Good month, which is a part of True Hospitality for Good, provides thousands of IHG colleagues worldwide with a chance to give back to others.
More on True Hospitality for Good

2019
IHG acquires top tier luxury brand Six Senses Hotels Resorts Spas
IHG significantly strengthens its luxury offer with the acquisition of Six Senses Hotels Resorts Spas, one of the world’s leading operators of luxury hotels. The $300 million cash acquisition included Six Senses’ spa operations, which are core to the brand’s award-winning luxury and wellness reputation.
News release

IHG launches Atwell Suites in the US market
A new upper-midscale, all-suites hotel brand is brought to market in an underserved $18 billion industry segment, with a focus on delivering stylish suites and a stay that can flex for guests wishing to work, socialise and explore.
News release

IHG signals the end of an era for mini bathroom toiletries
IHG is the first global hotel company to announce its switch from bathroom miniatures to larger-size amenities in a bid to reduce single-use plastic waste. The commitment will roll out across IHG’s entire estate, removing an estimated 200 million tiny bottles of shampoo, conditioner, bodywash and lotion per year.
News release

2020-Present
6,000 hotels, loyalty transformed and a new plan to protect the planet
Click to open accordion
At this time
The 2020s begin with the Covid-19 global pandemic claiming millions of lives and changing life as we know it. Border closures and lockdowns result in governments propping up rapidly shrinking economies, while traditional norms of social interaction are challenged, and remote working proliferates. The development of vaccines saves lives, but it takes time to bring the pandemic under control. Social movements against inequity and injustice gather momentum, alongside other pressing agendas such as the growing need to collectively tackle climate change.
2020
IHG focuses on providing True Hospitality for Good
Underlining a commitment to doing the right thing, IHG evolves its purpose from True Hospitality for Everyone to True Hospitality for Good, focused on making a positive difference every day to our people, guests, owners and communities, and to protect the world around us.

2021
IHG becomes IHG Hotels & Resorts
To showcase a rapidly growing family of trusted brands to a new generation, IHG becomes IHG Hotels & Resorts, with bold new branding and logo and its broad portfolio grouped into four easy-to-navigate collections – Luxury & Lifestyle, Premium, Essentials and Suites – while IHG Rewards Club becomes IHG Rewards.

IHG embarks on a Journey to Tomorrow
IHG launches Journey to Tomorrow, an ambitious 10-year responsible business action plan with science-led targets tied to the UN Sustainable Development Goals. Clear commitments to help bring meaningful change include reducing carbon emissions, water usage and waste in IHG’s hotels, continuing to build an equitable and inclusive culture, and improving the lives of 30 million people around the world.

IHG launches Vignette Collection™
Offering guests more opportunities for one-of-a-kind luxury stays, as well as providing owners of world-class independent hotels the chance to quickly gain access to the many benefits of being part of the IHG family, the new collection brand sees its first properties open in Australia and Thailand.

IHG joins the Race to Zero
Updating its science-based target in line with the Paris agreement to limit global warming to 1.5°C, IHG joins the UN’s Race to Zero – the global campaign to rally leadership and support from businesses, cities and investors for a healthy, resilient, zero carbon future.

IHG Academy launches its Skills Builder platform
Making an important step in how our IHG Academy helps our young people gain employment and life skills, the Skills Builder is a new digital learning platform that enables IHG to team up with hospitality schools, NGOs and other partners to support hundreds of thousands of people over the next decade who are currently facing barriers to education and training.

Holiday Inn Express reaches 3,000 hotels
In the year of its 30th birthday, our world-famous Holiday Inn Express brand underlines its industry-leading position in the upper midscale segment by reaching 3,000 hotels.

2022
IHG One Rewards takes loyalty to the next level
IHG Rewards becomes IHG One Rewards, allowing guests to earn more points, more quickly than ever before and gain access to even more benefits. Representing one of IHG’s biggest-ever investments, it’s powered by the new IHG One Rewards app to provide members with a more intuitive, personalised and streamlined booking experience.

IHG opens 6,000th Hotel
IHG reaches 6,000 open hotels across the globe, with CEO Keith Barr, members of the Executive Committee and local hotel colleagues marking the milestone by ringing the bell at the New York Stock Exchange.

IHG and Iberostar sign a strategic alliance
Through the strategic alliance, Iberostar retain 100% ownership, preserving its autonomy and values. Up to 70 hotels (24.3k rooms) are being added to IHG’s system under the Iberostar Beachfront Resorts brand, which became the 18th brand for IHG.

2023
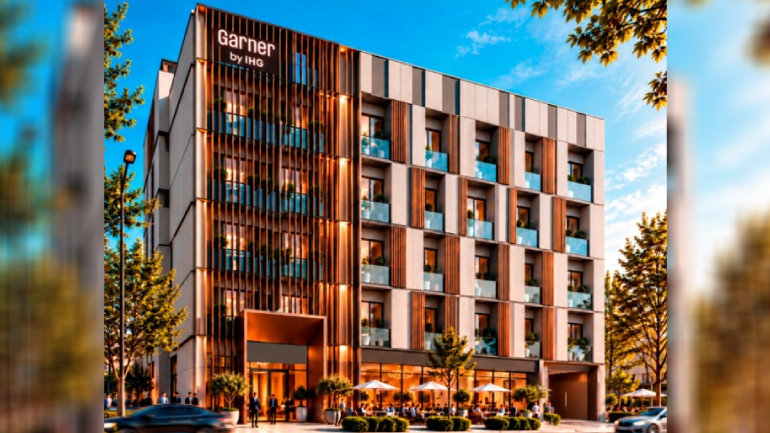
IHG launches Garner hotels, new midscale conversion brand
With a promise to deliver ‘easy going stays that get you on your way,’ Garner is designed for value-driven travellers of all ages who want a reliable and relaxed experience.

2024
IHG launches Low Carbon Pioneers programme
The industry first programme brings together energy efficient hotels that have no fossil fuels combusted on-site* and are backed by renewable energy.
* Except for backup generators that fall below 5% of the hotel’s total annual energy consumption.

IHG and Action Against Hunger sign Masterbrand partnership
IHG partners with Action Against Hunger in support of its invaluable work to combat food insecurity and hunger for millions of people around the world.

2025
IHG celebrates 50 years in Greater China
50 years after the first hotel opened in Hong Kong, IHG now has over 800 open hotels in the region.

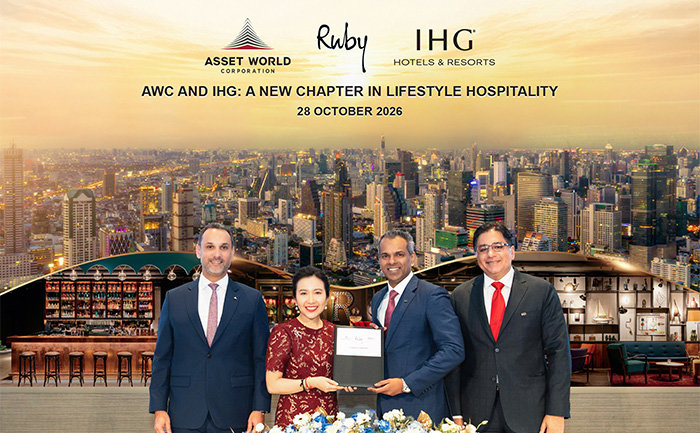
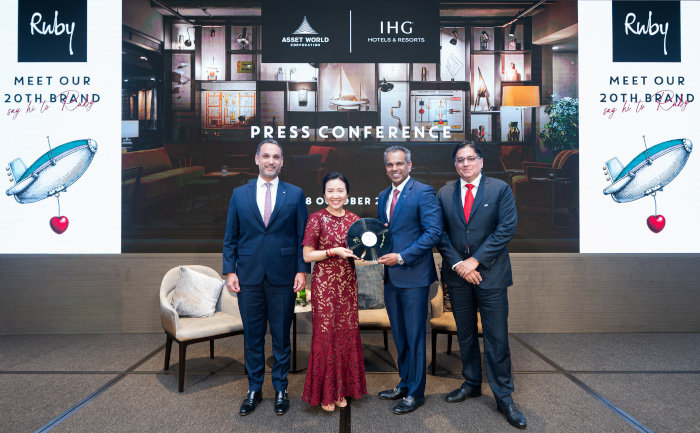
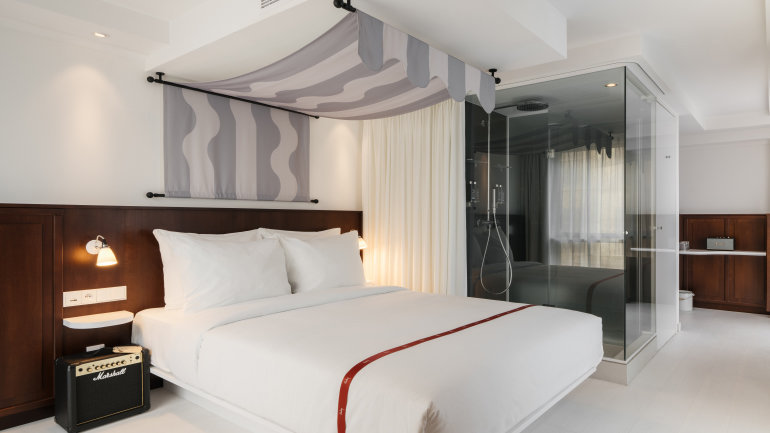
IHG acquires 20th brand, Ruby
Ruby hotels offer a ‘lean luxury’ approach, which delivers stylish yet relaxed charm, blending soulful design and authentic stories rooted in the cities they call home.

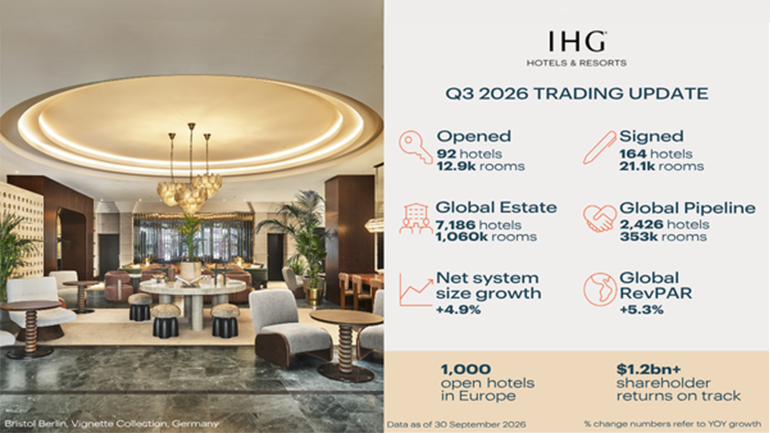
IHG reaches one million open rooms
IHG reaches one million rooms open, celebrating the impact True Hospitality for Good has through delivering millions of special moments to guests across the globe.

2026
IHG unveils new brand, Noted Collection
Designed to elevate the performance of high‑quality, distinctive hotels while offering guests more outstanding choice in inspiring destinations worldwide, Noted Collection is a premium brand defined by thoughtfully curated properties, each celebrated for its distinct point of view and the experiences it brings to life.


Guests
Business
Connect
© InterContinental Hotels Group 2026
Site Cookies We use cookies to improve your experience, to remember log-in details, provide secure log-in, and to optimize site functionality and deliver content tailored to your interests.
View Settings Accept Cookies