23 Oct 2026 6 minute read Thank you, Ross. And thank you to all our shareholders joining us here in Sydney and online around the world. This is my first AGM as Chief Executive Officer, and it is a privilege to stand before you in that capacity. I…
23 Oct 2026
6 minute read
Thank you, Ross.
And thank you to all our shareholders joining us here in Sydney and online around the world.
This is my first AGM as Chief Executive Officer, and it is a privilege to stand before you in that capacity.
I have spent more than 25 years with BHP. I have worked across many parts of our business, in different commodities, different countries and different stages of the cycle.
Throughout that time, one thing has remained constant: BHP has always been at its best when we combine great assets with great people and clear priorities.
I take on this role with deep respect for the history of this company and with great optimism for its future.
Before I go any further, I want to add to Ross’ acknowledgement of Mike Henry.
Mike left us a company in excellent shape.
But beyond that, I also want to thank Mike for his generosity and time as I moved into the CEO role. His support has ensured a smooth transition, and I have benefited greatly from his advice and experience.
I am honoured to serve as your Chief Executive, and I look forward to creating value for you in the years ahead.
Safety
My first priority is safety.
As Ross noted, we have lost two colleagues on site in the past few months.
One working for a contracting partner at Peak Downs in the Bowen Basin; and the other a maintenance worker at Escondida.
Both losses are unacceptable.
As leaders, these moments stay with us. They remind us that behind every job, every roster and every shift is a person who expects to return home safely to the people who matter most.
At BHP, we have made progress in improving safety over many years.
But progress alone is not the measure.
The only acceptable number is zero.
I believe mining can be fatality free, and I want BHP to help prove that.
That means acting with urgency, learning everything we can from incidents when they occur, and applying those lessons across the whole company and sharing them across the industry. It means continuously improving our standards, systems and critical controls.
And it means moving faster to adopt the technologies that help make work safer.
Importantly, we must achieve the same level of safety performance for every contractor and partner working alongside us as we do for our employees.
When it comes to safety, there can be no distinction.
Nothing we achieve as a company matters more than that.
Strong results built on strong foundations
Turning now to our performance.
In FY2026 BHP delivered strong operational and financial results.
We demonstrated the quality of our assets, the strength of our portfolio and the growing maturity of the BHP Operating System.
Across our business, our teams delivered safely, reliably and with discipline.
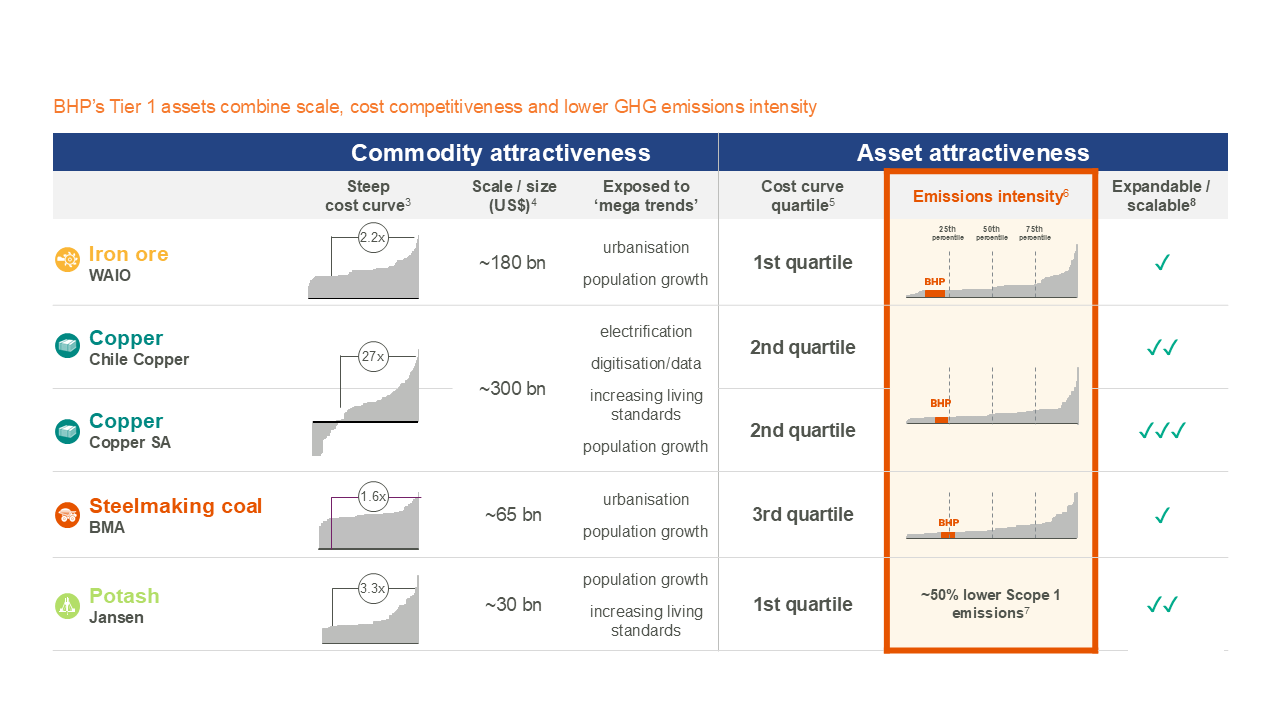
We achieved record production at Western Australia Iron Ore, which remained the world’s lowest-cost major iron ore producer for the seventh year running.
Operational performance in our steelmaking coal business continued to improve.
Olympic Dam recorded its highest copper production in more than twenty years.
And at Escondida, record material moved and record concentrator throughput helped support another outstanding year.
As a result, copper contributed more than half of BHP's earnings for the first time.
Today, BHP is the world's largest copper producer.
That matters because copper is becoming increasingly important to the modern economy. It is critical for electrification, digital infrastructure, manufacturing and economic development around the world.
And, our strong operational performance translated into strong financial performance.
Underlying EBITDA increased to US$33 billion and underlying attributable profit rose 30% to US$13 billion.
These results are not simply the product of favourable markets. Every one of our major assets achieved its unit cost guidance, despite inflation, higher diesel prices, and global supply disruption.
Results which reflect deliberate choices we have made.
We have simplified our portfolio, focused on commodities with attractive long-term demand fundamentals, and invested in world-class assets.
And we have maintained the discipline to perform through the cycle.
I am very confident in the future of this company, and I have high ambitions for what we can achieve from here.
Winning the next decade
While I am pleased with where BHP stands today, I am even more excited about what comes next.
My focus as Chief Executive is centred on three priorities.
First, strengthening our foundations.
Everything else we do depends on them.
That starts with safety.
It also means building the talent we need to advance our plans – particularly in project delivery, digital and AI. It means delivering on our social value and sustainability commitments. And it means deepening our core relationships.
Over the past few months, I have spent considerable time listening to and meeting with our people, customers, governments, communities, investors and industry partners.
Last month, I visited China and met with a number of our steelmaking customers. The conversations reinforced something I have long believed.
The strongest partnerships are built over decades.
Our customers depend on us to provide reliable supply and high-quality products. We depend on them to help us understand how markets are evolving and where future opportunities will emerge.
The same principle applies to governments, communities and Traditional Owners.
Strong relationships build trust. Trust creates resilience. And together they create opportunities for growth and development.
That is why strengthening these foundations is not separate from business performance. It is an essential part of it.
Second, accelerating performance.
The BHP Operating System has already transformed the way we work.
Over the past several years, it has improved operational stability, productivity and cost performance across our assets.
But I see more opportunity ahead.
The next step is combining the BHP Operating System with technology more deeply.
As we combine world-class operating discipline with world-class technology, I believe we can reach new horizons in safety and productivity and increase the velocity of the business.
And third, delivering disciplined, programmatic growth.
We are fortunate to have one of the strongest growth pipelines in our industry.
Jansen is progressing towards first production mid next year and will create a significant new earnings stream for BHP. Importantly, it also diversifies us by commodity and geography, which helps us to perform more consistently in a cyclical industry.
Jansen has taken longer and cost more than we originally planned. That being said, we have tightened our controls, and our immediate priority is the safe, disciplined delivery of its first production.
In copper, we continue to advance an outstanding portfolio of growth options, including projects at Escondida, Copper South Australia and Vicuña.
Company-wide, our current plans are expected to support compound annual production growth of approximately three to four per cent through to 2035, including around five per cent annual growth for copper.
It is essential that this growth is delivered to plan.
That is why we are investing significantly in our project execution capability.
Our commitment is to execute projects safely, on time, on budget and with a clear focus on shareholder value. That is our capital discipline at work.
Our ambition is simple. To win the next decade for BHP.
Why BHP
Let me close with why I believe BHP is uniquely positioned for the future.
We operate in commodities the world needs.
We have a portfolio of world-class assets.
Our existing iron ore business is large, strong and resilient.
Our copper position is world-leading and growing.
And we have a culture that combines operational excellence with disciplined capital allocation.
Our advantage is not any single asset or any single commodity.
It is the combination of our people, our portfolio, and our operating system.
The world will need more copper. It will need iron ore. It will need steelmaking coal.
And it will need potash to help feed a growing population.
As much as this company has achieved over more than 140 years, I believe our best chapters are still ahead of us.
I am excited about the future. I am excited about what our people can achieve.
And I am excited about the value we can create together for shareholders and the communities and countries where we operate.
Thank you for your continued support and trust in BHP.
Thank you.

 ](
 ](
 ](


 ](


 ](
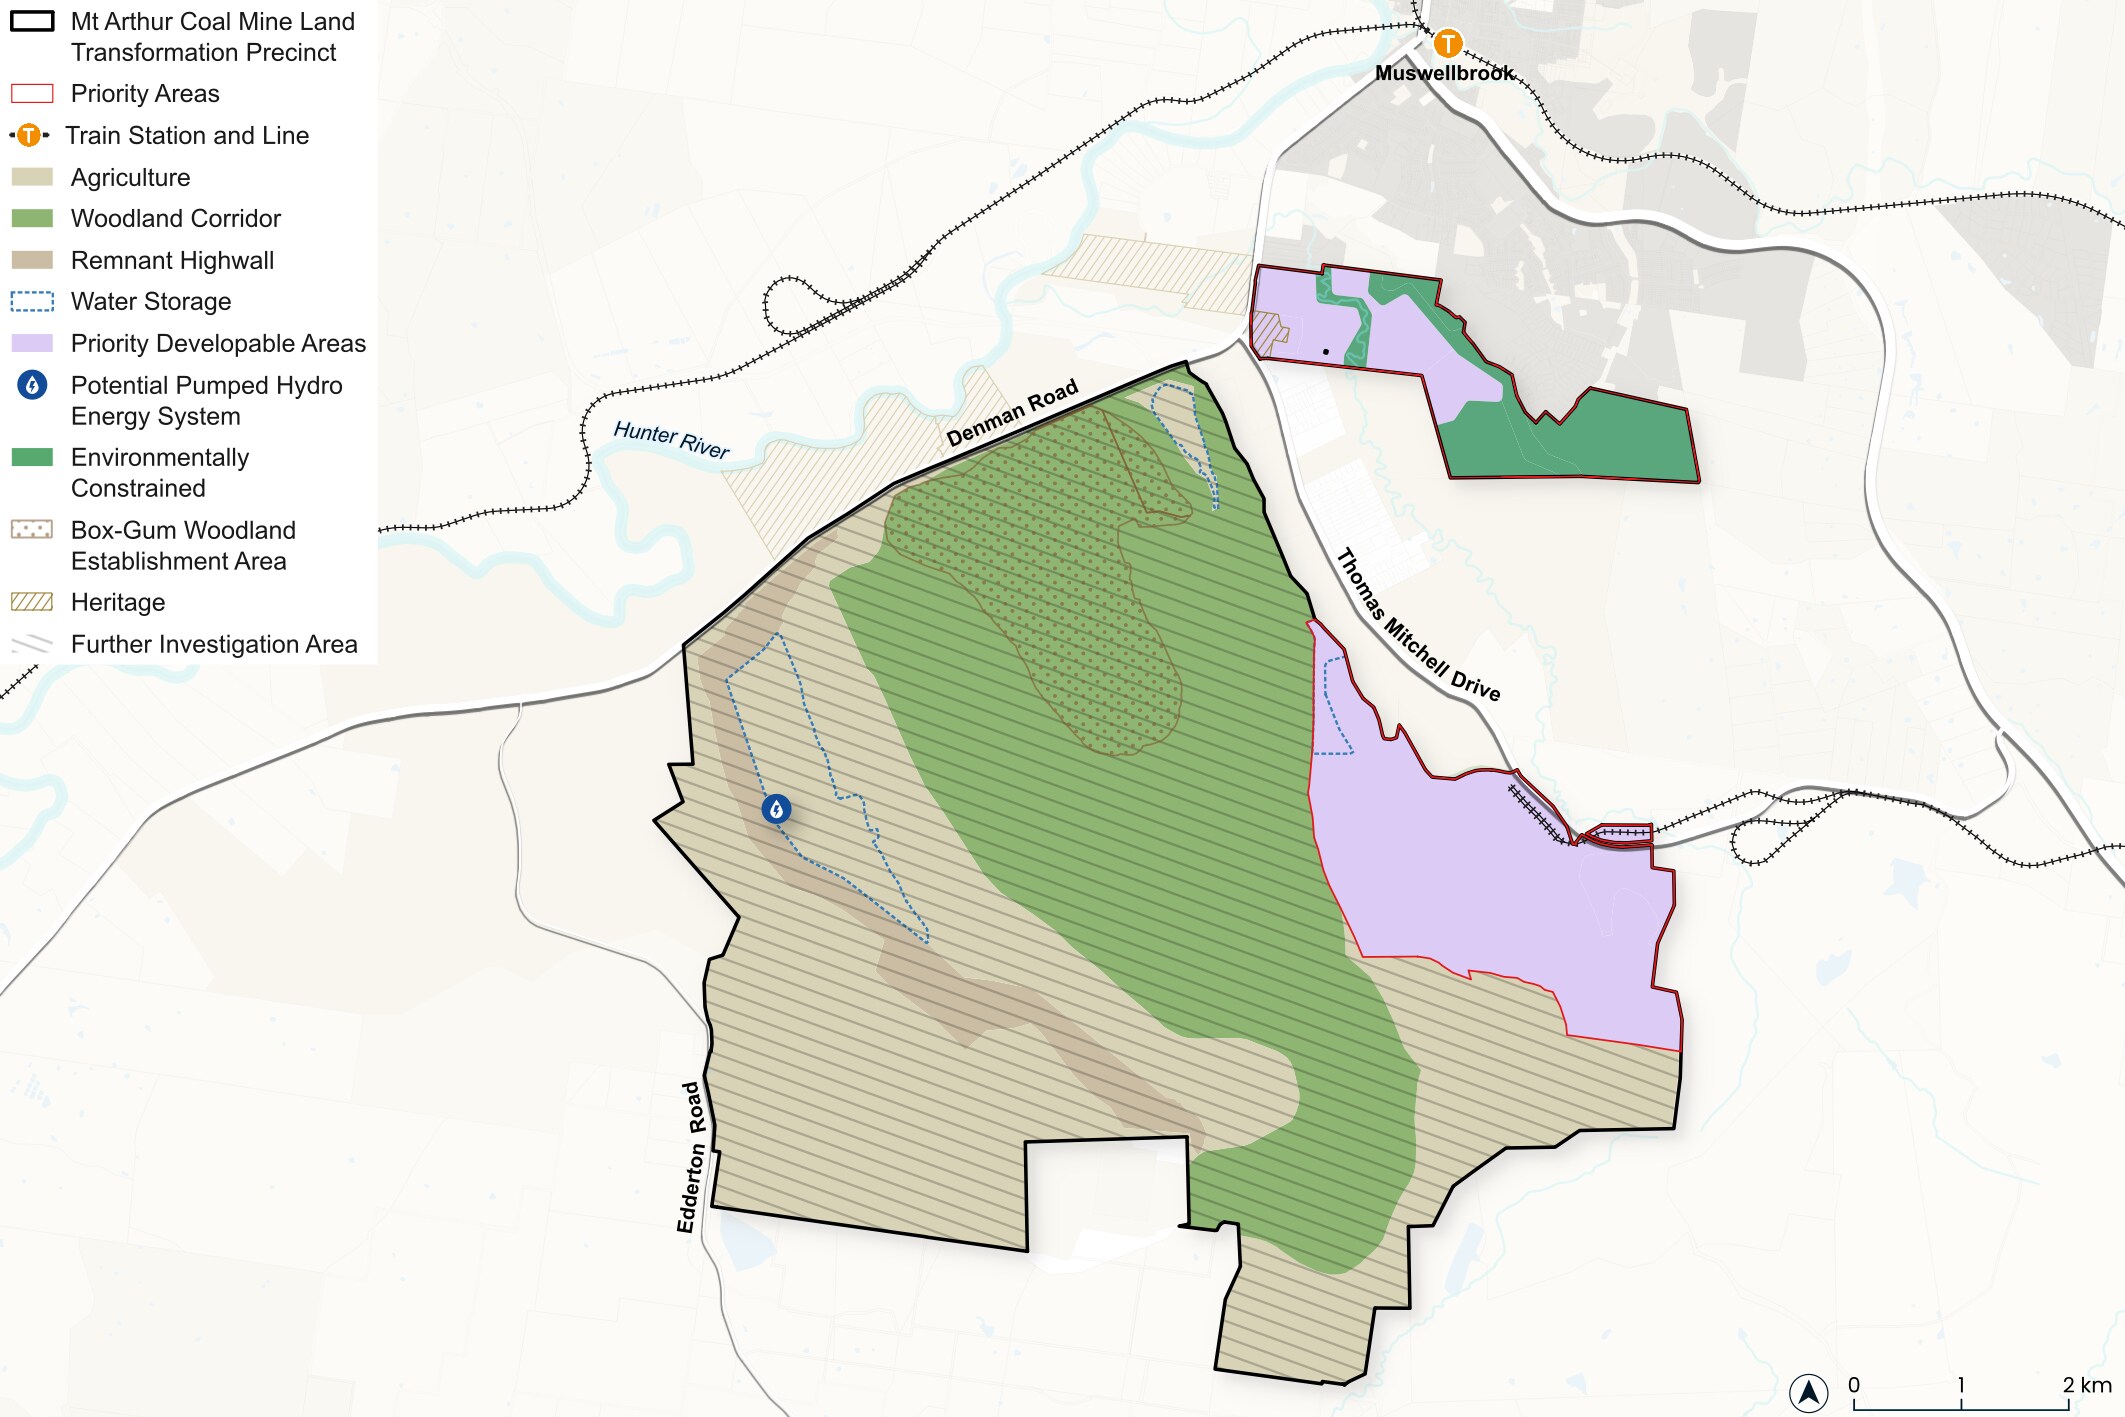 We will now continue to work collaboratively with Government, Council and community to progress
 | BHP shareholders received US$1.72 per share (or US$8.7 billion) in dividend payments for FY2026 – the highest in four years. |
 | Chief Financial Officer Vandita Pant outlines how our strong operating performance, Capital Allocation Framework (CAF) and two innovative transactions helped unlock this value for shareholders at a time of major investment in future growth. |
 | Pant also explains why she remains confident in BHP’s ability to continue paying attractive shareholder returns while also funding the company's growth program. |