|
Sanofi is a research and development-driven biopharmaceutical company that discovers, develops, and delivers medicines and vaccines. The company focuses on therapeutic areas including immunology, oncology, rare diseases, and vaccines, leveraging artificial intelligence to accelerate drug discovery. Sanofi operates globally, serving patients and healthcare systems worldwide. The company maintains strategic alliances with partners such as Regeneron and Cheplapharm to expand its portfolio of next-generation immunology antibodies and mature medicines. Sanofi also collaborates with Ablynx for research and development activities. The group manages a pipeline of compounds in clinical development, including multiple phase 3 trials, to address unmet medical needs in chronic skin diseases, multiple sclerosis, and other conditions. Summarised from the company's own disclosures, fiscal year ended Feb 2026 |
Industry Drug Manufacturers - General | Homepage sanofi.com |
| Sector Healthcare | IR page sanofi.com/en/investors | |
|
Tags
biopharmaceuticals, vaccines, immunology, oncology, rare diseases, drug discovery, artificial intelligence, clinical trials, autoimmune diseases, multiple sclerosis, Ablynx, Regeneron, Cheplapharm, ITP Control Tool
|
Press page sanofi.com/en/media-room/press-releases |
Metrics
| Valuation | |
|---|---|
| Market cap | € 97.56B |
| Market cap (USD) | $ 107.209B |
| P/E | 19.75 |
| PEG | — |
| P/BV | 1.36 |
| P/S | 2.24 |
| P/OCF | 9.08 |
| P/FCF | — |
| Dividend yield | — |
| Turnover / mcap | — |
| Returns | |
|---|---|
| ROE | 10.4% |
| ROI | 9.1% |
| ROIC | 5.5% |
| Profit margin | 17.9% |
| Growth | |
|---|---|
| Revenue growing | Yes |
| Profits growing | Yes |
| Revenue up 3y | No |
| Revenue up 5y | No |
| Earnings growth 3y (net profit CAGR) | -16.0% |
| Quality | |
|---|---|
| Profitable | Yes |
| Margin expanding | No |
| Buying back stock | Yes |
| Diluting (TTM) | No |
| Debt/Equity | 19.9% |
| Podcast bulls (TTM) | Sign up |
| Podcast bears (TTM) | Sign up |
| Podcast sentiment (TTM) | Sign up |
| Podcast sentiment % (TTM) | Sign up |
| News sentiment (TTM) | 171 |
| Quality score | 29.4% |
| Insiders | |
|---|---|
| Buys, 1w | Sign up |
| Buys, 1m | Sign up |
| Buys, 1y | Sign up |
| Sells, 1w | Sign up |
| Sells, 1m | Sign up |
| Sells, 1y | Sign up |
| Figure | FY 2025 | FY 2024 | FY 2023 | FY 2022 | FY 2021 | FY 2020 | FY 2019 | FY 2018 | FY 2017 | FY 2016 | FY 2015 | FY 2014 | FY 2013 | FY 2012 | FY 2011 | FY 2010 | FY 2009 |
|---|---|---|---|---|---|---|---|---|---|---|---|---|---|---|---|---|---|
| Revenue | 43.626B | 41.081B | 43.07B | 42.997B | 37.761B | 36.041B | 36.126B | 34.463B | 35.072B | — | — | — | — | — | — | — | — |
| Net profit | 7.813B | 5.56B | 5.4B | 8.371B | 6.223B | 12.314B | 2.806B | 4.306B | 8.416B | 4.709B | 4.287B | 4.39B | 3.717B | 4.967B | 5.693B | 5.467B | 5.265B |
| Free cash flow | 7.212B | 5.886B | 7.352B | 8.423B | 8.479B | — | — | — | — | — | — | — | — | — | — | — | — |
| Figure | FY 2025 | FY 2024 | FY 2023 | FY 2022 | FY 2021 | FY 2020 | FY 2019 | FY 2018 | FY 2017 | FY 2016 | FY 2015 | FY 2014 | FY 2013 | FY 2012 | FY 2011 | FY 2010 | FY 2009 |
|---|---|---|---|---|---|---|---|---|---|---|---|---|---|---|---|---|---|
| Share price | 41.22 | 43.91 | 45.69 | 48.1 | 42.5 | 41.57 | 45.15 | 37.33 | 36.61 | 36.22 | 38.37 | 34.41 | 40.5 | 37.9 | 25.87 | 24.97 | 27.45 |
| Price performance 12m | 0 | -0.03 | 0.03 | -0.03 | 0.03 | -0.03 | 0.16 | 0.01 | 0.06 | -0.05 | -0.06 | -0.15 | 0.13 | 0.3 | 0.13 | -0.18 | — |
Filed figures
Lines the statements and their notes report beside the headline figures, read from the filings' XBRL as filed (no restatement applied), with figures computed from one filing's own lines. Cash-flow lines carry their cash direction: an outflow is negative. Each period links to its filing; a figure's period, report date and tag are in its tooltip.
| Figure | Dec 2016 | Dec 2017 | Dec 2018 | Dec 2019 | Dec 2020 | Dec 2021 | Dec 2022 | Dec 2023 | Dec 2024 | Dec 2025 |
|---|---|---|---|---|---|---|---|---|---|---|
| Cash flow detail | ||||||||||
| Change in receivables (cash effect) (EUR) | -168M | — | — | — | — | — | — | — | — | — |
| Change in inventories (cash effect) (EUR) | 323M | — | — | — | — | — | — | — | — | — |
| Change in payables (cash effect) (EUR) | 447M | — | — | — | — | — | — | — | — | — |
| Income detail | ||||||||||
| Research and development expense (EUR) | 5.17B | 5.47B | 5.89B | 6.02B | 5.53B | 5.69B | 6.71B | 6.73B | 7.39B | 7.84B |
| ↳ 5y CAGR | +1.5% | +2.1% | +4.3% | +4.5% | +1.7% | +1.9% | +4.2% | +2.7% | +4.2% | +7.2% |
| Total comprehensive income (EUR) | 5.73B | — | — | — | — | — | — | — | — | — |
| Comprehensive income to owners (EUR) | 5.73B | — | — | — | — | — | — | — | — | — |
| Reported | Mar 3, 2017 | Mar 8, 2019 | Mar 8, 2019 | Mar 5, 2020 | Mar 4, 2021 | Feb 23, 2022 | Feb 24, 2023 | Feb 23, 2024 | Feb 13, 2025 | Feb 17, 2026 |
Podcast Mentions
Regulated information filed with the AMF (info-financiere.gouv.fr), newest first, titles as filed. Voting-rights totals, own-share transactions, threshold crossings and availability notices are left out. The link opens the filed document. Material events reported to the SEC on Form 8-K or 6-K, newest first. The link opens the filing itself on EDGAR. Press releases from the company's own website, newest first.
FY 2026: guidance upgraded
October 30, 2026
Q3 sales growth of 14.3% at CER1 and business earnings per share (EPS)2 of €3.55
•Pharma launches sales increased by 31.4%, reaching €1.4 billion, driven by ALTUVIIIO, Ayvakit, and Rezurock
•Dupixent sales increased by 34.8% to €5.7 billion, above €5 billion per quarter for the second time
•Vaccines sales decreased by 6.6% to €3.2 billion, impacted by the anticipated phasing in respiratory prevention
•Research and Development expenses reached €1.8 billion, broadly stable
•Selling and general expenses reached €2.3 billion, down by 0.9%, reflecting cost discipline
•Business EPS was €3.55, up by 19.6% at CER; 22.0% at actual exchange rates; IFRS EPS €2.52
Pipeline update
•Two regulatory approvals; in rare diseases and vaccines
•One regulatory submission acceptance and two regulatory designations (priority review and PRIME)
Guidance upgraded
•2026 guidance is upgraded: sales are expected to grow by a low-teens percentage at CER.
October 30, 2026
Share
-
[](https://www.facebook.com/sharer.php?u=https://www.sanofi.com/en/media-room/press-releases/2026/2026-10-30-06-30-00-3392028&t=Press Release: Q3 2026: double-digit growth in sales and business EPS FY 2026: guidance upgraded)
-
[](https://twitter.com/share?url=https://www.sanofi.com/en/media-room/press-releases/2026/2026-10-30-06-30-00-3392028&text=Press Release: Q3 2026: double-digit growth in sales and business EPS FY 2026: guidance upgraded)
-
[](https://www.linkedin.com/shareArticle?mini=true&url=https://www.sanofi.com/en/media-room/press-releases/2026/2026-10-30-06-30-00-3392028&title=Press Release: Q3 2026: double-digit growth in sales and business EPS FY 2026: guidance upgraded)
Q3 2026: double-digit growth in sales and business EPS FY 2026: guidance upgraded
October 30, 2026
Q3 sales growth of 14.3% at CER1and business earnings per share (EPS)2of €3.55
-
Pharma launches sales increased by 31.4%, reaching €1.4 billion, driven by ALTUVIIIO, Ayvakit, and Rezurock
-
Dupixent sales increased by 34.8% to €5.7 billion, above €5 billion per quarter for the second time
-
Vaccines sales decreased by 6.6% to €3.2 billion, impacted by the anticipated phasing in respiratory prevention
-
Research and Development expenses reached €1.8 billion, broadly stable
-
Selling and general expenses reached €2.3 billion, down by 0.9%, reflecting cost discipline
-
Business EPS was €3.55, up by 19.6% at CER; 22.0% at actual exchange rates; IFRS EPS €2.52
Pipeline update
-
Two regulatory approvals; in rare diseases and vaccines
-
One regulatory submission acceptance and two regulatory designations (priority review and PRIME)
Guidance upgraded
- 2026 guidance is upgraded: sales are expected to grow by a low-teens percentage at CER. Business EPS at CER is expected to grow by a mid-teens percentage.3
Belén Garijo, Chief Executive Officer: “Sanofi achieved another strong quarter with double-digit sales growth of 14.3%, mainly driven by our new medicines and Dupixent. Business EPS increased by 19.6%, driven by cost discipline. The pipeline milestones included two regulatory approvals, one regulatory submission, and two additional regulatory designations. Our strong commercial and financial momentum to date leads us to raise our 2026 guidance: sales growth is now expected at a low-teens percentage and business EPS growth at a mid-teens percentage, underscoring our sustainable, profitable growth.
In the third quarter, we accelerated Sanofi’s transformation by expanding our long-standing alliance with Regeneron, which opens up further opportunities in immunology. We also continued to simplify our portfolio through a partnership with Cheplapharm covering a number of legacy medicines4.
We are confident about our ability to pursue our strong commercial and financial performance in the short and medium term. The whole organisation is focused on managing Sanofi’s post-Dupixent trajectory over the next decade. Our priority is to protect earnings through Dupixent’s loss of exclusivity. We have already begun taking action to improve R&D productivity. Business development and M&A will be critical to complement this transformation. We remain committed to our long-term capital allocation policy, including our progressive dividend.”
| | Q3 2026 | Change | Change at CER | YTD 2026 | Change | Change at CER |
| Net sales | €14,444m | +16.2% | +14.3% | €36,550m | +13.1% | +15.2% |
| IFRS net income | €3,021m | +7.8% | — | €4,979m | -42.2% | — |
| IFRS EPS | €2.52 | +9.6% | — | €4.15 | -41.1% | — |
| Free cash flow5 | €3,269m | +9.2% | — | €6,993m | +28.3% | — |
| Business operating income | €5,430m | +22.2% | +19.7% | €11,688m | +19.2% | +21.1% |
| Business net income | €4,255m | +20.0% | +17.6% | €9,020m | +17.2% | +19.1% |
| Business EPS | €3.55 | +22.0% | +19.6% | €7.52 | +19.4% | +21.3% |
1 Changes in net sales are at constant exchange rates (CER) unless otherwise stated (see definition in Appendix 8). 2 To facilitate an understanding of operational performance, Sanofi comments on business operating income, business net income, and business EPS (bEPS), which are non-IFRS financial measures (see definitions in Appendix 8). The IFRS consolidated income statement is in Appendix 3, and a reconciliation of IFRS net income to business net income is in Appendix 4. 3 Applying October 2026 average currency exchange rates, currency impacts are estimated at c.-1% on sales and at c.-1% on business EPS. 4 Subject to information and consultation procedures with employee representatives, regulatory approvals, and customary closing conditions. 5 Free cash flow is a non-IFRS financial measure (see definition in Appendix 8).
Third quarter 2026 results
Third quarter 2026 results were reviewed by management during a live audio webcast with the financial community on October 30, 2026. The presentation was followed by a Q&A session.
Featuring

Belén Garijo
Chief Executive Officer

François Roger
Chief Financial Officer
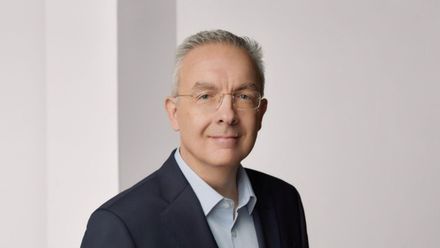
Paulo Fontoura
Head of Research and Development
Highlights
Sanofi achieved another strong quarter with both robust commercial and financial performance. We have also made progress towards defining our roadmap for the future. We have confirmed our commitment to three focus areas: Immunology, Rare diseases, and Vaccines, and are focused on rebuilding the pipeline through business development, mergers and acquisitions and improving R&D productivity.
Belén Garijo
Chief Executive Officer
Streaming
Watch the replay
Downloads
Press release
Presentation
Income statement
Net sales of medicine/vaccine, business, segment by region
R&D appendix
Infographic
Aide-mémoire
Transcript (LSEG report - AI transcript - accuracy not guaranteed)

Cookie settings
When you visit any website, it may store or retrieve information on your browser, mostly in the form of cookies. This information might be about you, your preferences or your device and is mostly used to make the site work as you expect it to, to make your online experience easier by saving browsing information. The information does not usually directly identify you, but it can give you a more personalized web experience. There are two types of cookies, the first-party cookies, created by the website you visit and hosted by Sanofi, and third-party cookies, created by other websites. Because we respect your right to privacy, you can choose not to allow some types of cookies. Click on the different category headings to find out more and change our settings. For more information on the cookies, please consult the "Cookies Policy" available in the footer.
Accept all
Manage Consent Preferences
Strictly Necessary Cookies
Always Active
These cookies are necessary for the website to function and cannot be switched off in our systems. They are only set to provide you with services you have requested, such as setting your privacy preferences, logging in or filling in forms. You can set your browser to block or alert you about these cookies, but these functions and services will not work for you and in particular, we won’t be able to save your preferences about cookies. These cookies do not store any personally identifiable information.
View Vendor Details
Functional Cookies
Functional Cookies
These cookies enable the website to provide enhanced functionality and personalization. They may be set by us or by third party providers whose services we have added to our pages. If you do not allow these cookies then some or all of these services may not function properly.
View Vendor Details
Performance Cookies
Performance Cookies
These cookies allow us to count visits and traffic sources so we can measure and improve the performance of our site. They measure how often you visit our website and how you use it. They help us to know which pages are the most and least popular and see how visitors move around the site. All information these cookies collect is aggregated and therefore anonymous. If you do not allow these cookies we will not know when you have visited our site, and will not be able to monitor its performance.
View Vendor Details
Targeting Cookies
Targeting Cookies
These cookies may be set through our site by our advertising partners. They may be used by those companies to build a profile of your interests and show you relevant adverts on other sites. They do not store directly personal information, but are based on uniquely identifying your browser and internet device. If you do not allow these cookies, you will experience less targeted advertising. Subject to your prior consent, these cookies stored in your device by the third-parties listed below, allow us to count the number of displays of advertising content in our advertising spaces, identify these contents, the number of displays for each of them, the number of users who clicked on each content and where applicable, further actions carried out by the users on the sites linked to these advertising contents, to be able to calculate the sums due to the actors of the advertising distribution chain (communication agency, advertising management, site/distribution medium) and to establish statistics. Please note that when consenting to the use of targeting cookies, you also consent to the follow up of your navigation on other websites.
View Vendor Details
Vendors List
Clear
- checkbox label label
Apply Cancel
Leg.Interest
checkbox label label
checkbox label label
checkbox label label
Reject all

Quarterly results ConferencesPresentationsAnnual general meetings
28Jan
2027
Fourth quarter & full year 2026 results
Fourth quarter 2026 results will be reviewed by management during a live audio webcast with the financial community on January 28, 2027. The presentation will be followed by a Q&A session.
TBD CET (TBD EST)
Quarterly results
23Apr
2027
First quarter 2027 results
First quarter 2027 results will be reviewed by management during a live audio webcast with the financial community on April 23rd, 2027. The presentation will be followed by a Q&A session.
TBD CEST (TBD EDT)
Quarterly results
29Jul
2027
Second quarter 2027 results
Second quarter 2027 results will be reviewed by management during a live audio webcast with the financial community on July 29, 2027. The presentation will be followed by a Q&A session.
TBD CEST (TBD EDT)
Quarterly results
28Oct
2027
Third quarter 2027 results
Third quarter 2027 results will be reviewed by management during a live audio webcast with the financial community on October 28, 2027. The presentation will be followed by a Q&A session.
TBD CEST (TBD EDT)
Quarterly results
Cookie settings
When you visit any website, it may store or retrieve information on your browser, mostly in the form of cookies. This information might be about you, your preferences or your device and is mostly used to make the site work as you expect it to, to make your online experience easier by saving browsing information. The information does not usually directly identify you, but it can give you a more personalized web experience. There are two types of cookies, the first-party cookies, created by the website you visit and hosted by Sanofi, and third-party cookies, created by other websites. Because we respect your right to privacy, you can choose not to allow some types of cookies. Click on the different category headings to find out more and change our settings. For more information on the cookies, please consult the "Cookies Policy" available in the footer.
Accept all
Manage Consent Preferences
Strictly Necessary Cookies
Always Active
These cookies are necessary for the website to function and cannot be switched off in our systems. They are only set to provide you with services you have requested, such as setting your privacy preferences, logging in or filling in forms. You can set your browser to block or alert you about these cookies, but these functions and services will not work for you and in particular, we won’t be able to save your preferences about cookies. These cookies do not store any personally identifiable information.
View Vendor Details
Functional Cookies
Functional Cookies
These cookies enable the website to provide enhanced functionality and personalization. They may be set by us or by third party providers whose services we have added to our pages. If you do not allow these cookies then some or all of these services may not function properly.
View Vendor Details
Performance Cookies
Performance Cookies
These cookies allow us to count visits and traffic sources so we can measure and improve the performance of our site. They measure how often you visit our website and how you use it. They help us to know which pages are the most and least popular and see how visitors move around the site. All information these cookies collect is aggregated and therefore anonymous. If you do not allow these cookies we will not know when you have visited our site, and will not be able to monitor its performance.
View Vendor Details
Targeting Cookies
Targeting Cookies
These cookies may be set through our site by our advertising partners. They may be used by those companies to build a profile of your interests and show you relevant adverts on other sites. They do not store directly personal information, but are based on uniquely identifying your browser and internet device. If you do not allow these cookies, you will experience less targeted advertising. Subject to your prior consent, these cookies stored in your device by the third-parties listed below, allow us to count the number of displays of advertising content in our advertising spaces, identify these contents, the number of displays for each of them, the number of users who clicked on each content and where applicable, further actions carried out by the users on the sites linked to these advertising contents, to be able to calculate the sums due to the actors of the advertising distribution chain (communication agency, advertising management, site/distribution medium) and to establish statistics. Please note that when consenting to the use of targeting cookies, you also consent to the follow up of your navigation on other websites.
View Vendor Details
Vendors List
Clear
- checkbox label label
Apply Cancel
Leg.Interest
checkbox label label
checkbox label label
checkbox label label
Reject all
Paris and Frankfurt, October 19, 2026. Sanofi today broke ground on a new state-of-the-art insulin manufacturing facility at its BioCampus in Frankfurt, Germany. The new facility will bring a new generation of insulin production to one of Sanofi’s largest integrated research and manufacturing sites, strengthening Sanofi’s long-term ability to provide a reliable supply of insulin to millions of people living with diabetes around the world.
Prime Minister of the State of Hesse Boris Rhein and Mayor of Frankfurt Mike Josef joined Belén Garijo, Chief Executive Officer of Sanofi, Brendan O’Callaghan, Sanofi Executive Vice President, Manufacturing & Supply and Chairman of the Supervisory Board of Sanofi in Germany, and Madeleine Roach, Country President of Sanofi in Germany, at today’s groundbreaking ceremony.
“Millions of people around the world rely on insulin every day, and our commitment to them is for the long term. With this new facility, we are investing in the next generation of insulin manufacturing in Europe, building on more than a century of expertise and a strong industrial footprint in Frankfurt.
October 20, 2026
Share
-
[](https://www.facebook.com/sharer.php?u=https://www.sanofi.com/en/media-room/press-releases/2026/2026-10-20-12-00-00-3384293&t=Media Update: UEG Week: Sanofi and Teva’s duvakitug maintained long-term positive outcomes in new phase 2b data for ulcerative colitis and Crohn’s disease)
-
[](https://twitter.com/share?url=https://www.sanofi.com/en/media-room/press-releases/2026/2026-10-20-12-00-00-3384293&text=Media Update: UEG Week: Sanofi and Teva’s duvakitug maintained long-term positive outcomes in new phase 2b data for ulcerative colitis and Crohn’s disease)
-
[](https://www.linkedin.com/shareArticle?mini=true&url=https://www.sanofi.com/en/media-room/press-releases/2026/2026-10-20-12-00-00-3384293&title=Media Update: UEG Week: Sanofi and Teva’s duvakitug maintained long-term positive outcomes in new phase 2b data for ulcerative colitis and Crohn’s disease)
UEG Week: Sanofi and Teva’s duvakitug maintained long-term positive outcomes in new phase 2b data for ulcerative colitis and Crohn’s disease
-
In UC, duvakitug maintained high rates of clinical remission, clinical response, and endoscopic improvement at Week 44
-
In CD, duvakitug maintained high rates of endoscopic response, clinical response, and clinical remission at Week 44
-
Duvakitug was well tolerated and safety was consistent with the induction study
Paris and Parsippany, NJ. October 20, 2026. New positive data from the RELIEVE UCCD phase 2b long-term extension (LTE) study (clinical trial identifier: NCT05668013) in patients with moderately-to-severely active ulcerative colitis (UC) or Crohn’s disease (CD) demonstrated that duvakitug maintained clinically meaningful efficacy improvements across multiple endpoints over 44 weeks. Duvakitug is an investigational human monoclonal antibody that targets TL1A, a protein that amplifies inflammation and potentially drives fibrosis in UC and CD.
In addition, biomarker findings that advance the understanding of how duvakitug may impact inflammation and tissue remodeling in inflammatory bowel disease (IBD) were shared. These data were presented today at United European Gastroenterology (UEG) Week 2026 in Barcelona.
The RELIEVE UCCD LTE study evaluated the efficacy, safety, and tolerability of duvakitug through 44 weeks of maintenance treatment after induction in patients with UC and CD, the two most common forms of IBD. Patients (n=130, 72 with UC and 58 with CD) who responded to duvakitug treatment in the 14-week induction study were randomized to receive either duvakitug 450 mg or 900 mg subcutaneously every four weeks (Q4W) for up to 58 weeks of total exposure.
UC Results At Week 44, maintenance treatment with duvakitug demonstrated high rates of clinical remission and clinical response, as measured by the modified Mayo Score (mMS), meaning active UC symptoms such as rectal bleeding, increased stool frequency, and pain have stopped (remission) or improved (response). Duvakitug treatment also achieved high rates of endoscopic improvement, defined by a Mayo Endoscopic Score of 0 (inactive disease in the colon) or 1 (mild disease activity), which measures the presence and degree of intestinal inflammation. Efficacy outcomes were numerically higher at 900 mg compared to 450 mg, consistent with a dose response.
| Efficacy in UC at Week 44 Maintenance Phase Endpoint |
| | Duvakitug 450 mg Q4W (n=34) | Duvakitug 900 mg Q4W (n=38) |
| Clinical remission (mMS) | 47% [95% CI: 30, 65] | 58% [95% CI: 42, 73] |
| Clinical response (mMS) | 82% [95% CI: 61, 91] | 87% [95% CI: 71, 94] |
| Endoscopic improvement | 59% [95% CI: 42, 76] | 63% [95% CI: 47, 78] |
| Data are descriptive. Confidence intervals (CIs) are based on logistic regression. |
“Ulcerative colitis can have a significant impact on patients that disrupts even the most basic daily activities. Despite available therapies, some patients continue to experience flares that impact their lives in various ways and may contribute to disease progression,” said Walter Reinisch, MD, PhD, Director of the Inflammatory Bowel Disease Study Group at the Medical University of Vienna and a co-lead investigator of the RELIEVE UCCD LTE study. “These results underscore the potential of duvakitug to deliver effective and durable relief from persistent inflammation and symptoms, supporting better long-term disease management in patients with ulcerative colitis.”
CD Results Duvakitug maintenance treatment demonstrated high rates of endoscopic response, defined as a 50% or more decrease from baseline in Simple Endoscopic Score for Crohn’s Disease (SES-CD) at Week 44. SES-CD assesses mucosal ulcers, the ulcerated surface, the endoscopic extension, and the presence of stenosis in the colon as a gauge of disease severity. Additionally, duvakitug maintained high rates of clinical response and clinical remission as measured by the Crohn’s Disease Activity Index (CDAI), meaning symptoms such as abdominal pain, diarrhea, and fatigue have stopped (remission) or improved (response). Duvakitug appeared to demonstrate a dose response, with numerically higher efficacy results achieved at the higher dose.
| Efficacy in CD at Week 44 Maintenance Phase Endpoint |
| | Duvakitug 450 mg Q4W (n=27) | Duvakitug 900 mg Q4W (n=31) |
| Endoscopic response | 41% [95% CI: 25, 62] | 55% [95% CI: 39, 75] |
| Clinical response (CDAI) | 81% [95% CI: 63, 94] | 87% [95% CI: 70, 96] |
| Clinical remission (CDAI) | 81% [95% CI: 65, 95] | 84% [95% CI: 68, 96] |
| Data are descriptive. Confidence intervals (CIs) are based on logistic regression. |
“Due to the heterogeneous nature of Crohn’s disease, many patients either stop responding or never respond to available therapies, leaving them with uncontrolled symptoms that cause physical distress,” said Vipul Jairath, MBChB, DPhil, FRCP, FRCPC, Professor of Medicine in the Departments of Medicine, Epidemiology and Biostatistics at Western University and a co-lead investigator of the RELIEVE UCCD LTE study. “The efficacy rates seen with duvakitug in the maintenance period highlight its potential as a new treatment option that could help more patients achieve sustained remission.”
Across both UC and CD, duvakitug was generally well tolerated throughout the maintenance period, with a safety profile consistent with the induction phase and no new safety concerns identified. The most frequently reported adverse events (AEs) occurring in ≥5% of patients across pooled duvakitug dose groups in UC were upper respiratory tract infection and nasopharyngitis, and in CD were upper respiratory tract infection, CD, hypertension, nasopharyngitis, anemia, and influenza. The majority of AEs were mild or moderate in severity. Discontinuation rates due to AEs were low (UC, 4% and 2% in the 450 mg and 900 mg arms, respectively, and in CD were 6% in each arm).
Biomarker Results Biomarker analyses from the RELIEVE UCCD induction study (clinical trial identifier: NCT05499130) were presented at UEG Week 2026. Duvakitug reduced blood levels of markers connected to multiple inflammatory pathways in UC and to the Th17 and Th1 immune pathways in CD, as well as markers of neutrophilic inflammation in both blood and tissue in CD and UC. In patients with CD, duvakitug also reduced markers of tissue remodeling. These findings provide additional mechanistic evidence that TL1A inhibition may address both inflammation and, potentially, fibrosis.
Additionally, clinical results from the RELIEVE UCCD induction study were recently published in The Lancet Gastroenterology and Hepatology for UC and CD.
Duvakitug Clinical Development Program Duvakitug is being investigated in the phase 3 SUNSCAPE-1 (clinical trial identifier: NCT07184996) and SUNSCAPE-2 (clinical trial identifier: NCT07185009) studies in moderately-to-severely active UC, and the phase 3 STARSCAPE-1 (clinical trial identifier: NCT07184931) and STARSCAPE-2 (clinical trial identifier: NCT07184944) studies in moderately-to-severely active CD. Sanofi and Teva have initiated the phase 2 AURALIGHT study (clinical trial identifier: NCT07812116) of duvakitug in moderate-to-severe hidradenitis suppurativa and are planning a phase 2 study of duvakitug in fibrostenotic Crohn’s disease.
Duvakitug is currently under clinical investigation, and its efficacy and safety have not been evaluated by any regulatory authority.
About IBD Inflammatory bowel disease (IBD) is an autoimmune disorder characterized by chronic inflammation of the gastrointestinal (GI) tract. Globally, approximately 4.9 million cases of IBD have been identified, with incidence rising in several regions. The two main types of IBD are ulcerative colitis (UC) and Crohn’s disease (CD), which are characterized by repetitive cycles of relapses and remission. Common symptoms of both conditions include persistent diarrhea, rectal bleeding, abdominal pain, loss of appetite, and weight loss.
Prolonged inflammation can lead to damage within the GI tract, including fibrosis, a common complication of IBD characterized by an excessive accumulation of scar tissue in the intestinal wall, which may cause narrowing and obstruction.
Currently, there is no cure for IBD. The goal of current treatment is to induce and maintain remission and prevent flares.
About the RELIEVE UCCD phase 2b program The RELIEVE UCCD program is comprised of an induction study and a long-term extension (LTE).
RELIEVE UCCD: A 14-week phase 2b, randomized, double-blinded, dose-ranging induction study to evaluate the efficacy, safety, pharmacokinetics, and tolerability of duvakitug in adults with moderate-to-severe ulcerative colitis (UC) or Crohn’s disease (CD). The study was an innovative and efficient basket study design allowing the inclusion of patients with either UC or CD. It is the first and only randomized, blinded and placebo-controlled phase 2 study to investigate the impact of TL1A inhibition in CD.
RELIEVE UCCD LTE: An ongoing phase 2b study to evaluate the long-term efficacy and safety of duvakitug. Patients who received duvakitug, completed the 14-week induction study, and were responders, entered a 44-week double-blind maintenance period and were re-randomized to receive either 450 mg or 900 mg of subcutaneous duvakitug every four weeks. Patients who completed the 44-week maintenance period may continue to receive duvakitug in an open-label extension.
Primary efficacy endpoints for both the 14-week induction study and the 44-week maintenance period are clinical remission (as defined by mMS) in the UC cohort or endoscopic response (as defined by SES-CD) in the CD cohort. The study includes sites in the US, Europe, Israel, and Asia.
About duvakitug Duvakitug is a human monoclonal antibody targeting tumor necrosis factor-like ligand 1A (TL1A) being developed to reduce inflammation and potentially fibrosis. Duvakitug is currently in phase 3 clinical studies for the treatment of ulcerative colitis and Crohn’s disease and is also being investigated in hidradenitis suppurativa and fibrostenotic Crohn’s disease. The safety and efficacy of duvakitug have not been reviewed by any regulatory authority.
About the Sanofi and Teva collaboration Sanofi and Teva are collaborating to co-develop and co-commercialize duvakitug for the treatment of ulcerative colitis and Crohn’s disease, as well as fibrostenotic Crohn’s disease and hidradenitis suppurativa. Each company will equally share the development costs globally, and the net profits and losses in major markets, with other markets subject to a royalty arrangement. Teva will lead commercialization of the product in Europe, Israel, and specified other countries, and Sanofi will lead commercialization in North America, Japan, other parts of Asia, and the rest of the world.
About Teva Teva Pharmaceutical Industries Ltd. (NYSE and TASE: TEVA) is transforming into a leading innovative biopharmaceutical company, enabled by a world-class generics business. For over 120 years, Teva’s commitment to bettering health has never wavered. From innovating in the fields of neuroscience and immunology to providing complex generic medicines, biosimilars and pharmacy brands worldwide, Teva is dedicated to addressing patients’ needs, now and in the future. At Teva, We Are All In For Better Health. To learn more about how, visit www.tevapharm.com.
About Sanofi Sanofi is an R&D driven, AI-powered biopharma company committed to improving people’s lives and delivering compelling growth. We apply our deep understanding of the immune system to invent medicines and vaccines that treat and protect millions of people around the world, with an innovative pipeline that could benefit millions more. Our team is guided by one purpose: we chase the miracles of science to improve people’s lives; this inspires us to drive progress and deliver positive impact for our people and the communities we serve, by addressing the most urgent healthcare, environmental, and societal challenges of our time.
Sanofi is listed on EURONEXT: SAN and NASDAQ: SNY
Sanofi Media Relations Sandrine Guendoul | +33 6 25 09 14 25 | [email protected] Evan Berland | +1 215 432 0234 | [email protected] Léo Le Bourhis | +33 6 75 06 43 81 | [email protected] Victor Rouault | +33 6 70 93 71 40 | [email protected] Timothy Gilbert | +1 516 521 2929 | [email protected] Léa Ubaldi| +33 6 30 19 66 46 | [email protected] Ekaterina Pesheva | +1 410 926 6780 | [email protected]
Sanofi Investor Relations Thomas Kudsk Larsen | +44 7545 513 693 | [email protected] Alizé Kaisserian | +33 6 47 04 12 11 | [email protected] Keita Browne | +1 781 249 1766 | [email protected] Nathalie Pham | +33 7 85 93 30 17 | [email protected] Nina Goworek | +1 908 569 7086 | [email protected] Thibaud Châtelet | +33 6 80 80 89 90 | [email protected] Yun Li | +33 6 84 00 90 72 | [email protected]
Teva Media Inquiries: [email protected] Teva Investor Relations Inquiries: [email protected]
Sanofi forward-looking statements This media update contains forward-looking statements within the meaning of applicable securities laws, including the Private Securities Litigation Reform Act of 1995, as amended. Forward-looking statements are statements that are not historical facts. These statements include projections and estimates and their underlying assumptions, statements regarding plans, objectives, intentions, and expectations with respect to future financial results, events, operations, services, product development and potential, and statements regarding future events and economic performance. Words such as “expect,” “anticipate,” “believe,” “intend,” “estimate,” “plan,” “can,” “contemplate,” “could,” “is designed to,” “may,” “might,” “potential,” “objective,” "attempt," “target,” “project,” "strategy," "strive," "desire," “predict,” “forecast,” “ambition,” “guideline,” "seek," “should,” “will,” "goal," or the negative of these, and similar expressions are intended to identify forward-looking statements. Although Sanofi’s management believes that the expectations reflected in such forward-looking statements are reasonable, investors are cautioned that forward-looking information and statements are subject to various risks and uncertainties, many of which are difficult to predict and generally beyond the control of Sanofi, that could cause actual results and developments to differ materially from those expressed in, or implied or projected by, the forward-looking information and statements. These risks and uncertainties include among other things, the uncertainties inherent in research and development, future clinical data and analysis, including post marketing, decisions by regulatory authorities, such as the U.S Food and Drug Administration or the European Medicines Agency, regarding whether and when to approve any drug, device or biological application that may be filed for any such product candidates as well as their decisions regarding labelling and other matters that could affect the availability or commercial potential of such product candidates; the fact that product candidates if approved may not be commercially successful; unexpected regulatory actions or delays, or government regulation generally; authorities’ decisions regarding whether and when to approve a product candidate; political pressure in the United States to mandate lower drug prices including “most favored nation” pricing for State Medicaid programs; the future approval and commercial success of therapeutic alternatives; Sanofi’s ability to benefit from external growth opportunities, to complete related transactions and/or obtain regulatory clearances, including future clinical data and analysis of existing clinical data relating to the product, including post marketing, unexpected safety, quality or manufacturing issues, competition in general; risks associated with intellectual property and any related pending or future litigation and the ultimate outcome of such litigation; trends in exchange rates and prevailing interest rates, volatile economic and market conditions, cost containment initiatives and subsequent changes thereto, and the impact that global crises may have on us, our customers, suppliers, vendors, and other business partners, and the financial condition of any one of them, as well as on our employees and on the global economy as a whole. The risks and uncertainties also include the uncertainties discussed or identified in the public filings with the SEC and the French Markets Authority (AMF) made by Sanofi, including those listed under “Risk Factors” and “Cautionary Statement Regarding Forward-Looking Statements” in Sanofi’s annual report on Form 20-F for the year ended December 31, 2025 or contained in our periodic reports on Form 6-K. Other than as required by applicable law, Sanofi does not undertake any obligation to update or revise any forward-looking information or statements. In light of these risks, uncertainties and assumptions, you should not place undue reliance on any forward-looking statements contained herein.
All trademarks mentioned in this press release are the property of the Sanofi group.
Cautionary Note Regarding Forward-Looking Statements This Press Release contains forward-looking statements within the meaning of the Private Securities Litigation Reform Act of 1995, which are based on management’s current beliefs and expectations and are subject to substantial risks and uncertainties, both known and unknown, that could cause our future results, performance or achievements to differ significantly from that expressed or implied by such forward-looking statements. You can identify these forward-looking statements by the use of words such as “should,” “expect,” “anticipate,” “estimate,” “target,” “may,” “project,” “intend,” “plan,” “believe” and other words and terms of similar meaning and expression in connection with any discussion of future operating or financial performance. Important factors that could cause or contribute to such differences include risks relating to: our ability to successfully develop duvakitug for the treatment of ulcerative colitis (UC) and Crohn’s disease (CD) as well as fibrostenotic Crohn’s disease and hidradenitis suppurativa; our ability to successfully compete in the marketplace, including our ability to develop and commercialize additional pharmaceutical products; our ability to successfully execute on our Pivot to Growth strategy, including to expand our innovative and biosimilar medicines pipeline and to profitably commercialize our innovative medicines and biosimilar portfolio, whether organically or through business development; our significant indebtedness; our business and operations in general; compliance, regulatory and litigation matters; financial, economic and other risks; and other factors discussed in our Quarterly Report on Form 10-Q for the second quarter of 2026 and in our Annual Report on Form 10-K for the year ended December 31, 2025, including in the sections captioned “Risk Factors” and “Forward-Looking Statements.” Forward-looking statements speak only as of the date on which they are made, and we assume no obligation to update or revise any forward-looking statements.
October 19, 2026
Share
-
[](https://www.facebook.com/sharer.php?u=https://www.sanofi.com/en/media-room/press-releases/2026/2026-10-19-10-30-00-3383205&t=Press Release: Sanofi breaks ground on new state-of-the-art insulin manufacturing facility in Germany)
-
[](https://twitter.com/share?url=https://www.sanofi.com/en/media-room/press-releases/2026/2026-10-19-10-30-00-3383205&text=Press Release: Sanofi breaks ground on new state-of-the-art insulin manufacturing facility in Germany)
-
[](https://www.linkedin.com/shareArticle?mini=true&url=https://www.sanofi.com/en/media-room/press-releases/2026/2026-10-19-10-30-00-3383205&title=Press Release: Sanofi breaks ground on new state-of-the-art insulin manufacturing facility in Germany)
Sanofi breaks ground on new state-of-the-art insulin manufacturing facility in Germany
Paris and Frankfurt, October 19, 2****026. Sanofi today broke ground on a new state-of-the-art insulin manufacturing facility at its BioCampus in Frankfurt, Germany. The new facility will bring a new generation of insulin production to one of Sanofi’s largest integrated research and manufacturing sites, strengthening Sanofi’s long-term ability to provide a reliable supply of insulin to millions of people living with diabetes around the world.
Prime Minister of the State of Hesse Boris Rhein and Mayor of Frankfurt Mike Josef joined Belén Garijo, Chief Executive Officer of Sanofi, Brendan O’Callaghan, Sanofi Executive Vice President, Manufacturing & Supply and Chairman of the Supervisory Board of Sanofi in Germany, and Madeleine Roach, Country President of Sanofi in Germany, at today’s groundbreaking ceremony.
“Millions of people around the world rely on insulin every day, and our commitment to them is for the long term. With this new facility, we are investing in the next generation of insulin manufacturing in Europe, building on more than a century of expertise and a strong industrial footprint in Frankfurt. Maintaining the right conditions for investment and innovation will be essential to Europe’s future competitiveness,” said **Belén Garijo,**Chief Executive Officer, Sanofi.
Investing in the next generation of insulin manufacturing
The new facility will be built on a 36,000-square-meter footprint at the Sanofi BioCampus in Frankfurt, equivalent to approximately five football fields. Designed to meet the highest standards of quality and automation, it will leverage advanced digital technologies and artificial intelligence across manufacturing and quality processes.
Full production of insulin active pharmaceutical ingredient is planned for 2032, once the facility is fully licensed. Building on more than a century of manufacturing expertise in Frankfurt, the facility will combine advanced manufacturing technologies, automation and digital capabilities. Once operational, it will be among the largest and most advanced insulin manufacturing facilities in Europe and an important part of Sanofi’s global insulin supply network.
The Frankfurt BioCampus covers the entire insulin manufacturing value chain, from active pharmaceutical ingredient production to filling, device assembly, and packaging, with around 4,000 employees dedicated to insulin and approximately 20 insulin products supplied from the site.
A long-term commitment to people living with diabetes
More than 500 million people worldwide live with diabetes, and millions rely on insulin every day. With the number of people living with diabetes expected to rise to more than 800 million by 2050, and as the global insulin supply landscape evolves, reliable long-term insulin supply will remain essential.
Sanofi currently supplies insulin to approximately 15 million people in more than 100 countries each year. The new Frankfurt facility reflects Sanofi’s long-term commitment to people who rely on insulin every day and will help ensure its global manufacturing network is equipped to serve patients for decades to come.
Sanofi announced its plans for the new Frankfurt facility in August 2024. In September 2026, the European Commission approved public support from the German Federal Government, the State of Hesse and the City of Frankfurt under the European Union’s state aid framework.

Rendering of the new insulin manufacturing facility at Sanofi BioCampus Frankfurt.
About Sanofi Sanofi is an R&D driven, AI-powered biopharma company committed to improving people’s lives and delivering compelling growth. We apply our deep understanding of the immune system to invent medicines and vaccines that treat and protect millions of people around the world, with an innovative pipeline that could benefit millions more. Our team is guided by one purpose: we chase the miracles of science to improve people’s lives; this inspires us to drive progress and deliver positive impact for our people and the communities we serve, by addressing the most urgent healthcare, environmental, and societal challenges of our time. Sanofi is listed on EURONEXT: SAN and NASDAQ: SNY
Sanofi Global Media Relations Sandrine Guendoul | +33 6 25 09 14 25 | [email protected] Evan Berland | +1 215 432 0234 | [email protected] Léo Le****Bourhis | +33 6 75 06 43 81 | [email protected] Victor Rouault | +1 617 356 4751 | [email protected] Timothy Gilbert | +1 516 521 2929 | [email protected] Léa Ubaldi| +33 6 30 19 66 46 | [email protected] Laura Romby| +33 6 74 16 74 29 | [email protected] Ekaterina Pesheva| +1 410 926 6780 | [email protected]
Sanofi Germany Media Relations Stefan Dietrich| +49 69 305 30165 | [email protected] Miriam Liebelt-Henn| +49 69 305 5085 | [email protected] Ralph Hug| +49 69 305 15907 | [email protected]
Sanofi Investor Relations Thomas Kudsk Larsen | +44 7545 513 693 | [email protected] Alizé****Kaisserian | +33 6 47 04 12 11 | [email protected] Keita Browne | +1 781 249 1766 | [email protected] Nathalie Pham | +33 7 85 93 30 17 | [email protected] Nina Goworek| +1 908 569 7086 | [email protected] Thibaud Châtelet | +33 6 80 80 89 90 | [email protected] Yun Li | +33 6 84 00 90 72 | [email protected] SanofiForward-Looking Statements This press release contains forward-looking statements within the meaning of applicable securities laws, including the Private Securities Litigation Reform Act of 1995, as amended. Forward-looking statements are statements that are not historical facts. These statements include projections and estimates and their underlying assumptions regarding the marketing and other potential of the product; regarding potential future events and revenues from the product. Words such as “expect,” “anticipate,” “believe,” “intend,” “estimate,” “plan,” “can,” “contemplate,” “could,” “is designed to,” “may,” “might,” “potential,” “objective,” "attempt," “target,” “project,” "strategy," "strive," "desire," “predict,” “forecast,” “ambition,” “guideline,” "seek," “should,” “will,” "goal," or the negative of these and similar expressions are intended to identify forward-looking statements. Although Sanofi’s management believes that the expectations reflected in such forward-looking statements are reasonable, investors are cautioned that forward-looking information and statements are subject to various risks and uncertainties, many of which are difficult to predict and generally beyond the control of Sanofi, that could cause actual results and developments to differ materially from those expressed in, or implied or projected by, the forward-looking information and statements. These risks, uncertainties and assumptions include among other things, unexpected regulatory actions or delays, or government regulation generally, that could affect the availability or commercial potential of the product, the fact that product may not be commercially successful; authorities’ decisions regarding whether and when to approve a product candidate; political pressure in the United States to mandate lower drug prices including “most favored nation” pricing for State Medicaid programs; the uncertainties inherent in research and development, including future clinical data and analysis of existing clinical data relating to the product, including post marketing, unexpected safety, quality or manufacturing issues; competition in general; risks associated with intellectual property and any related pending or future litigation and the ultimate outcome of such litigation, and volatile economic and market conditions, and the impact that global crises may have on us, our customers, suppliers, vendors, and other business partners, and the financial condition of any one of them, as well as on our employees and on the global economy as a whole. The risks and uncertainties also include the uncertainties discussed or identified in the public filings with the SEC and the French Markets Authority (AMF) made by Sanofi, including those listed under “Risk Factors” and “Cautionary Statement Regarding Forward-Looking Statements” in Sanofi’s annual report on Form 20-F for the year ended December 31, 2025 or contained in our periodic reports on Form 6-K. Other than as required by applicable law, Sanofi does not undertake any obligation to update or revise any forward-looking information or statements. In light of these risks, uncertainties and assumptions, you should not place undue reliance on any forward-looking statements contained herein.
October 16, 2026
Share
-
[](https://www.facebook.com/sharer.php?u=https://www.sanofi.com/en/media-room/press-releases/2026/2026-10-16-06-35-00-3382260&t=Press release: Sanofi to become major partner of the Tour de France)
-
[](https://twitter.com/share?url=https://www.sanofi.com/en/media-room/press-releases/2026/2026-10-16-06-35-00-3382260&text=Press release: Sanofi to become major partner of the Tour de France)
-
[](https://www.linkedin.com/shareArticle?mini=true&url=https://www.sanofi.com/en/media-room/press-releases/2026/2026-10-16-06-35-00-3382260&title=Press release: Sanofi to become major partner of the Tour de France)
Sanofi to become major partner of the Tour de France
Paris, October 16, 2026. Sanofi and Tour de France today announced that Sanofi will become the first company ever to sponsor the white jersey for both the Tour de France and the Tour de France Femmes avec Zwift.
The white jersey awards the best rider under 25 in the general classification, recognizing emerging talent at the highest level of the sport. This sponsorship brings together two institutions born in France and now recognized around the world: the Tour de France, first held in 1903, and Sanofi, a French company committed to improving people's lives through innovation. Both share a commitment to excellence and endurance, as well as the belief that progress comes from pushing boundaries.
Each year, 10 to 12 million spectators line the Tour de France route, while the race is broadcast across 190 countries and reaches an estimated 150 million TV viewers in Europe. Starting in 2027, Sanofi will build on the Tour’s reach to engage the public on health and science education through initiatives developed in collaboration with healthcare professionals and patient organizations. These programs will take place year-round in stage towns, fan zones, along the route, and online, focusing on prevention and patient support.
“The Tour de France has a unique ability to reach millions of people across France and around the world. We are harnessing this extraordinary reach in service of health,” said Belén Garijo, Chief Executive Officer of Sanofi. “Just like a cycling team in the peloton, where riders succeed by working together, we believe scientific progress is also a collective effort. Through the power of sport, we can connect with people, raise awareness of diseases and prevention, and make health information more accessible.”
"The White Jersey embodies the next generation of cycling at the highest level and distinguishes young riders who are already establishing themselves among the best," said Yann Le Moënner, Chief Executive Officer at A.S.O. "We are delighted to welcome Sanofi as an official partner from 2027, both on the Tour de France and the Tour de France Femmes avec Zwift. Together, we share a commitment to celebrating talent, progress, and the next generation."
Sanofi is expanding the power of sports partnerships, turning global reach into meaningful health impact. Previously, Sanofi joined as a partner of the Paris 2024 Olympic and Paralympic Games, and the 24 Hours of Le Mans, raising public awareness of meningitis and diabetes in 2025 and 2026. The Tour de France partnership builds on that journey, continuing a commitment set in motion years ago.
About Sanofi Sanofi is an R&D driven, AI-powered biopharma company committed to improving people’s lives and delivering compelling growth. We apply our deep understanding of the immune system to invent medicines and vaccines that treat and protect millions of people around the world, with an innovative pipeline that could benefit millions more. Our team is guided by one purpose: we chase the miracles of science to improve people’s lives; this inspires us to drive progress and deliver positive impact for our people and the communities we serve, by addressing the most urgent healthcare, environmental, and societal challenges of our time. Sanofi is listed on EURONEXT: SAN and NASDAQ: SNY.
About the Tour de France Amaury Sport Organisation is a creator and organizer of world-class international sporting events. Specializing in “out-of-stadium” sports, A.S.O. has in-house expertise across every aspect of event delivery, media operations, and the commercial development of sporting competitions. The company operates its own portfolio of events while also leveraging its skills and experience at major sporting events around the world. Each year, A.S.O. organizes more than 300 days of competition across approximately 100 events in 35 countries. Headquartered in Paris, the company relies on a network of international subsidiaries in the United Kingdom, Germany, Spain, Belgium, Norway, and Saudi Arabia. Active across a wide range of sports, A.S.O. organizes a number of prestigious events, including the Tour de France, Paris-Roubaix Hauts-de-France, Liège-Bastogne-Liège, La Vuelta, and the Lidl Deutschland Tour, as well as amateur cycling events such as L’Étape du Tour. In motorsports, A.S.O. organizes the Dakar and promotes the World Rally-Raid Championship (W2RC). A.S.O. also organizes and develops a wide range of running, trail, mountain biking, and gravel events around the world, bringing together more than 400,000 participants in 2025. The company is also recognized for its expertise in sports content production and distribution. Amaury Sport Organisation is a subsidiary of Groupe Amaury, a media and sports group and the owner of L’Équipe.
Media Relations Sandrine Guendoul | + 33 6 25 09 14 25 | [email protected] Léo Le Bourhis | + 33 6 75 06 43 81 | [email protected] Léa Ubaldi |+33 6 30 19 66 46**|** [email protected] Laura Romby |+33 6 74 16 74 29**|**[email protected]
October 6, 2026
Share
-
[](https://www.facebook.com/sharer.php?u=https://www.sanofi.com/en/media-room/press-releases/2026/2026-10-06-05-30-00-3375120&t=Press Release : Availability of the aide-mémoire for Q3 2026 results)
-
[](https://twitter.com/share?url=https://www.sanofi.com/en/media-room/press-releases/2026/2026-10-06-05-30-00-3375120&text=Press Release : Availability of the aide-mémoire for Q3 2026 results)
-
[](https://www.linkedin.com/shareArticle?mini=true&url=https://www.sanofi.com/en/media-room/press-releases/2026/2026-10-06-05-30-00-3375120&title=Press Release : Availability of the aide-mémoire for Q3 2026 results)
Availability of the aide-mémoire for Q3 2026 results
Paris, France – October 6, 2026. Sanofi announced today the availability of the aide-mémoire for Q3 2026 results on the "Investors" page of sanofi.com:
Prepared each quarter, this document is intended to support financial modelling of the quarterly results. It covers non-comparable items, foreign currency impact, and share count. Sanofi's Q3 2026 results will be published on October 30, 2026.
About Sanofi Sanofi is an R&D driven, AI-powered biopharma company committed to improving people’s lives and delivering compelling growth. We apply our deep understanding of the immune system to invent medicines and vaccines that treat and protect millions of people around the world, with an innovative pipeline that could benefit millions more. Our team is guided by one purpose: we chase the miracles of science to improve people’s lives; this inspires us to drive progress and deliver positive impact for our people and the communities we serve, by addressing the most urgent healthcare, environmental, and societal challenges of our time.
Sanofi is listed on EURONEXT: SAN and NASDAQ: SNY.
Media Relations Sandrine Guendoul | +33 6 25 09 14 25 | [email protected] Evan Berland | +1 215 432 0234 | [email protected] Timothy Gilbert | +1 516 521 2929 | [email protected] Léo Le Bourhis | +33 6 75 06 43 81 | [email protected] Victor Rouault | +33 6 70 93 71 40 | [email protected] Léa Ubaldi| +33 6 30 19 66 46 | [email protected] Ekaterina Pesheva | +1 410 926 6780 | [email protected]
Investor Relations Thomas Kudsk Larsen | +44 7545 513 693 | [email protected] Alizé Kaisserian | +33 6 47 04 12 11 | [email protected] Keita Browne | +1 781 249 1766 | [email protected] Nathalie Pham | +33 7 85 93 30 17 | [email protected] Nina Goworek| +1 908 569 7086 | [email protected] Thibaud Châtelet | +33 6 80 80 89 90 | [email protected] Yun Li | +33 6 84 00 90 72 | [email protected]
Forward-looking statements
This press release contains forward-looking statements within the meaning of applicable securities laws, including the Private Securities Litigation Reform Act of 1995, as amended.
Forward-looking statements are statements that are not historical facts. These statements include projections and estimates and their underlying assumptions, statements regarding plans, objectives, intentions, and expectations with respect to future financial results, events, operations, services, product development and potential, and statements regarding future events and economic performance. Words such as “expect,” “anticipate,” “believe,” “intend,” “estimate,” “plan,” “can,” “contemplate,” “could,” “is designed to,” “may,” “might,” “potential,” “objective,” "attempt," “target,” “project,” "strategy," "strive," "desire," “predict,” “forecast,” “ambition,” “guideline,” "seek," “should,” “will,” "goal," or the negative of these, and similar expressions are intended to identify forward-looking statements.
Although Sanofi’s management believes that the expectations reflected in such forward-looking statements are reasonable, investors are cautioned that forward-looking information and statements are subject to various risks and uncertainties, many of which are difficult to predict and generally beyond the control of Sanofi, that could cause actual results and developments to differ materially from those expressed in, or implied or projected by, the forward-looking information and statements. These risks and uncertainties include among other things, the uncertainties inherent in research and development, future clinical data and analysis, including post marketing, decisions by regulatory authorities, such as the U.S Food and Drug Administration or the European Medicines Agency, regarding whether and when to approve any drug, device or biological application that may be filed for any such product candidates as well as their decisions regarding labelling and other matters that could affect the availability or commercial potential of such product candidates; the fact that product candidates if approved may not be commercially successful; unexpected regulatory actions or delays, or government regulation generally; authorities’ decisions regarding whether and when to approve a product candidate; political pressure in the United States to mandate lower drug prices including “most favored nation” pricing for State Medicaid programs; the future approval and commercial success of therapeutic alternatives; Sanofi’s ability to benefit from external growth opportunities, to complete related transactions and/or obtain regulatory clearances, including future clinical data and analysis of existing clinical data relating to the product, including post marketing, unexpected safety, quality or manufacturing issues, competition in general; risks associated with intellectual property and any related pending or future litigation and the ultimate outcome of such litigation; trends in exchange rates and prevailing interest rates, volatile economic and market conditions, cost containment initiatives and subsequent changes thereto, and the impact that global crises may have on us, our customers, suppliers, vendors, and other business partners, and the financial condition of any one of them, as well as on our employees and on the global economy as a whole. The risks and uncertainties also include the uncertainties discussed or identified in the public filings with the SEC and the French Markets Authority (AMF) made by Sanofi, including those listed under “Risk Factors” and “Cautionary Statement Regarding Forward-Looking Statements” in Sanofi’s annual report on Form 20-F for the year ended December 31, 2025 or contained in our periodic reports on Form 6-K. Other than as required by applicable law, Sanofi does not undertake any obligation to update or revise any forward-looking information or statements. In light of these risks, uncertainties and assumptions, you should not place undue reliance on any forward-looking statements contained herein.
Press Release Sanofi and Regeneron expand global Alliance with multiple next-generation, long-acting immunology antibodies
• REGN20423, a clinical-stage long-acting IL-13 monoclonal antibody invented and developed by Regeneron, is added to the Alliance, along with a long-acting IL-4xIL-13 bispecific and two other long-acting pre-clinical antibodies from Regeneron
• Regeneron to receive $1 billion upfront, with potential for up to an additional $7 billion in future milestone payments; companies to equally share development and commercialization costs, as well as any future profits
• Sanofi and Regeneron to host a conference call for investors and analysts today at 14:00 CET/8:00am ET
Paris and Tarrytown, NY, October 1, 2026. Sanofi and Regeneron Pharmaceuticals, Inc. today announce an expansion of their longstanding antibody collaboration, adding multiple next-generation, long-acting antibodies to the Alliance that has jointly established Dupixent® (dupilumab) as the world-leading treatment for diseases driven by type 2 inflammation.
October 1, 2026
Share
-
[](https://www.facebook.com/sharer.php?u=https://www.sanofi.com/en/media-room/press-releases/2026/2026-10-01-05-00-00-3372517&t=Press Release: Sanofi and Regeneron expand global Alliance with multiple next-generation, long-acting immunology antibodies)
-
[](https://twitter.com/share?url=https://www.sanofi.com/en/media-room/press-releases/2026/2026-10-01-05-00-00-3372517&text=Press Release: Sanofi and Regeneron expand global Alliance with multiple next-generation, long-acting immunology antibodies)
-
[](https://www.linkedin.com/shareArticle?mini=true&url=https://www.sanofi.com/en/media-room/press-releases/2026/2026-10-01-05-00-00-3372517&title=Press Release: Sanofi and Regeneron expand global Alliance with multiple next-generation, long-acting immunology antibodies)
Sanofi and Regeneron expand global Alliance with multiple next-generation, long-acting immunology antibodies
-
REGN20423, a clinical-stage long-acting IL-13 monoclonal antibody invented and developed by Regeneron, is added to the Alliance, along with a long-acting IL-4xIL-13 bispecific and two other long-acting pre-clinical antibodies from Regeneron
-
Regeneron to receive $1 billion upfront, with potential for up to an additional $7 billion in future milestone payments; companies to equally share development and commercialization costs, as well as any future profits
-
Sanofi and Regeneron to host a conference call for investors and analysts today at 14:00 CET/8:00am ET
Paris and Tarrytown, NY, October 1, 2026. Sanofi and Regeneron Pharmaceuticals, Inc. today announce an expansion of their longstanding antibody collaboration, adding multiple next-generation, long-acting antibodies to the Alliance that has jointly established Dupixent® (dupilumab) as the world-leading treatment for diseases driven by type 2 inflammation. The agreement builds on the companies' more than 20-year collaboration, through which more than 1.5 million people are currently receiving Dupixent across nine indications, making it one of the most widely used antibody medicines in the world.
“This is a deliberate first step in igniting Sanofi’s innovation engine. Our longstanding Alliance with Regeneron has transformed the treatment landscape for millions of patients living with diseases driven by type 2 inflammation and created one of the world's leading immunology businesses,” said Belén Garijo, Chief Executive Officer of Sanofi. “By deepening our collaboration, we will make rapid progress in creating the next generation of meaningful therapies for patients with immune-mediated diseases, while contributing to Sanofi’s long-term future.”
Under the expanded license and collaboration agreement, the companies will co-develop and co-commercialize four new long-acting, Regeneron-invented antibodies targeting interleukin-13 (IL-13), IL-4xIL-13 bispecific, interleukin-4 (IL-4) and interleukin-4 receptor alpha (IL-4Rα). IL-13 antibody REGN20423 is currently in a phase 1 clinical study for atopic dermatitis, and the other three antibodies are expected to enter clinical studies in 2027. Regeneron will also have the option to include in the collaboration Sanofi’s lunsekimig, an investigational bispecific Nanobody® VHH therapy targeting TSLP and IL-13, exercisable upon completion of its phase 3 studies for chronic obstructive pulmonary disease.
“The Regeneron-Sanofi Alliance has been one of the most productive in biopharma history. This agreement builds on that foundation to bring the next generation of immunology medicines to patients even faster,” said Leonard S. Schleifer, MD, PhD, Board co-Chair, President and Chief Executive Officer of Regeneron. “By expanding our Alliance, we are positioning promising new long-acting antibodies for the kind of rapid, global impact that our shared work on Dupixent has already achieved.”
Under the terms of the agreement, Regeneron will receive an upfront payment of $1 billion from Sanofi, with the potential for development, regulatory and commercial milestone payments of up to an additional $7 billion. The companies will share development and commercialization costs for the new programs and will split future profits from these potential products 50:50 on a global basis. Regeneron will lead research and development activities, and Sanofi will lead global commercial efforts. The existing profit-sharing agreement regarding Dupixent will not change.
“The companies’ clinical and commercial Alliance dates to 2003 and has resulted in multiple approved medicines to date, including Dupixent, which has redefined the standard of care for people with type 2 inflammatory diseases and is now one of the most widely used antibodies for any disease, with over 1.5 million active patients worldwide,” said George D. Yancopoulos, MD, PhD, Board co-Chair, President and Chief Scientific Officer at Regeneron, and a principal inventor of Dupixent. “By combining Regeneron’s world-class scientific discovery and antibody development expertise with Sanofi’s global capabilities and reach, we hope to once again deliver the next wave of innovation in immunology.”
The companies have settled their prior collaboration-related litigation.
Conference call for investors and analysts Sanofi and Regeneron will host a conference call for investors and analysts today at 14:00 CET/8:00am ET. A presentation will be available for download from the Investor Relations section of sanofi.com and regeneron.com when the conference call starts.
Participants may access the conference call via webcast on the ‘Upcoming Events’ page of Sanofi’s website at https://www.sanofi.com/en/investors/news-events/upcoming-events, tab ‘Presentations' and on the 'Investors and Media' page of Regeneron's website at https://investor.regeneron.com/events-and-presentations. To participate via telephone, please register in advance at this link.
About Dupixent Dupixent, which was invented using Regeneron’s proprietary VelocImmune® technology, is a fully human monoclonal antibody that inhibits the signaling of the interleukin-4 (IL-4) and interleukin-13 (IL-13) pathways and is not an immunosuppressant. The Dupixent development program has shown significant clinical benefit and a decrease in type 2 inflammation in phase 3 studies, establishing that IL-4 and IL-13 are two of the key and central drivers of the type 2 inflammation that plays a major role in multiple related and often co-morbid diseases.
Dupixent has received regulatory approvals in more than 60 countries in one or more indications including certain patients with atopic dermatitis, asthma, chronic rhinosinusitis with nasal polyps, eosinophilic esophagitis, prurigo nodularis, chronic spontaneous urticaria, chronic obstructive pulmonary disease, bullous pemphigoid, and allergic fungal rhinosinusitis in different age populations. In addition to the currently approved indications, Sanofi and Regeneron are studying dupilumab in a broad range of diseases driven by type 2 inflammation or other allergic processes in phase 3 studies, including chronic pruritus of unknown origin. These potential uses of dupilumab are currently under clinical investigation, and the safety and efficacy in these conditions have not been fully evaluated by any regulatory authority.
About Regeneron
Regeneron (NASDAQ: REGN) is a leading biotechnology company that invents, develops and commercializes life-transforming medicines for people with serious diseases. Founded and led by physician-scientists, our unique ability to repeatedly and consistently translate science into medicine has led to numerous approved treatments and product candidates in development, most of which were homegrown in our laboratories. Our medicines and pipeline are designed to help patients with eye diseases, allergic and inflammatory diseases, cancer, cardiovascular and metabolic diseases, neurological diseases, hematologic conditions, infectious diseases, and rare diseases.
Regeneron pushes the boundaries of scientific discovery and accelerates drug development using our proprietary technologies, such as VelociSuite®, which produces optimized fully human antibodies and new classes of bispecific antibodies. We are shaping the next frontier of medicine with data-powered insights from the Regeneron Genetics Center® and pioneering genetic medicine platforms, enabling us to identify innovative targets and complementary approaches to potentially treat or cure diseases.
September 22, 2026
Share
-
[](https://www.facebook.com/sharer.php?u=https://www.sanofi.com/en/media-room/press-releases/2026/2026-09-22-11-48-50-3366209&t=An Open Letter from the Chairs of AstraZeneca, Boehringer Ingelheim, Chiesi Group, Ipsen, GSK, Novo, Novartis, Roche, and Sanofi)
-
[](https://twitter.com/share?url=https://www.sanofi.com/en/media-room/press-releases/2026/2026-09-22-11-48-50-3366209&text=An Open Letter from the Chairs of AstraZeneca, Boehringer Ingelheim, Chiesi Group, Ipsen, GSK, Novo, Novartis, Roche, and Sanofi)
-
[](https://www.linkedin.com/shareArticle?mini=true&url=https://www.sanofi.com/en/media-room/press-releases/2026/2026-09-22-11-48-50-3366209&title=An Open Letter from the Chairs of AstraZeneca, Boehringer Ingelheim, Chiesi Group, Ipsen, GSK, Novo, Novartis, Roche, and Sanofi)
Europe Is Losing the Pharma Investment Race — But the Comeback Is Within Reach
We are proud Europeans. We serve as Chairs of companies born from European science, rooted in laboratories across Belgium, Denmark, France, Germany, Italy, Spain, Sweden, Switzerland, the UK, and beyond. Our duty is to safeguard our companies’ future so that we can continue to discover and develop life-changing medicines for patients.
The pharmaceutical sector is one of our continent's great post-war achievements. Built on investment in science, world-class universities, and the determination to discover medicines that change lives. Europe gave the world vaccines, pioneered treatments for heart disease, and laid the foundation for today's cancer treatments – transforming public health.
Europe’s choice to incentivise discovery built one of our most productive and research-intensive sectors,supportingmillions of highly skilled jobs, and generating an EU trade surplus of over €220 billion. The uptake of innovative medicines in Europe returns almost sixfold to the economy through lower hospitalisation costs and healthier working lives. Our sector powers a vast ecosystem spanning discovery, development and manufacturing, while strengthening health systems to manage rising burdens of disease and ageing populations.
But this hard-won****inheritance is at risk. In our boardrooms, we see Europe losing ground to global competition. Over $600 billion in pharmaceutical investment has been announced in the US and China in the last two years alone. European governments must create conditions that attract investment in next-generation medicines before it’s too late.
**Europe’s alarm bells are ringing.**As Mario Draghi warned, without urgent action, strategic sectors like pharmaceuticals face a ‘slow agony’ of decline. In 1990, Europe accounted for 43% of global pharmaceutical R&D. Today, it is 31% and falling. Europe's share of commercial clinical trials, which provide vital revenue for public hospitals and improve patient outcomes, has halved in a decade to 9%. China has overtaken Europe in clinical trials, pharmaceutical patents, and the development of new medicines.
For patients, the consequences are clear: around 40% of newly approved therapiesneverreach European patients. Among those that do, patients wait nearly 600 days for treatment. Cancer survival in Europe trails the US1. Too many patients are diagnosed late or treated with medicines that fall short of the standard recommended by medical guidelines.
This is the result of decades in which Europe treated medicines as a cost to suppress rather than one of the best investments a government can make. Outdated systems constrain the use of innovative medicines, arbitrarily cap budgets, and fail to adjust spending for inflation despite rising patient need. Government policies send a powerful signal about how innovation is valued and the priority placed on ensuring that patients can access it.
The message to innovators has been stark: Europe does not value what you do.
The decisions we take have consequences today and for years to come. A single innovative medicine takes more than a decade and around €3 billion of at-risk investment before reaching a patient, with only one or two medicines emerging from every 10,000 candidates synthesised in laboratories. Few sectors face comparable risk over such long horizons. That commitment requires a market that rewards it.
It is becoming more urgent to change course. European leaders must recognise the danger. The EU can play an enabling role by accelerating clinical trials, protecting intellectual property, and adopting sensible digital policies. Crucially, the EU could also provide fiscal flexibility to Member States investing in health and innovative medicines, recognising these returns take time to materialise.
ButEU action alone is not enough. Thedecisive levers lie with national governments: how much to invest in health budgets, how quickly new medicines are assessed and funded, and how to modernise healthcare to better prevent, detect and treat disease.
We ask national leaders to work with us to reverse Europe’s declining competitiveness, unleash a new era of medical discovery, and secure health sovereignty. We recognise the fiscal pressures many face. But just like defence or energy, modern medicines should be treated as vital infrastructure and not be left to others to provide.
Opportunities are on Europe’s doorstep if governments rebalance decades of underinvestment in innovative medicines and modernise value frameworks to reflect the total value of what these treatments bring to patients, health systems and the economy. In clinical trials alone, Europe could unlock €53 billion and 82,000 jobs by closing the gap with China and the US.
Europe’s story does not have to be one of decline and dependency; it can be one of renewal and resilience. That choice belongs to national leaders and all of us as citizens. If we fail to act with ambition, our future will be built elsewhere. But if we choose to invest in health and medicines as strategic assets, Europe will not merely catch up – it can set the pace of global innovation once again and enable Europeans to live longer, healthier lives.
1 World Health Organization, International Agency for Research on Cancer, GLOBOCAN 2022 portal, accessed 8 April 2026 via: https://gco.iarc.who.int/en
Paris, September 14, 2026. Sanofi and Cheplapharm, a European leader in well-established medicines, today announced their intention to create a strategic partnership under which Cheplapharm would take over from Sanofi a selection of 20 mature medicines and three manufacturing sites worldwide. In return, Sanofi will receive a 26.4% equity stake in Cheplapharm, building on a collaboration that started in 2014.
The partnership is based on a shared conviction: that innovative medicines and certain mature medicines have different needs and should benefit from operating models tailored to their specific manufacturing, regulatory and commercial requirements. Cheplapharm’s specialized expertise will ensure these medicines continue to meet patients’ needs throughout the next stage of their lifecycle.
“Our multi-year journey to simplify our mature portfolio has enabled us to focus on innovation while ensuring mature medicines continue to reach patients who need them. Cheplapharm has been a trusted partner for more than a decade and this transaction significantly builds on its prior acquisitions from Sanofi’s mature medicines portfolio.
September 14, 2026
Share
-
[](https://www.facebook.com/sharer.php?u=https://www.sanofi.com/en/media-room/press-releases/2026/2026-09-14-13-03-56-3361178&t=Press Release: Sanofi and Cheplapharm to create new strategic partnership in mature medicines)
-
[](https://twitter.com/share?url=https://www.sanofi.com/en/media-room/press-releases/2026/2026-09-14-13-03-56-3361178&text=Press Release: Sanofi and Cheplapharm to create new strategic partnership in mature medicines)
-
[](https://www.linkedin.com/shareArticle?mini=true&url=https://www.sanofi.com/en/media-room/press-releases/2026/2026-09-14-13-03-56-3361178&title=Press Release: Sanofi and Cheplapharm to create new strategic partnership in mature medicines)
Sanofi and Cheplapharm to create new strategic partnership in mature medicines
Paris**,****September 14,**2026. Sanofi and Cheplapharm, a European leader in well-established medicines, today announced their intention to create a strategic partnership under which Cheplapharm would take over from Sanofi a selection of 20 mature medicines and three manufacturing sites worldwide. In return, Sanofi will receive a 26.4% equity stake in Cheplapharm, building on a collaboration that started in 2014. The partnership is based on a shared conviction: that innovative medicines and certain mature medicines have different needs and should benefit from operating models tailored to their specific manufacturing, regulatory and commercial requirements. Cheplapharm's specialized expertise will ensure these medicines continue to meet patients' needs throughout the next stage of their lifecycle.
"Our multi-year journey to simplify our mature portfolio has enabled us to focus on innovation while ensuring mature medicines continue to reach patients who need them. Cheplapharm has been a trusted partner for more than a decade and this transaction significantly builds on its prior acquisitions from Sanofi's mature medicines portfolio. This new partnership, together with our equity stake in Cheplapharm, underscores our commitment to ensuring patients continue to benefit from today’s essential medicines while also pursuing tomorrow’s breakthroughs," said Thomas Grenier, Executive Vice President, General Medicines, Sanofi.
"This partnership marks a major milestone for Cheplapharm. Through this project, we are incorporating products that complement our extensive portfolio, as well as the expertise and manufacturing capabilities required to produce a flagship product, Lovenox®/Clexane®. This represents a long-term pharmaceutical and industrial commitment: to invest in our sites and their expertise, to preserve rare skills, and to ensure the long-term availability of these treatments for patients." "We are proud to pursue this ambition alongside Sanofi," said Edeltraud Laferand Sebastian Braun, both Co-CEOs of Cheplapharm.
As part of the project, three manufacturing sites would be transferred to Cheplapharm: Csanyikvölgy in Hungary (c.400 employees), Jurong in Singapore (c.100 employees), and Ploërmel in France (c.65 employees). The teams would continue their activities with existing employment arrangements and collective agreements maintained. Sanofi and Cheplapharm will work closely together to ensure a smooth transition and continuity of supply in compliance with the highest manufacturing quality standards.
The commercial transfer of the medicine portfolio is planned to begin in the first quarter of 2027, followed by the transfer of the sites, subject to employee information and consultation procedures with employee representatives, regulatory approvals and customary closing conditions. The transaction is expected to be fully completed by the third quarter of 2027.
For Cheplapharm, this partnership represents an important step ensuring the continuity of its strategic growth. For Sanofi, it will enable the company to continue focusing its efforts on innovation, while supporting certain established medicines through the next stage of their lifecycle.
Financial considerations****for Sanofi The proposed transaction is not expected to have any impact on Sanofi’s financial guidance for 2026. The medicines being divested from Sanofi include Lovenox/Clexane (enoxaparin)1. Additional financial details are expected to be provided at a later stage.
[1] Excluding in the US.
About Sanofi Sanofi is an R&D driven, AI-powered biopharma company committed to improving people’s lives and delivering compelling growth. We apply our deep understanding of the immune system to invent medicines and vaccines that treat and protect millions of people around the world, with an innovative pipeline that could benefit millions more. Our team is guided by one purpose: we chase the miracles of science to improve people’s lives; this inspires us to drive progress and deliver positive impact for our people and the communities we serve, by addressing the most urgent healthcare, environmental, and societal challenges of our time. Sanofi is listed on EURONEXT: SAN and NASDAQ: SNY
About Cheplapharm Cheplapharm is a European family-owned pharmaceutical company based in Germany, specializing in well-established originator medicines. Driven by a long-term vision of sustainable growth, the Group has invested more than €6.2 billion since its inception, acquired nearly 100 products since 2015, and holds 3,440 marketing authorizations across 160 countries. Cheplapharm is the market leader in France and a leading European player in this market segment.
Media Relations Sandrine****Guendoul | +33 6 25 09 14 25 | [email protected] Evan Berland | +1 215 432 0234 | [email protected] Léo Le****Bourhis | +33 6 75 06 43 81 | [email protected] Léa Ubaldi| +33 6 30 19 66 46 | [email protected] Laura Romby| +33 6 74 16 74 29 | [email protected] Ekaterina****Pesheva | +1 410 926 6780 | [email protected] Victor Rouault | +1 617 356 4751 | [email protected] Timothy Gilbert | +1 516 521 2929 | [email protected]
Investor Relations Thomas Kudsk Larsen | + 44 7545 513 693 | [email protected] Alizé****Kaisserian | +33 6 47 04 12 11 | [email protected]
Keita Browne | +1 781 249 1766 | [email protected] Nathalie Pham | +33 7 85 93 30 17 | [email protected] Nina****Goworek | +1 908 569 7086 | [email protected] Thibaud Châtelet | +33 6 80 80 89 90 | [email protected] Yun Li | +33 6 84 00 90 72 | [email protected]
Press contact Cheplapharm Sandra****Ammara : +33 6 79 92 71 34 – [email protected]
Sanofi Forward-Looking Statements This press release contains forward-looking statements within the meaning of applicable securities laws, including the Private Securities Litigation Reform Act of 1995, as amended. Forward-looking statements are statements that are not historical facts. These statements include projections and estimates and their underlying assumptions, statements regarding plans, objectives, intentions, and expectations with respect to future financial results, events, operations, services, product development and potential, and statements regarding future events and economic performance. Words such as “expect,” “anticipate,” “believe,” “intend,” “estimate,” “plan,” “can,” “contemplate,” “could,” “is designed to,” “may,” “might,” “potential,” “objective,” "attempt," “target,” “project,” "strategy," "strive," "desire," “predict,” “forecast,” “ambition,” “guideline,” "seek," “should,” “will,” "goal," “outlook,” “guidance,” or the negative of these, and similar expressions are intended to identify forward-looking statements. Although Sanofi’s management believes that the expectations reflected in such forward-looking statements are reasonable, investors are cautioned that forward-looking information and statements are subject to various risks and uncertainties, many of which are difficult to predict and generally beyond the control of Sanofi, that could cause actual results and developments to differ materially from those expressed in, or implied or projected by, the forward-looking information and statements. These risks and uncertainties include among other things, the uncertainties inherent in research and development, future clinical data and analysis, including post marketing, decisions by regulatory authorities, such as the U.S Food and Drug Administration or the European Medicines Agency, regarding whether and when to approve any drug, device or biological application as well as their decisions regarding labelling and other matters that could affect the availability or commercial potential of such product candidates; the fact that product candidates if approved may not be commercially successful; unexpected regulatory actions or delays, or government regulation generally; authorities’ decisions regarding whether and when to approve a product candidate; political pressure in the United States to mandate lower drug prices including “most favored nation” pricing for State Medicaid programs; the future approval and commercial success of therapeutic alternatives; Sanofi’s ability to benefit from external growth opportunities, to complete capital markets or other transactions, including future clinical data and analysis of existing clinical data relating to the product, including post marketing, unexpected safety, quality or manufacturing issues, competition in general; risks associated with developing standalone businesses and with intellectual property, as well as any related pending or future litigation and the ultimate outcome of such litigation; and other risks associated with trends in exchange and interest rates, volatile economic, political and financial and market conditions, cost containment initiatives, and the impact that global crises may have. More specifically regarding the transaction described above, these risks and uncertainties include among other things the possibility that the transaction will not be completed, or if completed, will not be completed in the expected timeframe, an unexpected failure to satisfy the required closing conditions, or unexpected delays in meeting these requirements, the ability to obtain regulatory clearances, the possibility that the expected strategic benefits, synergies or opportunities from the transaction may not be realized, or may take longer to realize than expected. The risks and uncertainties also include the uncertainties discussed or identified in the public filings with the SEC and the French Markets Authority (AMF) made by Sanofi, including those listed under “Risk Factors” and “Cautionary Statement Regarding Forward-Looking Statements” in Sanofi’s annual report on Form 20-F for the year ended December 31, 2025 or contained in our periodic reports on Form 6-K. Other than as required by applicable law, Sanofi does not undertake any obligation to update or revise any forward-looking information or statements. In light of these risks, uncertainties and assumptions, you should not place undue reliance on any forward-looking statements contained herein. All trademarks mentioned in this press release are the property of the Sanofi group.
Paris, August 4, 2026. Sanofi today announced that the European Commission (EC) has approved an extension of the indication for MenQuadfi (Meningococcal Group A, C, W and Y conjugate vaccine) to include infants from six weeks of age to help protect against invasive meningococcal disease caused by Neisseria meningitidis serogroups A, C, W, and Y. MenQuadfi was previously approved in the EU for use in individuals aged 12 months and older. The expanded indication follows the positive opinion adopted by the Committee for Medicinal Products for Human Use on June 25, 2026.
Invasive meningococcal disease is a life-threatening bacterial infection that can progress rapidly, with patients potentially deteriorating from the onset of symptoms to death within 24 hours. Infants are among the populations at highest risk for invasive meningococcal disease, facing high rates of mortality and severe long-term complications, including limb amputation, hearing loss, and neurological damage. Even with appropriate treatment, invasive meningococcal disease carries a case fatality rate of approximately 10–15%, and up to 20% of survivors experience permanent complications.
August 4, 2026
Share
-
[](https://www.facebook.com/sharer.php?u=https://www.sanofi.com/en/media-room/press-releases/2026/2026-08-04-05-00-00-3338016&t=Press Release: Sanofi’s MenQuadfi approved in the EU for use in infants from age six weeks against invasive meningococcal disease)
-
[](https://twitter.com/share?url=https://www.sanofi.com/en/media-room/press-releases/2026/2026-08-04-05-00-00-3338016&text=Press Release: Sanofi’s MenQuadfi approved in the EU for use in infants from age six weeks against invasive meningococcal disease)
-
[](https://www.linkedin.com/shareArticle?mini=true&url=https://www.sanofi.com/en/media-room/press-releases/2026/2026-08-04-05-00-00-3338016&title=Press Release: Sanofi’s MenQuadfi approved in the EU for use in infants from age six weeks against invasive meningococcal disease)
Sanofi’s MenQuadfi approved in the EU for use in infants from age six weeks against invasive meningococcal disease
**Paris, August 4, 2026.**Sanofi today announced that the European Commission (EC) has approved an extension of the indication for MenQuadfi (Meningococcal Group A, C, W and Y conjugate vaccine) to include infants from six weeks of age to help protect against invasive meningococcal disease caused by Neisseria meningitidis serogroups A, C, W, and Y. MenQuadfi was previously approved in the EU for use in individuals aged 12 months and older. The expanded indication follows the positive opinion adopted by the Committee for Medicinal Products for Human Use on June 25, 2026.
Invasive meningococcal disease is a life-threatening bacterial infection that can progress rapidly, with patients potentially deteriorating from the onset of symptoms to death within 24 hours. Infants are among the populations at highest risk for invasive meningococcal disease, facing high rates of mortality and severe long-term complications, including limb amputation, hearing loss, and neurological damage. Even with appropriate treatment, invasive meningococcal disease carries a case fatality rate of approximately 10–15%, and up to 20% of survivors experience permanent complications. Although serogroup A is now rarely reported in the EU, serogroups C, W, and Y remain responsible for a significant share of invasive meningococcal disease cases across Europe, reinforcing the importance for broad protection against these four serogroups from an early age.
"Meningococcal disease moves fast and strikes the hardest in younger children. Having a product indicated across a broad age range is key to meeting public health needs — giving healthcare providers the flexibility to help protect infants within routine immunization schedules and increase vaccine coverage. The immunogenicity data for MenQuadfi in infants is robust and supports the usage with confidence in the EU," said Federico Martinon-Torres, Pediatrician and Clinical Researcher, Head of Pediatrics and Vaccine Research Unit at Hospital Clínico Universitario de Santiago in Spain and Principal Investigator of MET58.
With this approval, MenQuadfi provides healthcare professionals in the EU with an additional option for vaccinating infants against invasive meningococcal disease from as early as six weeks of age. This expanded indication, aligned with routine infant immunization schedules, is supported by MenQuadfi's demonstrated immunogenicity data.
"Offering protection for the EU's youngest children is at the heart of what we do — and this approval is a direct expression of that commitment. It reflects the scientific rigor behind this work, and it means healthcare providers now have an additional option to help protect infants against invasive meningococcal disease from the early weeks of life," said Bogdana Coudsy, Global Head of Medical, Vaccines, Sanofi.
This milestone embodies Sanofi's contribution, fighting against invasive meningococcal disease, a devastating disease, by expanding vaccine access to the most vulnerable populations across the EU.
About the MET58 pivotal study The EU approval is supported by comprehensive data from the MET58 pivotal clinical study, which evaluated the immunogenicity, safety, and tolerability of MenQuadfi in infants from six weeks of age.
About MenQuadfi MenQuadfi (Meningococcal Group A, C, W and Y conjugate vaccine) is indicated for active immunization of individuals six weeks of age and older against invasive meningococcal disease caused by Neisseria meningitidis serogroups A, C, W, and Y.
MenQuadfi benefits from a strong track record of clinical data in infants with more than 6,000 infants studied across 11 countries and multiple immunization schedules.
The new dose regimen approved for those starting vaccination from six weeks of age is aligned with routine pediatric vaccination schedules.
The approved dosing regimens include:
-
2+1 schedule for infants from six weeks of age, aligned with standard EU immunization schedules. Two doses (each 0.5mL) should be administered with an interval of at least two months. One dose (booster) should be given in the second year of life (from 12 months of age) and at least two months from the last dose.
-
For infants expected to be at increased risk of invasive meningococcal disease due to serogroup A exposure, a 3+1 schedule may be considered. Three doses primary series at two, four and six months followed by one booster dose from 12 months of age.
-
Single dose for individuals 12 months of age and older.
In infants, MenQuadfi can be co-administered with combined diphtheria - tetanus - acellular pertussis (DTaP) - inactivated poliovirus (IPV) - hepatitis B (HepB) - Haemophilus influenzae type b (Hib) vaccine (DTaP-IPV-HepB-Hib), rotavirus vaccine (live attenuated) and with 10-valent pneumococcal conjugate vaccine (PCV10).
The safety and immunogenicity profile have been established across a broad age range, from six weeks of age through adulthood. MenQuadfi is well tolerated, with a safety profile comparable to other MenACWY vaccines currently licensed.
The Paediatric Investigation Plan compliance statement has been received from the European Medicines Agency, marking the completion of all pediatric post-licensure commitments linked to MenQuadfi's initial marketing authorization.
MenQuadfi is approved in the EU, US, and multiple other countries.
About Sanofi Sanofi is an R&D driven, AI-powered biopharma company committed to improving people’s lives and delivering compelling growth. We apply our deep understanding of the immune system to invent medicines and vaccines that treat and protect millions of people around the world, with an innovative pipeline that could benefit millions more. Our team is guided by one purpose: we chase the miracles of science to improve people’s lives; this inspires us to drive progress and deliver positive impact for our people and the communities we serve, by addressing the most urgent healthcare, environmental, and societal challenges of our time. Sanofi is listed on EURONEXT: SAN and NASDAQ: SNY
Media Relations
Sandrine Guendoul | +33 6 25 09 14 25 | [email protected] Evan Berland | +1 215 432 0234 | [email protected] Léo Le Bourhis | +33 6 75 06 43 81 | [email protected] Victor Rouault | +1 617 356 4751 | [email protected] Timothy Gilbert | +1 516 521 2929 | [email protected] Léa Ubaldi| +33 6 30 19 66 46 | [email protected] Ekaterina Pesheva | +1 410 926 6780 | [email protected] Laura Romby| +33 6 74 16 74 29 | [email protected]
Investor Relations Thomas Kudsk Larsen | +44 7545 513 693 | [email protected] Alizé Kaisserian | +33 6 47 04 12 11 | [email protected] Keita Browne | +1 781 249 1766 | [email protected] Nathalie Pham | +33 7 85 93 30 17 | [email protected] Nina Goworek | +1 908 569 7086 | [email protected] Thibaud Châtelet | +33 6 80 80 89 90 | [email protected] Yun Li | +33 6 84 00 90 72 | [email protected]
Sanofi forward-looking statements This press release contains forward-looking statements within the meaning of applicable securities laws, including the Private Securities Litigation Reform Act of 1995, as amended. Forward-looking statements are statements that are not historical facts. These statements include projections and estimates and their underlying assumptions regarding the marketing and other potential of the product; regarding potential future events and revenues from the product. Words such as “expect,” “anticipate,” “believe,” “intend,” “estimate,” “plan,” “can,” “contemplate,” “could,” “is designed to,” “may,” “might,” “potential,” “objective,” "attempt," “target,” “project,” "strategy," "strive," "desire," “predict,” “forecast,” “ambition,” “guideline,” "seek," “should,” “will,” "goal," or the negative of these and similar expressions are intended to identify forward-looking statements. Although Sanofi’s management believes that the expectations reflected in such forward-looking statements are reasonable, investors are cautioned that forward-looking information and statements are subject to various risks and uncertainties, many of which are difficult to predict and generally beyond the control of Sanofi, that could cause actual results and developments to differ materially from those expressed in, or implied or projected by, the forward-looking information and statements. These risks, uncertainties and assumptions include among other things, unexpected regulatory actions or delays, or government regulation generally, that could affect the availability or commercial potential of the product, the fact that product may not be commercially successful; authorities’ decisions regarding whether and when to approve a product candidate; political pressure in the United States to mandate lower drug prices including “most favored nation” pricing for State Medicaid programs; the uncertainties inherent in research and development, including future clinical data and analysis of existing clinical data relating to the product, including post marketing, unexpected safety, quality or manufacturing issues; competition in general; risks associated with intellectual property and any related pending or future litigation and the ultimate outcome of such litigation, and volatile economic and market conditions, and the impact that global crises may have on us, our customers, suppliers, vendors, and other business partners, and the financial condition of any one of them, as well as on our employees and on the global economy as a whole. The risks and uncertainties also include the uncertainties discussed or identified in the public filings with the SEC and the French Markets Authority (AMF) made by Sanofi, including those listed under “Risk Factors” and “Cautionary Statement Regarding Forward-Looking Statements” in Sanofi’s annual report on Form 20-F for the year ended December 31, 2025, or contained in our periodic reports on Form 6-K. Other than as required by applicable law, Sanofi does not undertake any obligation to update or revise any forward-looking information or statements. In light of these risks, uncertainties and assumptions, you should not place undue reliance on any forward-looking statements contained herein.
All trademarks mentioned in this press release are the property of the Sanofi group.
July 30, 2026
Q2 sales growth of 17.8% at CER1 and business earnings per share (EPS)2 of €2.09
•Pharma launches sales increased by 48.3%, reaching €1.3 billion, driven mostly by Ayvakit, ALTUVIIIO, and Sarclisa
•Dupixent sales increased by 37.6% to €5.2 billion, above €5 billion per quarter for the first time
•Vaccines sales decreased by 4.7% to €1.1 billion, impacted by a high basis of comparison in influenza vaccines
•Research and Development expenses reached €2.2 billion, up by 17.9%, including cost from pipeline prioritisations
•Selling and general expenses reached €2.5 billion, up by 9.0%, mainly because of recent acquisitions and one-offs
•Business EPS was €2.09, up by 33.3% at CER; 31.4% at actual exchange rates; IFRS EPS €0.29
Pipeline update
•Seven regulatory approvals; in immunology, rare diseases, oncology, and neurology
•Two positive phase 3 readouts: Nexviazyme in infantile-onset Pompe disease; amlitelimab maintenance in atopic dermatitis
•Four regulatory submission acceptances, four regulatory designations (priority review, fast-track, breakthrough)
•Strategic pipeline decisions: amlitelimab will not progress to global regulatory submission.
Second quarter 2026 results
Second quarter 2026 results were reviewed by management during a live audio webcast with the financial community on July 30, 2026. The presentation was followed by a Q&A session.
Featuring

Belén Garijo
Chief Executive Officer

François Roger
Chief Financial Officer

Mike Quigley
Chief Scientific Officer
Highlights
We delivered double-digit sales growth and strong business EPS growth in the second quarter and, looking ahead, we are confident in our trajectory of profitable growth. Our strong financial foundation is expected to support continued pipeline enhancement and external growth opportunities in the years ahead.
Belén Garijo
Chief Executive Officer
Streaming
Watch the replay
Downloads
Press release
Presentation
Epidemiology data
Income statement
Net sales of medicine/vaccine, business, segment by region
R&D appendix
Infographic
Aide-mémoire
Transcript (LSEG report - AI transcript - accuracy not guaranteed)
Cookie settings
When you visit any website, it may store or retrieve information on your browser, mostly in the form of cookies. This information might be about you, your preferences or your device and is mostly used to make the site work as you expect it to, to make your online experience easier by saving browsing information. The information does not usually directly identify you, but it can give you a more personalized web experience. There are two types of cookies, the first-party cookies, created by the website you visit and hosted by Sanofi, and third-party cookies, created by other websites. Because we respect your right to privacy, you can choose not to allow some types of cookies. Click on the different category headings to find out more and change our settings. For more information on the cookies, please consult the "Cookies Policy" available in the footer.
Accept all
Manage Consent Preferences
Strictly Necessary Cookies
Always Active
These cookies are necessary for the website to function and cannot be switched off in our systems. They are only set to provide you with services you have requested, such as setting your privacy preferences, logging in or filling in forms. You can set your browser to block or alert you about these cookies, but these functions and services will not work for you and in particular, we won’t be able to save your preferences about cookies. These cookies do not store any personally identifiable information.
View Vendor Details
Functional Cookies
Functional Cookies
These cookies enable the website to provide enhanced functionality and personalization. They may be set by us or by third party providers whose services we have added to our pages. If you do not allow these cookies then some or all of these services may not function properly.
View Vendor Details
Performance Cookies
Performance Cookies
These cookies allow us to count visits and traffic sources so we can measure and improve the performance of our site. They measure how often you visit our website and how you use it. They help us to know which pages are the most and least popular and see how visitors move around the site. All information these cookies collect is aggregated and therefore anonymous. If you do not allow these cookies we will not know when you have visited our site, and will not be able to monitor its performance.
View Vendor Details
Targeting Cookies
Targeting Cookies
These cookies may be set through our site by our advertising partners. They may be used by those companies to build a profile of your interests and show you relevant adverts on other sites. They do not store directly personal information, but are based on uniquely identifying your browser and internet device. If you do not allow these cookies, you will experience less targeted advertising. Subject to your prior consent, these cookies stored in your device by the third-parties listed below, allow us to count the number of displays of advertising content in our advertising spaces, identify these contents, the number of displays for each of them, the number of users who clicked on each content and where applicable, further actions carried out by the users on the sites linked to these advertising contents, to be able to calculate the sums due to the actors of the advertising distribution chain (communication agency, advertising management, site/distribution medium) and to establish statistics. Please note that when consenting to the use of targeting cookies, you also consent to the follow up of your navigation on other websites.
View Vendor Details
Vendors List
Clear
- checkbox label label
Apply Cancel
Leg.Interest
checkbox label label
checkbox label label
checkbox label label
Reject all
July 30, 2026
Share
-
[](https://www.facebook.com/sharer.php?u=https://www.sanofi.com/en/media-room/press-releases/2026/2026-07-30-05-30-00-3335767&t=Press Release: Q2 2026: double-digit sales growth and strong business EPS growth; 2026 guidance upgraded)
-
[](https://twitter.com/share?url=https://www.sanofi.com/en/media-room/press-releases/2026/2026-07-30-05-30-00-3335767&text=Press Release: Q2 2026: double-digit sales growth and strong business EPS growth; 2026 guidance upgraded)
-
[](https://www.linkedin.com/shareArticle?mini=true&url=https://www.sanofi.com/en/media-room/press-releases/2026/2026-07-30-05-30-00-3335767&title=Press Release: Q2 2026: double-digit sales growth and strong business EPS growth; 2026 guidance upgraded)
Q2 2026: double-digit sales growth and strong business EPS growth; 2026 guidance upgraded
July 30, 2026
Q2 sales growth of 17.8% at CER1and business earnings per share (EPS)2of €2.09
-
Pharma launches sales increased by 48.3%, reaching €1.3 billion, driven mostly by Ayvakit, ALTUVIIIO, and Sarclisa
-
Dupixent sales increased by 37.6% to €5.2 billion, above €5 billion per quarter for the first time
-
Vaccines sales decreased by 4.7% to €1.1 billion, impacted by a high basis of comparison in influenza vaccines
-
Research and Development expenses reached €2.2 billion, up by 17.9%, including cost from pipeline prioritisations
-
Selling and general expenses reached €2.5 billion, up by 9.0%, mainly because of recent acquisitions and one-offs
-
Business EPS was €2.09, up by 33.3% at CER; 31.4% at actual exchange rates; IFRS EPS €0.29
Pipeline update
-
Seven regulatory approvals; in immunology, rare diseases, oncology, and neurology
-
Two positive phase 3 readouts: Nexviazyme in infantile-onset Pompe disease; amlitelimab maintenance in atopic dermatitis
-
Four regulatory submission acceptances, four regulatory designations (priority review, fast-track, breakthrough)
-
Strategic pipeline decisions: amlitelimab will not progress to global regulatory submission. Itepekimab and balinatunfib clinical development programmes discontinued
Capital allocation
- Completion of the €1 billion share buyback programme
Sustainability
- The Impact® medicines portfolio is now available in 30 underserved countries, supporting the Global Health Unit’s goal of reaching two million patients with non-communicable disease treatments by 2030
Guidance upgraded
- In 2026, sales are now expected to grow by around 10% at CER. Business EPS at CER is expected to grow slightly faster than sales.3
Belén Garijo, Chief Executive Officer: “We delivered double-digit sales growth and strong business EPS growth in Q2. Sales increased by 17.8%, driven by Pharma launches, including recent acquisitions, and by Dupixent, up by 37.6%. Business EPS increased by 33.3%, supported by disciplined cost management and one-offs. Pipeline milestones included seven regulatory approvals, two positive phase 3 studies, and four additional regulatory designations. Based on our strong performance in the first half and anticipating normalisation of growth in the second half, we are upgrading our 2026 guidance. Sales are now expected to grow by around 10% with business EPS growing slightly faster than sales at constant exchange rates — delivering profitable, sustainable growth.
My first months as CEO have focused on assessing the challenges facing Sanofi and working on an accelerated transformation roadmap that leverages our commercial strengths and focuses on the need for R&D and pipeline improvements. We have taken the first decisive steps on pipeline prioritisation and recently, we appointed a focused Executive Committee aligned with the strategic priorities. Looking ahead, we're confident in our trajectory of profitable growth: Dupixent sales are now expected to reach around €25 billion in 2030, complemented by approximately €10 billion from Pharma launches — both at constant exchange rates. This strong financial foundation is expected to support continued pipeline enhancement and external growth opportunities in the years ahead. We are committed to acting and reporting on our progress to shareholders and other stakeholders in the quarters to come.”
| | Q2 2026 | Change | Change at CER | H1 2026 | Change | Change at CER |
| Net sales | €11,597m | +16.0% | +17.8% | €22,106m | +11.1% | +15.7% |
| IFRS net income | €343m | -91.3% | — | €1,957m | -66.3% | — |
| IFRS EPS | €0.29 | -91.0% | — | €1.63 | -65.6% | — |
| Free cash flow1 | €2,670m | +86.8% | — | €3,724m | +51.5% | — |
| Business operating income | €3,291m | +33.7% | +35.8% | €6,258m | +16.7% | +22.3% |
| Business net income | €2,501m | +28.9% | +31.0% | €4,765m | +14.8% | +20.4% |
| Business EPS | €2.09 | +31.4% | +33.3% | €3.97 | +17.1% | +22.7% |
1 Changes in net sales are at constant exchange rates (CER) unless stated otherwise (definition in Appendix 8). 2 To facilitate an understanding of operational performance, Sanofi comments on the business net income, a non-IFRS financial measure (definition in Appendix 8). The income statement is in Appendix 3 and a reconciliation of IFRS net income to business net income is in Appendix 4. 3 Applying July 2026 average currency exchange rates, the currency impacts are estimated at c.-1% on sales and at c.-2% on business EPS. 4 Free cash flow is a non-IFRS financial measure (definition in Appendix 8).
July 30, 2026
Share
-
[](https://www.facebook.com/sharer.php?u=https://www.sanofi.com/en/media-room/press-releases/2026/2026-07-30-13-38-20-3336170&t=Press Release: Sanofi’s half-year financial report for 2026)
-
[](https://twitter.com/share?url=https://www.sanofi.com/en/media-room/press-releases/2026/2026-07-30-13-38-20-3336170&text=Press Release: Sanofi’s half-year financial report for 2026)
-
[](https://www.linkedin.com/shareArticle?mini=true&url=https://www.sanofi.com/en/media-room/press-releases/2026/2026-07-30-13-38-20-3336170&title=Press Release: Sanofi’s half-year financial report for 2026)
Sanofi’s half-year financial report for 2026
Paris, July 30, 2026. Sanofi announces that its half-year financial report for the period ending June 30, 2026, is now available online and has been filed with the French market regulator Autorité des marchés financiers (AMF) and submitted to the US Securities and Exchange Commission (SEC) under form 6-K.
This document may be found on www.sanofi.com and downloaded from the “Investors” page, under the heading “Financial Reports and Other Publications”.
About Sanofi Sanofi is an R&D driven, AI-powered biopharma company committed to improving people’s lives and delivering compelling growth. We apply our deep understanding of the immune system to invent medicines and vaccines that treat and protect millions of people around the world, with an innovative pipeline that could benefit millions more. Our team is guided by one purpose: we chase the miracles of science to improve people’s lives; this inspires us to drive progress and deliver positive impact for our people and the communities we serve, by addressing the most urgent healthcare, environmental, and societal challenges of our time. Sanofi is listed on EURONEXT: SAN and NASDAQ: SNY
Media Relations Sandrine Guendoul| + 33 6 25 09 14 25 | [email protected] Léo Le Bourhis| + 33 6 75 06 43 81 | [email protected] Laura Romby| + 33 6 74 16 74 29 | [email protected]
Investor Relations Thomas Kudsk Larsen |+ 44 7545 513 693 |[email protected] AlizéKaisserian| + 33 6 47 04 12 11 | [email protected] Keita Browne| + 1 781 249 1766 | [email protected] Nathalie Pham| + 33 7 85 93 30 17 | [email protected] Nina Goworek| + 1 908 569 7086 | [email protected] Thibaud Châtelet | + 33 6 80 80 89 90 | [email protected] Yun Li | +33 6 84 00 90 72 | [email protected]
Paris, July 21, 2026. Sanofi today announced an evolution of its Executive Committee, bringing together a focused leadership team across its businesses, scientific organization and key global functions as the company continues to deliver on its priorities and prepares its next strategic chapter.
Effective September 1, 2026, Sanofi’s Executive Committee will comprise:
• François Roger, Executive Vice President, Finance
• Paulo Fontoura, Executive Vice President, Head of Research & Development
• Manuela Buxo, Executive Vice President, Specialty Care
• Thomas Triomphe, Executive Vice President, Vaccines
• Thomas Grenier, Executive Vice President, General Medicines
• Brendan O’Callaghan, Executive Vice President, Manufacturing & Supply
• Jamie Haney, Executive Vice President, General Counsel
• Véronique Jaillet, Executive Vice President, Chief People Officer, ad interim
Emmanuel Frenehard, Head of Digital and Audrey Duval, Head of Corporate Affairs and President of Sanofi France, will continue to report directly to Belén Garijo, Sanofi’s CEO.
July 24, 2026
Share
-
[](https://www.facebook.com/sharer.php?u=https://www.sanofi.com/en/media-room/press-releases/2026/2026-07-24-05-30-00-3332696&t=Press Release: Sanofi announces decision not to submit amlitelimab in atopic dermatitis for global regulatory reviews)
-
[](https://twitter.com/share?url=https://www.sanofi.com/en/media-room/press-releases/2026/2026-07-24-05-30-00-3332696&text=Press Release: Sanofi announces decision not to submit amlitelimab in atopic dermatitis for global regulatory reviews)
-
[](https://www.linkedin.com/shareArticle?mini=true&url=https://www.sanofi.com/en/media-room/press-releases/2026/2026-07-24-05-30-00-3332696&title=Press Release: Sanofi announces decision not to submit amlitelimab in atopic dermatitis for global regulatory reviews)
Sanofi announces decision not to submit amlitelimab in atopic dermatitis for global regulatory reviews
Paris, July 24, 2026. Sanofi today announced the discontinuation of clinical development of amlitelimab, an OX40-ligand monoclonal antibody, in moderate-to-severe atopic dermatitis (AD). This decision not to submit for global regulatory reviews was made as part of an ongoing strategic assessment of the pipeline.
Sanofi has determined that the totality of efficacy and safety evidence generated to date does not support further development of amlitelimab in AD. While the ESTUARY phase 3 long-term extension study (clinical study identifier:NCT06407934) showed long-term maintenance of clinical response without relapse in patients aged 12 years and older with moderate-to-severe AD and an emerging safety profile that builds on previous data, amlitelimab would not represent a meaningful improvement to the standard of care for patients with AD. Additional results from the amlitelimab development program in AD, including from the ESTUARY study, will be presented at a forthcoming medical meeting.
Patients and their physicians need additional effective treatments due to the heterogeneity of underlying immune mechanisms that contribute to AD, and Sanofi remains committed to pursuing advances in inflammatory skin conditions.
Sanofi is deeply grateful to the patients, caregivers, and investigators who supported the development of amlitelimab in AD, including in the ESTUARY study. Sanofi will work closely with investigators, site teams, and regulatory authorities to ensure a wind-down of ongoing amlitelimab AD studies, with appropriate transition of care for all enrolled patients.
Financial considerations Sanofi is not amending its full-year 2026 guidance as a result of this announcement.
About amlitelimab Amlitelimab (SAR445229, KY1005) is a fully human, non-T cell depleting monoclonal antibody that blocks the OX40L, a key immune regulator. With its novel mechanism of action, amlitelimab selectively blocks OX40L signaling during the inflammatory prequel, the initiating phase of an overactive immune system, to potentially normalize T-cell-mediated inflammation without T-cell depletion.
The phase 2 study of amlitelimab in celiac disease is ongoing and expected to readout in the second half of 2026.
About Sanofi Sanofi is an R&D driven, AI-powered biopharma company committed to improving people’s lives and delivering compelling growth. We apply our deep understanding of the immune system to invent medicines and vaccines that treat and protect millions of people around the world, with an innovative pipeline that could benefit millions more. Our team is guided by one purpose: we chase the miracles of science to improve people’s lives; this inspires us to drive progress and deliver positive impact for our people and the communities we serve, by addressing the most urgent healthcare, environmental, and societal challenges of our time.
Sanofi is listed on EURONEXT: SAN and NASDAQ: SNY.
Sanofi Media Relations Sandrine Guendoul | +33 6 25 09 14 25 | [email protected] Evan Berland | +1 215 432 0234 | [email protected] Léo Le Bourhis | +33 6 75 06 43 81 | [email protected] Victor Rouault | +33 6 70 93 71 40 | [email protected] Timothy Gilbert | +1 516 521 2929 | [email protected] Léa Ubaldi| +33 6 30 19 66 46 | [email protected] Ekaterina Pesheva| +1 410 926 6780 | [email protected]
Sanofi Investor Relations Thomas Kudsk Larsen |+44 7545 513 693 | [email protected] Alizé Kaisserian | +33 6 47 04 12 11 | [email protected] Keita Browne | +1 781 249 1766 | [email protected] Nathalie Pham | +33 7 85 93 30 17 | [email protected] Nina Goworek| +1 908 569 7086 | [email protected] Thibaud Châtelet | +33 6 80 80 89 90 | [email protected] Yun Li | +33 6 84 00 90 72 | [email protected]
Sanofi Forward-Looking Statements
This press release contains forward-looking statements within the meaning of applicable securities laws, including the Private Securities Litigation Reform Act of 1995, as amended.
Forward-looking statements are statements that are not historical facts. These statements include projections and estimates and their underlying assumptions, statements regarding plans, objectives, intentions, and expectations with respect to future financial results, events, operations, services, product development and potential, and statements regarding future events and economic performance. Words such as “expect,” “anticipate,” “believe,” “intend,” “estimate,” “plan,” “can,” “contemplate,” “could,” “is designed to,” “may,” “might,” “potential,” “objective,” "attempt," “target,” “project,” "strategy," "strive," "desire," “predict,” “forecast,” “ambition,” “guideline,” "seek," “should,” “will,” "goal," or the negative of these, and similar expressions are intended to identify forward-looking statements.
Although Sanofi’s management believes that the expectations reflected in such forward-looking statements are reasonable, investors are cautioned that forward-looking information and statements are subject to various risks and uncertainties, many of which are difficult to predict and generally beyond the control of Sanofi, that could cause actual results and developments to differ materially from those expressed in, or implied or projected by, the forward-looking information and statements. These risks and uncertainties include among other things, the uncertainties inherent in research and development, future clinical data and analysis, including post marketing, decisions by regulatory authorities, such as the U.S Food and Drug Administration or the European Medicines Agency, regarding whether and when to approve any drug, device or biological application that may be filed for any such product candidates as well as their decisions regarding labelling and other matters that could affect the availability or commercial potential of such product candidates; the fact that product candidates if approved may not be commercially successful; unexpected regulatory actions or delays, or government regulation generally; authorities’ decisions regarding whether and when to approve a product candidate; political pressure in the United States to mandate lower drug prices including “most favored nation” pricing for State Medicaid programs; the future approval and commercial success of therapeutic alternatives; Sanofi’s ability to benefit from external growth opportunities, to complete related transactions and/or obtain regulatory clearances, including future clinical data and analysis of existing clinical data relating to the product, including post marketing, unexpected safety, quality or manufacturing issues, competition in general; risks associated with intellectual property and any related pending or future litigation and the ultimate outcome of such litigation; trends in exchange rates and prevailing interest rates, volatile economic and market conditions, cost containment initiatives and subsequent changes thereto, and the impact that global crises may have on us, our customers, suppliers, vendors, and other business partners, and the financial condition of any one of them, as well as on our employees and on the global economy as a whole. The risks and uncertainties also include the uncertainties discussed or identified in the public filings with the SEC and the French Markets Authority (AMF) made by Sanofi, including those listed under “Risk Factors” and “Cautionary Statement Regarding ForwardLooking Statements” in Sanofi’s annual report on Form 20-F for the year ended December 31, 2025 or contained in our periodic reports on Form 6-K. Other than as required by applicable law, Sanofi does not undertake any obligation to update or revise any forward-looking information or statements. In light of these risks, uncertainties and assumptions, you should not place undue reliance on any forward-looking statements contained herein.
July 21, 2026
Share
-
[](https://www.facebook.com/sharer.php?u=https://www.sanofi.com/en/media-room/press-releases/2026/2026-07-21-16-00-00-3330752&t=Press Release: Sanofi evolves its Executive Committee to support its next strategic chapter)
-
[](https://twitter.com/share?url=https://www.sanofi.com/en/media-room/press-releases/2026/2026-07-21-16-00-00-3330752&text=Press Release: Sanofi evolves its Executive Committee to support its next strategic chapter)
-
[](https://www.linkedin.com/shareArticle?mini=true&url=https://www.sanofi.com/en/media-room/press-releases/2026/2026-07-21-16-00-00-3330752&title=Press Release: Sanofi evolves its Executive Committee to support its next strategic chapter)
Sanofi evolves its Executive Committee to support its next strategic chapter
Paris, July 21, 2026. Sanofi today announced an evolution of its Executive Committee, bringing together a focused leadership team across its businesses, scientific organization and key global functions as the company continues to deliver on its priorities and prepares its next strategic chapter.
Effective September 1, 2026, Sanofi's Executive Committee will comprise:
-
François Roger, Executive Vice President, Finance
-
Paulo Fontoura, Executive Vice President, Head of Research & Development
-
Manuela Buxo, Executive Vice President, Specialty Care
-
Thomas Triomphe, Executive Vice President, Vaccines
-
Thomas Grenier, Executive Vice President, General Medicines
-
Brendan O’Callaghan, Executive Vice President, Manufacturing & Supply
-
Jamie Haney, Executive Vice President, General Counsel
-
Véronique Jaillet, Executive Vice President, Chief People Officer, ad interim
Emmanuel Frenehard, Head of Digital and Audrey Duval, Head of Corporate Affairs and President of Sanofi France, will continue to report directly to Belén Garijo, Sanofi’s CEO.
Madeleine Roach, currently Head of Business Operations, will become President and Country Lead of Sanofi Germany, Switzerland and Austria. Her current responsibilities, which focus on optimizing enterprise business services, will be integrated into the Finance function. Finance’s expanded remit will also include Global Partnering and Business Development, helping drive a more integrated approach across Business Development and Mergers & Acquisitions.
Thomas Triomphe will also assume responsibility for China, alongside his role as Executive Vice President, Vaccines.
Olivier Charmeil, currently Executive Vice President, General Medicines, will transition to Strategic Projects Advisor to the CEO. Throughout his career, Olivier has helped shape the company across a succession of leadership roles, with a deep and enduring commitment to its people, its business and the patients it serves. Roy Papatheodorou, currently Executive Vice President, General Counsel, has decided to leave the organization to pursue external opportunities after over four years with the company, during which he has brought outstanding leadership and contributions which went beyond his role as General Counsel.
“This Executive Committee brings together experienced professionals who will work together to help shape our future direction, make disciplined choices, execute them with focus, and ensure we continue to deliver for our patients, our people and all our stakeholders. I would like to thank all those who have contributed to Sanofi’s success and those who will continue to shape its future. I am deeply grateful for their leadership, commitment and dedication, and I wish everyone every success for the future," said Belén Garijo, Chief Executive Officer of Sanofi.
Biographies and pictures available on sanofi.com or upon request.
About Sanofi Sanofi is an R&D driven, AI-powered biopharma company committed to improving people’s lives and delivering compelling growth. We apply our deep understanding of the immune system to invent medicines and vaccines that treat and protect millions of people around the world, with an innovative pipeline that could benefit millions more. Our team is guided by one purpose: we chase the miracles of science to improve people’s lives; this inspires us to drive progress and deliver positive impact for our people and the communities we serve, by addressing the most urgent healthcare, environmental, and societal challenges of our time. Sanofi is listed on EURONEXT: SAN and NASDAQ: SNY
Media Relations Sandrine Guendoul | +33 6 25 09 14 25 | [email protected] Evan Berland | +1 215 432 0234 | [email protected] Léo Le Bourhis | +33 6 75 06 43 81 | [email protected] Léa Ubaldi| +33 6 30 19 66 46 | [email protected] Laura Romby| +33 6 74 16 74 29 | [email protected] Ekaterina Pesheva | +1 410 926 6780 | [email protected] Victor Rouault | +1 617 356 4751 | [email protected] Timothy Gilbert | +1 516 521 2929 | [email protected]
Investor Relations Thomas Kudsk Larsen |+ 44 7545 513 693 | [email protected] Alizé Kaisserian | + 33 6 47 04 12 11 | [email protected] Keita Browne | + 1 781 249 1766 | [email protected] Nathalie Pham | + 33 7 85 93 30 17 | [email protected] Nina Goworek | +1 908 569 7086 | [email protected] Thibaud Châtelet | + 33 6 80 80 89 90 | [email protected] Yun Li | +33 6 84 00 90 72 | [email protected]
Sanofi Forward-Looking Statements This press release contains forward-looking statements within the meaning of applicable securities laws, including the Private Securities Litigation Reform Act of 1995, as amended. Forward-looking statements are statements that are not historical facts. These statements include projections and estimates and their underlying assumptions, statements regarding plans, objectives, intentions, and expectations with respect to future financial results, events, operations, services, product development and potential, and statements regarding future events and economic performance. Words such as “expect,” “anticipate,” “believe,” “intend,” “estimate,” “plan,” “can,” “contemplate,” “could,” “is designed to,” “may,” “might,” “potential,” “objective,” "attempt," “target,” “project,” "strategy," "strive," "desire," “predict,” “forecast,” “ambition,” “guideline,” "seek," “should,” “will,” "goal," or the negative of these, and similar expressions are intended to identify forward-looking statements. Although Sanofi’s management believes that the expectations reflected in such forward-looking statements are reasonable, investors are cautioned that forward-looking information and statements are subject to various risks and uncertainties, many of which are difficult to predict and generally beyond the control of Sanofi, that could cause actual results and developments to differ materially from those expressed in, or implied or projected by, the forward-looking information and statements. These risks and uncertainties include among other things, the uncertainties inherent in research and development, future clinical data and analysis, including post marketing, decisions by regulatory authorities, such as the U.S Food and Drug Administration or the European Medicines Agency, regarding whether and when to approve any drug, device or biological application that may be filed for any such product candidates as well as their decisions regarding labelling and other matters that could affect the availability or commercial potential of such product candidates; the fact that product candidates if approved may not be commercially successful; unexpected regulatory actions or delays, or government regulation generally; authorities’ decisions regarding whether and when to approve a product candidate; political pressure in the United States to mandate lower drug prices including “most favored nation” pricing for State Medicaid programs; the future approval and commercial success of therapeutic alternatives; Sanofi’s ability to benefit from external growth opportunities, to complete related transactions and/or obtain regulatory clearances, including future clinical data and analysis of existing clinical data relating to the product, including post marketing, unexpected safety, quality or manufacturing issues, competition in general; risks associated with intellectual property and any related pending or future litigation and the ultimate outcome of such litigation; trends in exchange rates and prevailing interest rates, volatile economic and market conditions, cost containment initiatives and subsequent changes thereto, and the impact that global crises may have on us, our customers, suppliers, vendors, and other business partners, and the financial condition of any one of them, as well as on our employees and on the global economy as a whole. The risks and uncertainties also include the uncertainties discussed or identified in the public filings with the SEC and the French Markets Authority (AMF) made by Sanofi, including those listed under “Risk Factors” and “Cautionary Statement Regarding Forward-Looking Statements” in Sanofi’s annual report on Form 20-F for the year ended December 31, 2025 or contained in our periodic reports on Form 6-K. Other than as required by applicable law, Sanofi does not undertake any obligation to update or revise any forward-looking information or statements. In light of these risks, uncertainties and assumptions, you should not place undue reliance on any forward-looking statements contained herein.
• Sarclisa Escena administered via the CirCLIQ® on-body injector (OBI) offers a treatment experience designed with patients and HCPs in mind
• The first anticancer treatment to be administered through an OBI, and the first MM treatment available by both SC OBI and manual SC administration in the US
• Efficacy of Sarclisa now available in SC formulation with innovative OBI across approved combinations and lines of therapy
Paris, July 10, 2026. The US Food and Drug Administration (FDA) has approved subcutaneous (SC) Sarclisa (isatuximab-irfc) Escena in combination with standard-of-care regimens for the treatment of patients with multiple myeloma (MM) across all existing indications of Sarclisa intravenous (IV) formulation. With the approval, Sarclisa Escena is the first anticancer treatment to be administered through both an on-body injector (OBI) and manual SC administration.
July 10, 2026
Share
-
[](https://www.facebook.com/sharer.php?u=https://www.sanofi.com/en/media-room/press-releases/2026/2026-07-10-12-35-09-3325483&t=Press Release: Sanofi’s subcutaneous Sarclisa Escena approved in the US as first anticancer treatment administered via on-body injector)
-
[](https://twitter.com/share?url=https://www.sanofi.com/en/media-room/press-releases/2026/2026-07-10-12-35-09-3325483&text=Press Release: Sanofi’s subcutaneous Sarclisa Escena approved in the US as first anticancer treatment administered via on-body injector)
-
[](https://www.linkedin.com/shareArticle?mini=true&url=https://www.sanofi.com/en/media-room/press-releases/2026/2026-07-10-12-35-09-3325483&title=Press Release: Sanofi’s subcutaneous Sarclisa Escena approved in the US as first anticancer treatment administered via on-body injector)
Sanofi’s subcutaneous Sarclisa Escena approved in the US as first anticancer treatment administered via on-body injector
-
Sarclisa Escena administered via the CirCLIQ® on-body injector (OBI) offers a treatment experience designed with patients and HCPs in mind
-
The first anticancer treatment to be administered through an OBI, and the first MM treatment available by both SC OBI and manual SC administration in the US
-
Efficacy of Sarclisa now available in SC formulation with innovative OBI across approved combinations and lines of therapy
Paris, July 10, 2026. The US Food and Drug Administration (FDA) has approved subcutaneous (SC) Sarclisa (isatuximab-irfc) Escena in combination with standard-of-care regimens for the treatment of patients with multiple myeloma (MM) across all existing indications of Sarclisa intravenous (IV) formulation. With the approval, Sarclisa Escena is the first anticancer treatment to be administered through both an on-body injector (OBI) and manual SC administration.
The FDA approval was supported by multiple studies, including the pivotal IRAKLIA phase 3 non-inferiority study, which demonstrated Sarclisa Escena administered subcutaneously via an OBI provided similar efficacy, pharmacokinetics and safety compared to IV infusion, along with a significantly shorter treatment time and fewer infusion-related reactions.
“Multiple myeloma is a malignancy that often requires frequent IV infusions or manual subcutaneous injections. Treatment administration can be a cumbersome experience for patients, while also placing a strain on providers by requiring physical effort to push high-resistance syringes for several minutes,” said **Sikander Ailawadhi,**MD, Professor of Medicine, Division of Hematology/Oncology at Mayo Clinic Florida, US, and the principal investigator of the IRAKLIA study. “The comparable efficacy observed across multiple studies and the patient-centric design of the OBI offers an opportunity to impact the patient experience while upholding Sarclisa’s consistent efficacy.”
The studies were conducted using Enable Injections’ hands-free OBI, an automated injector designed to deliver subcutaneously high-volume medicines with the push of a button, to administer Sarclisa Escena. The OBI uses a retractable 30g needle that is shorter and thinner compared to the needles commonly used for large-volume injections. The approval of Sarclisa Escena with Enable Injections’ CirCLIQ OBI – developed using the enFuse® platform – offers the potential to change the overall patient experience in MM treatment.
“Sarclisa is the cornerstone of our oncology franchise, and we have always been confident in it being widely adopted as a potential best-in-class therapy,” said **Manuela Buxo,**Executive Vice President, Head of Specialty Care at Sanofi. “The approval of Sarclisa Escena subcutaneous formulation administered with the CirCLIQ is a definitive step in this direction. More than 70,000 patients worldwide have benefitted from Sarclisa, delivering predictable and important efficacy and safety across multiple combinations and lines of therapy. Today, we are proud to bring innovation that will empower physicians to enhance the treatment experience for patients, offering greater simplicity, flexibility and convenience.”
In addition, the CirCLIQ may streamline the administration process for providers, offering the potential to reduce the physical burden on nurses with a hands-free device and providing more freedom for patient monitoring and interaction.
“The introduction of Sarclisa Escena with the innovative CirCLIQ on-body injector represents a significant advancement in multiple myeloma care,” said **Donna D. Catamero,**ANP-BC, OCN, CCRC, Associate Director, Myeloma Research; Adjunct Faculty, Mount Sinai Phillips School of Nursing and International Myeloma Foundation Nurse Leadership Board member. “For nurses and physicians treating patients with multiple myeloma, this automated system has the potential to meaningfully reduce administrative burden, simplifying how therapy is delivered and giving healthcare teams more capacity to focus on their patients.”
In the IRAKLIA phase 3 study, the first to incorporate the use of an OBI in the treatment of MM, Sarclisa SC administered via an OBI in combination with pomalidomide and dexamethasone (Pd) resulted in a 71.1% (187/263) objective response rate (ORR), compared to 70.5% (189/268) with Sarclisa IV-Pd, establishing non-inferiority (relative risk 1.008; 95% confidence interval: 0.903-1.126), in adult patients with relapsed or refractory MM (R/R MM) who have received at least one prior line of treatment.
The overall safety profile of Sarclisa SC-Pd observed in this study was consistent with the established safety profile of Sarclisa IV-Pd. While 25% of patients treated with Sarclisa IV-Pd experienced systemic administration reactions, 1.5% of patients treated with Sarclisa SC-Pd experienced those reactions. No new safety concerns were observed, except for injection site reactions (ISRs) that occurred in 0.4% of OBI injections (n=19/5,145 injections). Nearly all ISRs were grade 1, except for one episode of grade 2.
The most common adverse reactions (≥20%) were upper respiratory tract infection, fatigue, pneumonia, musculoskeletal pain, and diarrhea. The most common hematology laboratory abnormalities (≥40%) were decreased leukocytes, decreased neutrophils, decreased lymphocytes, decreased platelets, and decreased hemoglobin.
Sarclisa is currently approved across three indications in the US, including in combination with bortezomib, lenalidomide and dexamethasone in newly diagnosed multiple myeloma (NDMM) patients not eligible for autologous stem cell transplant. In R/R MM, Sarclisa is approved in combination with Pd in patients who have received ≥two prior therapies, including lenalidomide and a proteasome inhibitor and have relapsed on the last therapy, as well as in combination with carfilzomib and dexamethasone in patients who have received one to three prior lines of therapy.
About the IRAKLIA studyIRAKLIA (clinical study identifier: NCT05405166) was a randomized, open-label, pivotal phase 3 study evaluating the non-inferiority of Sarclisa Escena administered at a fixed dose of 1,400 mg SC in combination with Pd via OBI versus weight-based dosed Sarclisa IV in combination with Pd in adult patients with R/R MM who have received at least one prior line of therapy. The major efficacy measures were ORR, defined as the proportion of patients with stringent complete response (CR), CR, very good partial response, and partial response according to the 2016 International Myeloma Working Group criteria assessed by Independent Review Committee, and observed Sarclisa Escena mean concentration before dosing (Ctrough) at steady state (pre-dose at cycle 6, dose 1 [C6D1]), defined as observed Sarclisa Escena plasma concentrations.
About Enable InjectionsCincinnati-based Enable Injections is a global healthcare innovation company committed to improving the patient treatment experience through the development and manufacturing of the enFuse® On-Body Delivery System. An innovative wearable technology, the enFuse system is designed to deliver large volumes of pharmaceutical and biologic therapeutics via subcutaneous administration, with the aim of improving convenience, supporting superior outcomes, and advancing healthcare system economics.
• Nexviazyme met its primary endpoint, participants alive and free of invasive ventilation, in treatment-naïve infants zero to six months of age in the Baby-COMET phase 3 study
• Sanofi intends to submit the data to support a regulatory application in the US for the treatment of infantile-onset Pompe disease
Paris, June 30, 2026. Positive results from the Baby-COMET phase 3, single-arm, open-label study (clinical study identifier: NCT04910776), demonstrated that Nexviazyme (avalglucosidase alfa) met its primary endpoint: proportion of treatment-naïve pediatric participants six months of age and younger with infantile-onset Pompe disease (IOPD) alive and free of invasive ventilation at 52 weeks of treatment. In addition, the study met all secondary endpoints, including proportion of participants alive and free of invasive ventilation at 12 and 18 months of age, and numerical improvements in other metrics of disease progression at 52 weeks.
The results will be shared on July 8, 2026, at the 19th International Congress on Neuromuscular Diseases in Florence, Italy.
SOMMAIRE
- Comptes semestriels consolidés condensés
2
Bilans consolidés — actif
2
Bilans consolidés — capitaux propres et passif
3
Comptes de résultat consolidés
4
États consolidés du résultat global
5
Tableaux de variation des capitaux propres consolidés
6
Tableaux des flux de trésorerie consolidés
8
Notes annexes – Semestre clos le 30 juin 2026
10
- Rapport semestriel d'activité
36
A/ Évènements marquants du premier semestre 2026
36
B/ Avancées dans la mise en œuvre de la stratégie de durabilité
41
C/ Évènements postérieurs au 30 juin 2026
42
D/ Comptes consolidés du premier semestre 2026
43
E/ Facteurs de risque et transactions entre parties liées
58
F/ Perspectives
59
Annexe – Portefeuille de recherche & développement
61
- Rapport des commissaires aux comptes sur l'information financière semestrielle
63
- Attestation du responsable du rapport financier semestriel
64
SANOFI
RAPPORT FINANCIER SEMESTRIEL 2026
1
Rapport financier semestriel 2026 Comptes semestriels consolidés condensés
- Comptes semestriels consolidés condensés Bilans consolidés — actif (Non audité(1)) (en millions d'euros)
Note
30 juin 2026
31 décembre 2025
Immobilisations corporelles
B.2.
10 364
10 052
Immobilisations corporelles - droits d'utilisation des actifs Écarts d'acquisition
1 590
1 459
B.3.
41 954
41 300 26 261
Autres actifs incorporels
B.3.
26 359
Participations dans des sociétés mises en équivalence
B.5.
3 207
3 259
Autres actifs non courants
B.6.
4 732
4 364
Actifs non courants relatifs à l'impôt sur le résultat
569
550
Impôts différés actifs
8 763
8 608
Actif non courant
97 538
95 853
11 127
10 214
Stocks Clients et comptes rattachés
B.7.
Autres actifs courants
8 714
8 410
4 282
4 066
Actifs courants relatifs à l'impôt sur le résultat Trésorerie et équivalents de trésorerie
B.9.
492
397
6 350
7 657
557
208
Actif courant
Actifs destinés à être cédés
31 522
30 952
Total de l’actif
129 060
126 805
Les notes jointes en pages 10 à 35 font partie intégrante des comptes semestriels consolidés condensés.
(1)
Ces états financiers consolidés semestriels condensés non audités au 30 juin 2026 doivent être lus conjointement avec les états financiers consolidés annuels audités de Sanofi au 31 décembre 2025.
2
SANOFI
RAPPORT FINANCIER SEMESTRIEL 2026
Rapport financier semestriel 2026 Comptes semestriels consolidés condensés
Bilans consolidés — capitaux propres et passif (Non audité(1)) (en millions d'euros)
30 juin 2026
31 décembre 2025
Capitaux propres - Part attribuable aux Actionnaires de Sanofi
Note
69 207
71 376
Capitaux propres - Part attribuable aux Intérêts non contrôlants
360
334
Total des capitaux propres
B.8.
69 567
71 710
Emprunts à long terme
B.9.
14 646
14 248
1 677
1 467
Dette locative long terme Passifs non courants liés à des regroupements d'entreprises et à des Intérêts non contrôlants
B.11.
652
585
Provisions et autres passifs non courants
B.12.
6 848
6 703
Passifs non courants relatifs à l'impôt sur le résultat
2 187
2 081
Impôts différés passifs
1 553
1 666
Passif non courant
27 563
26 750
7 150
7 361
Fournisseurs et comptes rattachés Passifs courants liés à des regroupements d'entreprises et à des Intérêts non contrôlants
B.11.
Provisions et autres passifs courants
—
—
16 446
15 565
Passifs courants relatifs à l'impôt sur le résultat
884
751
Dette locative court terme
227
272
7 026
4 342
Emprunts à court terme et part à court terme de la dette à long terme
B.9.
Passifs relatifs aux actifs destinés à être cédés Passif courant Total des capitaux propres et du passif
197
54
31 930
28 345
129 060
126 805
Les notes jointes en pages 10 à 35 font partie intégrante des comptes semestriels consolidés condensés.
(1)
Ces états financiers consolidés semestriels condensés non audités au 30 juin 2026 doivent être lus conjointement avec les états financiers consolidés annuels audités de Sanofi au 31 décembre 2025.
SANOFI
RAPPORT FINANCIER SEMESTRIEL 2026
3
Rapport financier semestriel 2026 Comptes semestriels consolidés condensés
Comptes de résultat consolidés (Non audité(1))
(en millions d'euros)
Note
30 juin 2026 (6 mois)
30 juin 2025 (6 mois)
Chiffre d'affaires
B.20.
22 106
19 889
Autres revenus
B.20
1 438
1 452
Coûts des ventes
(6 155)
(5 881)
Marge brute
17 389
15 460
Frais de recherche et développement
(3 980)
(3 717)
Frais commerciaux et généraux
(4 792)
(4 506)
Autres produits d'exploitation
B.15.
800
533
Autres charges d'exploitation
B.15.
(3 436)
(2 476)
Amortissements des incorporels
B.3.
(1 087)
(777)
Dépréciations des incorporels
B.4.
(1 031)
(210)
Ajustement de la juste valeur des compléments de prix
B.6. B.11.
(37)
(61)
Coûts de restructuration et assimilés
B.16.
(563)
(430)
Autres gains et pertes, litiges
B.17.
(95)
(57)
Résultat opérationnel
3 168
3 759
Charges financières
B.18.
(465)
(361)
Produits financiers
B.18.
137
184
2 840
3 582
(871)
(711)
Résultat avant impôts et sociétés mises en équivalence Charges d'impôts
B.19.
Quote-part du résultat net des sociétés mises en équivalence Résultat net des activités poursuivies Résultat net des activités abandonnées
B.22
2
85
1 971
2 956
26
2 881
1 997
5 837
Part attribuable aux Intérêts non contrôlants
40
25
Résultat net consolidé Part attribuable aux Actionnaires de Sanofi
1 957
5 812 2,40
Résultat net de l'ensemble consolidé
•
Résultat de base par action des activités poursuivies (en euros)
1,61
•
Résultat de base par action des activités abandonnées (en euros)
0,02
2,34
1,63
4,74 2,39
- Résultat de base par action (en euros)
B.8.7.
•
Résultat dilué par action des activités poursuivies (en euros)
1,60
•
Résultat dilué par action des activités abandonnées (en euros)
0,02
2,33
1,62
4,72
- Résultat dilué par action (en euros)
B.8.7.
Les notes jointes en pages 10 à 35 font partie intégrante des comptes semestriels consolidés condensés.
(1)
Ces états financiers consolidés semestriels condensés non audités au 30 juin 2026 doivent être lus conjointement avec les états financiers consolidés annuels audités de Sanofi au 31 décembre 2025.
4
SANOFI
RAPPORT FINANCIER SEMESTRIEL 2026
Rapport financier semestriel 2026 Comptes semestriels consolidés condensés
États consolidés du résultat global (Non audité(1)) 30 juin 2026 (6 mois)
30 juin 2025 (6 mois)
Résultat net de l’ensemble consolidé
1 997
5 837
Part attribuable aux Actionnaires de Sanofi
1 957
5 812
Part attribuable aux Intérêts non contrôlants
40
25
(en millions d’euros)
Note
Autres éléments du résultat global : •
Gains et (pertes) actuariels
B.8.8.
158
111
•
Variation de juste valeur des instruments de capitaux propres en actifs et passifs financiers
B.8.8.
175
222
•
Effet d’impôts
B.8.8.
(43)
(92)
290
241
Sous-total des éléments ne faisant pas ultérieurement l’objet d’un reclassement en résultat des activités poursuivies (A) •
Variation de juste valeur des instruments de dette en actifs financiers
B.8.8.
5
3
•
Variation de juste valeur des couvertures de flux de trésorerie
B.8.8.
14
(23)
•
Écarts de conversion
B.8.8.
1 313
(5 203)
•
Effet d’impôts
B.8.8.
(5)
(95)
Sous-total des éléments faisant ultérieurement l’objet d’un reclassement en résultat des activités poursuivies (B)
1 327
(5 318)
Autres éléments du résultat global au titre de la période, nets d’impôts des activités poursuivies (A+B)
1 617
(5 077)
—
303 1 063
Autres éléments du résultat global au titre de la période, nets d’impôts des activités abandonnées (C) Résultat global de l’ensemble consolidé
3 614
Part attribuable aux Actionnaires de Sanofi
3 562
1 076
•
Activités poursuivies
3 536
(2 097)
•
Activités abandonnées
26
3 173
52
(13)
Part attribuable aux Intérêts non contrôlants
Les notes jointes en pages 10 à 35 font partie intégrante des comptes semestriels consolidés condensés.
(1)
Ces états financiers consolidés semestriels condensés non audités au 30 juin 2026 doivent être lus conjointement avec les états financiers consolidés annuels audités de Sanofi au 31 décembre 2025.
SANOFI
RAPPORT FINANCIER SEMESTRIEL 2026
5
Rapport financier semestriel 2026 Comptes semestriels consolidés condensés
Tableaux de variation des capitaux propres consolidés (Non audité(1))
Réserves Actions et résultats propres accumulés
StockAutres options et éléments autres du paiements résultat en actions global
Part attribuable aux actionnaires de Sanofi
Intérêts non contrôlants
Total des capitaux propres
Capital
Primes
2 526
—
(840)
68 185
5 260
2 376
77 507
350
77 857
Autres éléments du résultat global au titre de la période
—
—
—
243
—
(4 979)
(4 736)
(38)
(4 774)
Résultat de la période
—
—
—
5 812
—
—
5 812
25
5 837
Résultat global de l’ensemble consolidé au titre de la période
—
—
—
6 055
—
(4 979)
1 076
(13)
1 063
Paiement du dividende au titre de l’exercice 2024 (3,92 € par action)
—
—
—
(4 772)
—
—
(4 772)
—
(4 772)
Paiement de dividendes aux Intérêts non contrôlants
—
—
—
—
—
—
—
(32)
(32) (3 988)
(en millions d’euros) Soldes au 1er janvier 2025
Programme de rachat d’actions (a)
—
—
(3 988)
—
—
—
(3 988)
—
Réduction de capital
(74)
—
3 868
(3 794)
—
—
—
—
—
Taxe sur annulation d'actions (b)
—
—
(15)
—
—
—
(15)
—
(15)
Plans de paiements en actions : •
Levée d’options
1
14
—
—
—
—
15
—
15
•
Émission d’actions gratuites et attribution définitive d’actions gratuites existantes
3
(3)
—
—
—
—
—
—
—
•
Valeur des services obtenus des salariés
—
—
—
—
177
—
177
—
177
•
Effet d’impôts lié aux paiements en actions
—
—
—
—
(7)
—
(7)
—
(7)
Autres variations liées à l’émission d’actions gratuites (c)
—
—
—
15
—
—
15
—
15
Autre variation des Intérêts non contrôlants (d)
—
—
—
—
—
—
—
(34)
(34)
Soldes au 30 juin 2025
2 456
11
(975)
65 689
5 430
(2 603)
70 008
271
70 279
Autres éléments du résultat global au titre de la période
—
—
—
(71)
—
160
89
(5)
84
Résultat de la période
—
—
—
2 001
—
—
2 001
13
2 014
Résultat global de l’ensemble consolidé au titre de la période
—
—
—
1 930
—
160
2 090
8
2 098
Paiement de dividendes aux Intérêts non contrôlants
—
—
—
—
—
—
—
(12)
(12)
Programme de rachat d’actions (a)
—
—
(1 027)
—
—
—
(1 027)
—
(1 027)
Réduction de capital
(22)
(170)
934
(742)
—
—
—
—
—
Taxe sur annulation d'actions (b)
—
—
(4)
—
—
—
(4)
—
(4)
Plans de paiements en actions : •
Levée d’options
—
—
—
—
—
—
—
—
—
•
Émission d’actions gratuites et attribution définitive d’actions gratuites existantes
—
—
—
—
—
—
—
—
—
•
Augmentation de capital réservée aux salariés
5
160
—
—
—
—
165
—
165
•
Valeur des services obtenus des salariés
—
—
—
—
142
—
142
—
142
•
Effet d’impôts lié aux paiements en actions
—
—
—
—
—
—
—
—
—
—
—
—
—
—
—
—
68
68
2 439
1
(1 072)
66 877
5 572
(2 441)
71 376
334
71 710
Autres variations des Intérêts non contrôlants (d) Soldes au 31 décembre 2025
(1)
Ces états financiers consolidés semestriels condensés non audités au 30 juin 2026 doivent être lus conjointement avec les états financiers consolidés annuels audités de Sanofi au 31 décembre 2025.
6
SANOFI
RAPPORT FINANCIER SEMESTRIEL 2026
Rapport financier semestriel 2026 Comptes semestriels consolidés condensés
(en millions d’euros)
Capital
Primes
Actions propres
Réserves et résultats accumulés
Stockoptions et autres paiements en actions
Autres éléments du résultat global
Part attribuable aux actionnaires de Sanofi
Intérêts non contrôlants
Total des capitaux propres
Soldes au 1er janvier 2026
2 439
1
(1 072)
66 877
5 572
(2 441)
71 376
334
71 710
Autres éléments du résultat global au titre de la période
—
—
—
290
—
1 315
1 605
12
1 617
Résultat de la période
—
—
—
1 957
—
—
1 957
40
1 997
Résultat global de l’ensemble consolidé au titre de la période
—
—
—
2 247
—
1 315
3 562
52
3 614
Paiement du dividende au titre de l’exercice 2025 (4,12 € par action)
—
—
—
(4 923)
—
—
(4 923)
—
(4 923)
Paiement de dividendes aux Intérêts non contrôlants
—
—
—
—
—
—
—
(26)
(26)
—
—
(1 003)
—
—
—
(1 003)
—
(1 003)
Réduction de capital (a)
(15)
—
596
(581)
—
—
—
—
—
Taxe sur annulation d'actions (b)
—
—
(3)
—
—
—
(3)
—
(3)
Programme de rachat d’actions
(a)
Plans de paiements en actions : •
Levée d’options
—
3
—
—
—
—
3
—
3
•
Émission d’actions gratuites et attribution définitive d’actions gratuites existantes (a)
4
(4)
102
(102)
—
—
—
—
—
•
Valeur des services obtenus des salariés
—
—
—
—
184
—
184
—
184
•
Effet d’impôts lié aux paiements en actions
—
—
—
—
1
—
1
—
1
—
—
—
10
—
—
10
—
10
2 428
—
(1 380)
63 528
5 757
(1 126)
69 207
360
69 567
Autres variations liées à l'émission d'actions gratuites (c) Soldes au 30 juin 2026
(a) Voir note B.8.2 et note B.8.3. (pour les montants afférents à l'exercice 2025, voir la note D.15.4. aux états financiers consolidés annuels 2025) (b) Impact de l'article 95 de la loi de finances française pour 2025 relatif à la taxation sur les annulations d'actions. (c) Cette ligne comprend l’impact de l’émission d’actions gratuites au bénéfice des anciens salariés de l’activité Opella postérieurement à la date de perte de contrôle d’Opella par Sanofi. (d) Cette ligne comprend principalement la variation des Intérêts non contrôlants sur des opérations de cession et d’acquisition.
Les notes jointes en pages 10 à 35 font partie intégrante des comptes semestriels consolidés condensés.
SANOFI
RAPPORT FINANCIER SEMESTRIEL 2026
7
Rapport financier semestriel 2026 Comptes semestriels consolidés condensés
Tableaux des flux de trésorerie consolidés (Non audité(1)) (en millions d’euros)
Note
30 juin 2026 (6 mois)
30 juin 2025 (6 mois)
1 957
5 812
Résultat net issu de l'activité Opella abandonnée
(26)
(2 881)
Part des Intérêts non contrôlants
40
25
Résultats des sociétés mises en équivalence nets des dividendes reçus
94
(15)
2 880
1 779
Résultat net consolidé – Part attribuable aux Actionnaires de Sanofi
Amortissements et dépréciations des immobilisations corporelles, droits d'utilisation et immobilisations incorporelles Plus ou moins-values sur cessions d’actifs non courants nettes d’impôts
(9)
(266)
Variation des impôts différés
(218)
(539)
Variation des provisions et autres passifs non courants (b)
195
(212)
Coût des avantages accordés (stock-options et autres paiements en actions)
184
171
Impact de la consommation des stocks acquis réévalués à la juste valeur
210
—
(a)
Autres éléments du résultat sans effet de trésorerie sur les flux de trésorerie liés aux activités opérationnelles (c)
(74)
106
Marge brute d’autofinancement
5 233
3 980
(Augmentation)/diminution des stocks
(958)
(635)
(27)
(785)
(Augmentation)/diminution des clients et comptes rattachés Augmentation/(diminution) des fournisseurs et comptes rattachés
(340)
187
Variation des autres actifs courants et autres passifs courants
735
620
4 643
3 367
Flux de trésorerie liés aux activités opérationnelles poursuivies
—
188
4 643
3 555
B.2. - B.3.
(1 296)
(1 420)
B.1.
(1 408)
(538)
Acquisitions des autres titres de participation
(189)
(423)
Produits de cessions d’immobilisations corporelles, incorporelles et autres actifs non courants nets d’impôts (f)
424
434
Cessions de titres consolidés et de participations des sociétés mises en équivalence nets d’impôts
78
—
Variation des autres actifs non courants
(32)
(32)
(2 423)
(1 979)
Flux de trésorerie liés aux activités opérationnelles d'Opella (activité abandonnée) Flux de trésorerie liés aux activités opérationnelles (d) Acquisitions d’immobilisations corporelles et incorporelles Acquisitions de titres consolidés et de participations des sociétés mises en équivalence (e)
Flux de trésorerie liés aux activités d’investissement poursuivies Flux de trésorerie liés aux activités d'investissement d'Opella (activité abandonnée) Flux de trésorerie nets liés à la transaction Opella
(g)
Flux de trésorerie liés aux activités d’investissement Augmentation de capital Sanofi
B.8.1.
—
(36)
(220)
10 742
(2 643)
8 727
18
29
(4 923)
(4 772)
Dividendes versés : •
aux Actionnaires de Sanofi
•
aux Intérêts non contrôlants
(25)
(27)
Nouveaux emprunts à plus d’un an
B.9.1.
2 304
2 993
Remboursements d’emprunts à plus d’un an
B.9.1.
(1 505)
(1 859)
Remboursement de la dette des contrats de location
(147)
(124)
Variation nette des emprunts à moins d’un an et autres instruments financiers (h)
1 955
3 322
(1 009)
(4 003)
(3 332)
(4 441)
Acquisitions d’actions propres et effet d'impôt associé
B.8.2
Flux de trésorerie liés aux activités de financement poursuivies Flux de trésorerie liés aux activités de financement d'Opella (activité abandonnée)
—
(48)
(3 332)
(4 489)
Incidence sur la trésorerie de la variation des taux de change
19
(42)
Trésorerie reclassée en Actifs destinés à être cédés au 31 décembre 2024
—
167
(1 313)
7 918
Flux de trésorerie liés aux activités de financement
Variation nette de la trésorerie Trésorerie à l’ouverture (i) Trésorerie à la clôture
B.9.
7 663
7 441
6 350
15 359
(a) Y compris actifs financiers non courants et impôts différés pour un montant nul au 30 juin 2026 et pour 48 millions d'euros au 30 juin 2025. (b) Cette ligne inclut les contributions versées à des fonds de pension (voir note B.12.). (c) Cette ligne comprend principalement le résultat de change latent constitué par la revalorisation des éléments monétaires en devises nonfonctionnelles et des instruments de couverture adossés. (1)
Ces états financiers consolidés semestriels condensés non audités au 30 juin 2026 doivent être lus conjointement avec les états financiers consolidés annuels audités de Sanofi au 31 décembre 2025.
8
SANOFI
RAPPORT FINANCIER SEMESTRIEL 2026
Rapport financier semestriel 2026 Comptes semestriels consolidés condensés
(d) Dont : 30 juin 2026 (6 mois)
30 juin 2025 (6 mois)
•
Impôts payés
(925)
(1 355)
•
Intérêts payés
(260)
(206)
•
Intérêts reçus
111
170
•
Dividendes reçus des sociétés non consolidées
3
5
(e) Cette ligne inclut les paiements relatifs à des compléments de prix compris dans le montant du passif valorisé et comptabilisé lors de l'acquisition de regroupement d'entreprises. Au 30 juin 2026, cette ligne inclut le décaissement net relatif à l'acquisition de Dynavax (voir note B.1.1.). Au 30 juin 2025, cette ligne inclut le décaissement net relatif à l'acquisition de Dren-0201. (f) Au 30 juin 2026 et au 30 juin 2025, cette ligne inclut principalement la cession d'actifs et d'activités liés à la rationalisation du portefeuille et la cession d'instruments de capitaux propres et de dettes. (g) Ce montant inclut au 30 juin 2025, (667) millions d'euros correspondant au montant de trésorerie et d'équivalents de trésorerie d'Opella au 30 avril 2025. (h) Au 30 juin 2026, cette ligne inclut principalement un programme de commercial paper aux États-Unis pour 2 388 millions d'euros, contre 3 353 millions d'euros au 30 juin 2025. Au 30 juin 2026, cette ligne inclut également une sortie de trésorerie de (249) millions d'euros liée au règlement des passifs financiers de Dynavax, acquise le 10 février 2026 (voir note B1.1.). (i) Inclut l'impact de l'amendement IFRS 9 relatif au classement des instruments financiers applicable à compter du 1er janvier 2026.
SANOFI
RAPPORT FINANCIER SEMESTRIEL 2026
9
Rapport financier semestriel 2026 Comptes semestriels consolidés condensés
Notes annexes – Semestre clos le 30 juin 2026 (Non auditées(1))
Préambule Sanofi et ses filiales (« Sanofi », « le Groupe » ou « l’entreprise ») est un leader mondial de la santé qui recherche, développe et commercialise des solutions thérapeutiques centrées sur les besoins des patients. Sanofi est cotée à Paris (Euronext : SAN) et à New York (Nasdaq : SNY). Les comptes semestriels consolidés condensés au 30 juin 2026 ont été examinés par le Conseil d’administration de Sanofi, qui s’est réuni le 29 juillet 2026.
A/ Bases de préparation des comptes semestriels et principes comptables A.1. Référentiel IFRS Les comptes semestriels consolidés sont établis et présentés de manière condensée conformément à la norme IAS 34, Information financière intermédiaire. Ainsi, les notes présentées portent sur les événements et transactions significatifs du semestre et doivent être lues en liaison avec les états financiers consolidés au 31 décembre 2025. Les principes comptables appliqués pour l’élaboration des comptes consolidés au 30 juin 2026 sont conformes au référentiel IFRS adopté par l’Union européenne et au référentiel publié par l’IASB. Le référentiel IFRS adopté par l’Union européenne au 30 juin 2026 est disponible à la rubrique Interprétations et Normes IAS/IFRS, sur le site suivant : https://www.efrag.org/en/financial-reporting/endorsement-status Les principes comptables appliqués à compter du 1er janvier 2026 sont identiques à ceux détaillés dans les notes aux comptes consolidés publiés au 31 décembre 2025. Le 30 mai 2024, l’IASB a publié des amendements aux normes IFRS 9 et IFRS 7 relatifs au classement et à l’évaluation des instruments financiers applicables au plus tôt au 1er janvier 2026 qui n’ont pas eu d’impact significatif sur les comptes. Le 18 juillet 2024, l'IASB a publié le volume 11 de ses améliorations annuelles à diverses normes qui pour l'essentiel ont la nature de précisions, applicables au plus tôt au 1er janvier 2026 et qui n’ont pas eu d’impact significatif sur les comptes. Le 18 décembre 2024, l’IASB a publié un amendement aux normes IFRS 9 et IFRS 7 Contrats d'électricité dont la production dépend de la nature applicable à compter du 1er janvier 2026. Cet amendement pourrait avoir principalement pour effet d’enrichir l’information fournie au titre de ces contrats dans l’annexe des comptes clos le 31 décembre 2026. Pour mémoire, les contrats d'achat d'énergie renouvelable signés au 31 décembre 2025 sont décrits en note D.21 aux états financiers consolidés du document d'enregistrement universel 2025. Dans ses comptes semestriels 2026, Sanofi a retenu un taux effectif moyen d’imposition tenant compte de la top-up taxe Pilier 2 applicable depuis le 1er janvier 2024 et qui incorpore également comme l'an passé un effet one-off lié à la composante 2025 de la surcharge exceptionnelle sur l'IS française (voir note B. 19).
A.2. Utilisation d'estimations et jugements La préparation des états financiers requiert, de la part de la Direction, l’utilisation d’estimations et d’hypothèses jugées raisonnables, susceptibles d’avoir un impact sur les montants d’actifs, passifs, produits et charges figurant dans les comptes, ainsi que sur les informations figurant en annexe sur les actifs et passifs éventuels à la date d’examen des états financiers. Les estimations et hypothèses, élaborées sur la base des informations disponibles lors de la clôture des comptes, portent en particulier sur : • les montants déduits des ventes au titre des retours attendus, ainsi qu’au titre des rétrocessions et des réductions de prix accordées ; • la dépréciation des actifs corporels et incorporels ; • la valorisation des écarts d’acquisition, des autres actifs incorporels acquis ainsi que leur durée de vie estimée ; • le montant des passifs ou provisions pour restructuration, litiges, risques fiscaux portant sur l'impôt sur le résultat et risques environnementaux . Les montants définitifs pourraient être différents de ces estimations. Par ailleurs, dans le cadre de l’information financière semestrielle et conformément à IAS 34, la charge d’impôts de Sanofi a été déterminée sur la base du taux effectif d’imposition estimé au titre de l’exercice. Ce taux est appliqué au résultat opérationnel (1)
Ces états financiers consolidés semestriels condensés non audités au 30 juin 2026 doivent être lus conjointement avec les états financiers consolidés annuels audités de Sanofi au 31 décembre 2025.
10
SANOFI
RAPPORT FINANCIER SEMESTRIEL 2026
Rapport financier semestriel 2026 Comptes semestriels consolidés condensés
des activités avant quote-part du résultat net des sociétés mises en équivalence et part attribuable aux Intérêts non contrôlants, augmenté des produits financiers et diminué des charges financières. Le taux effectif d’imposition estimé au titre de l’exercice est déterminé sur la base des taux d’impôts qui seront applicables et des prévisions de résultat avant impôts des juridictions fiscales de Sanofi.
A.3. Saisonnalité Les activités de Sanofi ne présentent pas de variation saisonnière significative.
A.4. Consolidation et conversion des comptes des filiales en hyperinflation En 2026, Sanofi continue à consolider par intégration globale ses filiales au Venezuela, considérant que les critères de contrôle au regard de la norme IFRS 10, États financiers consolidés, restent satisfaits. La contribution des filiales vénézuéliennes dans les comptes consolidés de Sanofi est non significative. En Argentine, le taux d'inflation cumulé au cours des trois dernières années est supérieur à 100 %, selon une combinaison d’indices utilisés pour mesurer l’inflation dans ce pays. En conséquence, Sanofi a traité l'Argentine (depuis le 1er juillet 2018) comme économie hyperinflationniste et applique les dispositions de la norme IAS 29. L'impact de ces retraitements n'est pas significatif aux bornes du Groupe. En Turquie, le taux d'inflation cumulé au cours des trois dernières années est supérieur à 100 %, selon une combinaison d’indices utilisés pour mesurer l’inflation dans ce pays. En conséquence, Sanofi a traité la Turquie (depuis le 1er janvier 2022) comme économie hyperinflationniste et applique les dispositions de la norme IAS 29. L'impact de ces retraitements n'est pas significatif aux bornes du Groupe.
A.5. Juste valeur des instruments financiers En application d’IFRS 13, « Évaluation à la juste valeur » et IFRS 7, « Instruments financiers : informations à fournir », les évaluations à la juste valeur doivent être classées selon une hiérarchie fondée sur les données utilisées pour évaluer la juste valeur de l’instrument qui comporte les niveaux suivants : • Niveau 1 : utilisation de cours de marchés actifs pour des actifs ou des passifs identiques (sans modification ni reconditionnement) ; • Niveau 2 : utilisation de cours de marchés actifs pour des actifs ou passifs semblables ou de techniques de valorisation dont toutes les données importantes sont fondées sur des informations de marché observables ; et • Niveau 3 : utilisation de techniques de valorisation dont les données importantes ne sont pas toutes fondées sur des informations de marché observables.
SANOFI
RAPPORT FINANCIER SEMESTRIEL 2026
11
Rapport financier semestriel 2026 Comptes semestriels consolidés condensés
Le tableau ci-dessous présente les informations requises par IFRS 7 relatives aux principes d’évaluation utilisés pour valoriser les instruments financiers. Principe de détermination de la juste valeur
Instrument Note Financier
Principe de valorisation
Niveau de la juste valeur
Données de marché Technique Modèle de d’évaluation Valorisation
Cours de change
Taux d’intérêt
Volatilités
B.6.
Actifs financiers évalués à la juste valeur (titres de capitaux propres cotés)
Juste valeur
1
Valeur de marché
Cotation de marché
N/A
B.6.
Actifs financiers évalués à la juste valeur (titres de dettes cotés)
Juste valeur
1
Valeur de marché
Cotation de marché
N/A
B.6.
Actifs financiers évalués à la juste valeur (titres de capitaux propres non cotés)
Juste valeur
3
Coût / Approche Lorsque le coût cesse d’être une mesure représentative de la juste valeur, par les une évaluation interne basée notamment sur la méthode des comparables est comparables réalisée. notamment
B.6.
Actifs financiers à la juste valeur (complément de prix à recevoir)
Juste valeur
3
S’agissant des compléments de prix à recevoir, la juste valeur de ces actifs est Approche déterminée par révision du complément de prix à la date d’arrêté selon la par le revenu méthode décrite dans la D.7.3. des états financiers consolidés au 31 décembre 2025.
B.6.
Prêts, avances et autres créances à long terme
Coût amorti
N/A
N/A
B.6.
Actifs financiers à la juste valeur (adossés à des plans d'avantages postérieurs à l'emploi)
Juste valeur
1
Valeur de marché
Cotation de marché
N/A
B.6.
Actifs financiers à la juste valeur sur option (adossés à des plans de rémunération différée)
Juste valeur
1
Valeur de marché
Cotation de marché
N/A
B.9.
Parts d’OPCVM
Juste valeur
1
Valeur de marché
Valeur liquidative
N/A
B.9.
Titres de créances négociables, billets de trésorerie, dépôts à vue et dépôts à terme
Coût amorti
N/A
N/A
S’agissant d’instruments de durée inférieure à 3 mois, le coût amorti constitue une approximation acceptable de la juste valeur indiquée dans les notes annexes aux comptes consolidés.
Le coût amorti des prêts, avances et autres créances à long terme ne présente pas à la date de clôture d’écart significatif par rapport à leur juste valeur.
B.9. B.12.
Dettes financières
Coût amorti (a)
N/A
N/A
S’agissant des dettes financières de durée inférieure à 3 mois, le coût amorti constitue une approximation acceptable de la juste valeur indiquée dans les notes annexes aux comptes consolidés. S’agissant des dettes financières de durée supérieure à 3 mois, la juste valeur indiquée dans les notes annexes aux comptes consolidés est déterminée soit par référence aux cotations à la date d’arrêté des comptes (pour les instruments cotés) soit par actualisation des flux futurs résiduels sur la base des données de marché observables à cette date (pour les instruments non cotés). Concernant les dettes financières basées sur des paiements variables tels que des redevances, la juste valeur est déterminée sur la base des projections de flux de trésorerie futurs actualisés.
B.9.
Dette locative
Coût amorti
N/A
N/A
La dette au titre des loyers futurs est actualisée à l’aide du taux marginal d’emprunt.
B.10.
Contrats à terme sur les devises
Juste valeur
2
Valeur actuelle Approche des flux de par le revenu trésorerie futurs
Mid Market Spot
< 1an : Mid Money Market
1an : Mid Zero Coupon
N/A
B.10.
Swaps de taux d’intérêts
Juste valeur
2
Valeur actuelle Approche flux de par le revenu des trésorerie futurs
Mid Market Spot
< 1an : Mid Money Market et futures de taux Euronext
1an : Mid Zero Coupon
N/A
B.10.
Cross-currency swaps
Juste valeur
2
Valeur actuelle Approche des flux de par le revenu trésorerie futurs
Mid Market Spot
< 1an : Mid Money Market et futures de taux Euronext
1an : Mid Zero Coupon
N/A
B.11.
Passifs liés à des regroupements d’entreprises et à des Intérêts non contrôlants
3
S’agissant des contreparties éventuelles à payer sur les regroupements d’entreprises, ils constituent, conformément à la norme IAS 32, des passifs Approche La juste valeur de ces passifs est déterminée par révision du par le revenu financiers. complément de prix à la date d’arrêté selon la méthode décrite dans la note B.11.
Juste valeur
(a) Dans le cas des dettes financières qualifiées d’éléments couverts dans une relation de couverture de juste valeur, la valeur au bilan dans les comptes consolidés inclut la variation de juste valeur liée au(x) risque(s) couvert(s).
12
SANOFI
RAPPORT FINANCIER SEMESTRIEL 2026
Rapport financier semestriel 2026 Comptes semestriels consolidés condensés
A.6. Nouveaux textes IFRS applicables au plus tôt à partir de 2027 Le 9 avril 2024, l’IASB a publié la norme IFRS 18 Presentation and Disclosure in Financial Statements applicable à compter du 1er janvier 2027. La transition, en termes d’adaptation du plan de comptes et des systèmes d’information financière se poursuit conformément au calendrier prévu. En lien avec la communication du Groupe dans ses états financiers 2025 publiés, le Groupe poursuit ses efforts en matière de déploiement de la nouvelle norme. Ce dernier initié au quatrième trimestre 2025 a progressé et l'analyse d’impact évolué en cohérence avec le calendrier de déploiement. La future structure du compte de résultat du groupe présentera les charges d’exploitation par fonction et reflètera des choix de présentation basés sur le principe de résumé structuré utile prescrit par la norme IFRS 18, intégrant la classification des éléments du compte de résultat selon les cinq catégories : exploitation, investissement, financement, impôt sur le résultat et résultat des activités abandonnées et l’insertion de sous-totaux uniquement prévus par la norme IFRS 18, et enfin considérant que le Groupe, dans son ensemble, a une seule activité principale. Concernant l’obligation de présenter dans les notes aux états financiers les indicateurs alternatifs de performance («MPMs») de la direction répondant à la définition de la norme, ceux-ci sont identifiés. Conformément à la communication dans les états financiers 2025, ceux-ci principalement sont la marge brute des activités, le résultat opérationnel des activités et le résultat net des activités. Le résultat opérationnel des activités, la marge brute des activités et le résultat net des activités sont des mesures non IFRS que Sanofi utilise aujourd’hui dans sa communication financière. Aucun impact significatif n'a été identifié à ce stade sur ces indicateurs de performance. La note de transition prévue lors de la publication du document universel d'enregistrement de 2026 comportera une réconciliation, pour les années comparatives 2026 et 2025, entre les montants pour chaque ligne du compte de résultat présentés selon la norme IFRS 18 applicable à partir de l’année 2027 et ceux présentés selon le texte actuellement en vigueur (norme IAS 1). En outre, la présentation du tableau de flux de trésorerie consolidé sera modifiée avec comme point de départ le Résultat opérationnel au lieu du Résultat net consolidé - Part attribuable aux Actionnaires de Sanofi. Enfin, conformément à la communication de fin d’année 2025, Sanofi n’applique pas cette nouvelle norme par anticipation. Le 13 novembre 2025, l’IASB a publié un amendement à la norme IAS 21 « Effets des variations des taux de change : conversion dans une monnaie de présentation hyperinflationniste » applicable à compter du 1er janvier 2027 (sous réserve de son adoption par l’Union européenne). Sanofi n’attend aucun impact matériel et n’adoptera pas par anticipation cet amendement.
SANOFI
RAPPORT FINANCIER SEMESTRIEL 2026
13
Rapport financier semestriel 2026 Comptes semestriels consolidés condensés
B/ Éléments significatifs du premier semestre 2026 B.1. Transactions significatives du premier semestre 2026 B.1.1. Acquisition de Dynavax Technologies Corporation Le 10 février 2026, Sanofi a finalisé l'acquisition de Dynavax Technologies Corporation (« Dynavax »), entreprise de vaccins qui commercialise un vaccin contre l’hépatite B pour adultes (HEPLISAV-B) et développe un candidat vaccin différencié contre le zona. Cette acquisition renforce la présence de Sanofi dans le domaine de la vaccination pour adultes en combinant l’expertise vaccinale de Dynavax avec la dimension internationale, les capacités en développement et la force de distribution de Sanofi. HEPLISAV-B, le vaccin de Dynavax contre l’hépatite B pour adultes, est actuellement commercialisé aux États-Unis. Il se différencie par son schéma posologique à seulement deux doses sur un mois, qui permet d’obtenir des taux élevés de séroprotection plus rapidement que les autres vaccins contre l’hépatite B, qui nécessitent trois doses réparties sur six mois. L’acquisition comprend aussi le candidat vaccin de Dynavax contre le zona (Z-1018), qui est actuellement en phase 1/2 de développement clinique, de même que d’autres projets de pipeline de vaccins. Sanofi a lancé une offre publique d’achat en numéraire pour acquérir toutes les actions en circulation de Dynavax pour 15,50 dollars par action en numéraire, soit une valeur totale sur une base entièrement diluée en actions d’environ 2,2 milliards de dollars, comprenant le remboursement ultérieur de la dette financière court terme pour un montant de 0,3 milliard de dollars. L'affectation provisoire du prix d'acquisition a conduit à la constatation d'un écart d'acquisition de 204 millions d'euros et se présente comme suit : (en millions d’euros)
Juste valeur à la date d'acquisition
Impôts différés nets
1 150 429 169 (249) (132)
Actif net de Dynavax
1 367
Autres actifs incorporels Autres actifs et passifs courants et non courants Trésorerie et équivalents de trésorerie Dette financière court terme
Écart d’acquisition
204
Prix d'acquisition
1 571
Les autres actifs incorporels comprennent en particulier le vaccin commercialisé HEPLISAV-B. L’écart d’acquisition représente principalement les effets des synergies et autres avantages attendus de l'intégration de Dynavax au sein du groupe Sanofi. L'écart d'acquisition généré sur cette opération ne donne pas lieu à déduction fiscale. La contribution de Dynavax aux ventes nettes et au résultat net des opérations du segment Biopharma (pour une définition voir la Note B21 "Information sectorielle") depuis la date d’acquisition s’élèvent à 144 millions d’euros et 89 millions d’euros, respectivement. Sur la même période, Dynavax a eu une contribution négative de 63 millions d’euros au résultat net consolidé, incluant l’amortissement des actifs incorporels pour 38 millions d’euros, l’amortissement et les charges liés à l’impact de réévaluation à la juste valeur des stocks pour 44 millions d’euros et les coûts de restructuration et assimilés pour 63 millions d’euros. L’impact lié à cette acquisition reflété sur la ligne Acquisitions de titres consolidés et de participations des sociétés mises en équivalence dans le tableau des flux de trésorerie est un décaissement de 1 403 millions d’euros.
B.1.2. Projet de cession de l'activité de génériques au Brésil, Medley Le 6 mars 2026, Sanofi et le groupe EMS, un important conglomérat pharmaceutique brésilien, ont annoncé la signature d'un accord définitif portant sur l'acquisition de 100 % de Medley, l'une des principales marques de médicaments génériques au Brésil. A compter de cette date, la réalisation de l'opération étant considérée comme hautement probable, l'ensemble des actifs de Medley ainsi que les passifs directement liés à ces actifs, depuis apportés à l'entité juridique formée le 1er mai 2026, Medley Farmaceutica Ltda, dont les titres seront cédés, sont classés sur les lignes du bilan consolidé « Actifs destinés à la vente » et « Passifs liés aux actifs destinés à la vente » conformément aux dispositions prévues par IFRS 5, représentant la principale composante de ces lignes du bilan consolidé au 30 juin 2026. L'activité de génériques au Brésil ne répond pas à la définition d'activité abandonnée selon la norme IFRS 5 (voir note B.7. des états financiers consolidés au 31 décembre 2025) et par conséquent le résultat net de cette activité n'est pas présenté de manière séparée dans le compte de résultat. Un gain net est attendu à la clôture de l'opération. Par conséquent, aucune dépréciation n'a été constatée sur la valeur comptable des actifs nets de Medley Farmaceutica Ltda à la date de leur reclassement en actifs destinés à la vente.
14
SANOFI
RAPPORT FINANCIER SEMESTRIEL 2026
Rapport financier semestriel 2026 Comptes semestriels consolidés condensés
La clôture de l'opération est prévue au plus tôt au quatrième trimestre 2026, sous réserve de la réalisation des conditions suspensives habituelles, notamment l'autorisation de l'Autorité brésilienne de la concurrence (Conseil administratif de défense économique – CADE).
B.2. Immobilisations corporelles Les acquisitions d’immobilisations corporelles par secteur du premier semestre 2026 ainsi que les intérêts capitalisés se présentent comme suit : 30 juin 2026
30 juin 2025
Acquisitions
763
702
Biopharma
763
663
594
453
Opella (activité abandonnée)
—
39
Dont Intérêts capitalisés
23
22
(en millions d’euros)
Dont Manufacturing & Supply
Les commandes fermes d’immobilisations s’élèvent à 1 336 millions d’euros au 30 juin 2026.
B.3. Écarts d'acquisition et autres actifs incorporels Les écarts d’acquisition s’élèvent à 41 954 millions d’euros au 30 juin 2026 contre 41 300 millions d’euros au 31 décembre 2025. La variation s'explique par l'impact de change et la comptabilisation de l'écart d'acquisition lié à l'acquisition de Dynavax (voir note B.1.1.), compensés partiellement par le reclassement de l'écart d'acquisition attribué à l'activité générique au Brésil en Actifs destinés à être cédés, à la suite du projet de désinvestissement (voir note B.1.2.). Les autres actifs incorporels ont varié au cours du premier semestre 2026 de la manière suivante : (en millions d'euros) Valeur brute au 1er janvier 2026 Variation de périmètre
(a)
Recherche acquise
Produits, marques, et autres droits
Logiciels et progiciels
Total autres actifs incorporels
14 951
66 746
1 888
83 585 1 150
—
1 149
1
Acquisitions/augmentations
321
122
88
531
Cessions/diminutions
(534)
(17)
(28)
(579)
Différences de conversion
324
1 232
12
1 568
Transferts (b)
(245)
(162)
(4)
(411)
Valeur brute au 30 juin 2026
14 817
69 070
1 957
85 844
Amortissements et dépréciations au 1er janvier 2026
(6 220)
(49 624)
(1 480)
(57 324)
—
(1 106)
(58)
(1 164)
(970)
(61)
(17)
(1 048)
Dotations aux amortissements Dépréciations nettes (c) Cessions/diminutions
534
17
26
577
Différences de conversion
(135)
(785)
(10)
(930)
Transferts (b)
—
400
4
404
(6 791)
(51 159)
(1 535)
(59 485)
Valeur nette au 1er janvier 2026
8 731
17 122
408
26 261
Valeur nette au 30 juin 2026
8 026
17 911
422
26 359
Amortissements et dépréciations au 30 juin 2026
(a) La ligne « Variation de périmètre » correspond principalement à la valeur des actifs incorporels reconnus dans le cadre de l'acquisition de Dynavax (voir note B.1.). (b) La ligne « Transferts » comprend principalement la recherche acquise mise en service au cours de l’année et également le reclassement d’actifs en Actifs destinés à être cédés. (c) Voir note B.4.
Les « Produits, marques et autres droits » comprennent essentiellement : • des « Produits commercialisés », dont la valeur nette est de 17,1 milliards d’euros au 30 juin 2026 contre 16,2 milliards d’euros au 31 décembre 2025 et la durée d'amortissement moyenne pondérée est d'environ 11 années; et • des « Plateformes technologiques » mises en service dont la valeur nette est de 0,8 milliard d’euros au 30 juin 2026 (contre 0,9 milliard d’euros au 31 décembre 2025). La durée d’amortissement moyenne pondérée est d’environ 18 années.
B.4. Dépréciation des actifs incorporels Au premier semestre 2026, le suivi des indicateurs de perte de valeur des autres actifs incorporels (hors logiciels) a conduit à enregistrer une dépréciation nette d’un montant de 1 031 millions d’euros principalement liée à la dépréciation d'amlitelimab pour un montant de 952 millions d'euros, soit la totalité de la valeur nette comptable de cet actif incorporel.
SANOFI
RAPPORT FINANCIER SEMESTRIEL 2026
15
Rapport financier semestriel 2026 Comptes semestriels consolidés condensés
B.5. Participation dans des sociétés mises en équivalence Les sociétés mises en équivalence comprennent les entreprises associées et les coentreprises (voir note B.1. aux états financiers consolidés au 31 décembre 2025). Les participations concernant les sociétés mises en équivalence s’analysent comme suit : % de participation
30 juin 2026
31 décembre 2025
OPAL JV Co (a)
(en millions d'euros)
48,2
2 965
2 934
EUROAPI (b)
29,6
38
64
31,2
93
112
50,0
52
59
Infraserv GmbH & Co. Höchst KG
(c)
MSP Vaccine Company (d) Autres participations Total
—
59
90
3 207
3 259
(a) Suite à la perte de contrôle dans Opella en 2025, Sanofi détient 48,2 % d'OPAL JV Co (CD&R détient 50 % et Bpifrance 1,8 %). Au 31 décembre 2025, l'investissement comprend un prêt de 241 millions d'euros à OPAL JV Co faisant en substance partie de l'investissement. En 2026, à la suite de la finalisation des états financiers d'Opella au 30 avril 2025, ce prêt a été converti en actions ordinaires. (b) La participation mise en équivalence EUROAPI inclut une perte de valeur comptabilisée sur la base du cours de bourse (1,33 euros au 30 juin 2026 et 2,27 euros au 31 décembre 2025). (c) Coentreprise. (d) Coentreprise, MSP Vaccine Company détient 100 % de MCM Vaccine B.V.
La Quote-part de résultat net des sociétés mises en équivalence s'élève à un gain net de 2 millions d'euros sur le premier semestre 2026 qui inclut une perte nette de 39 millions d'euros au titre de la quote-part de Sanofi dans OPAL JV Co (à comparer à un gain net de 85 millions d'euros sur le premier semestre 2025 qui inclut un gain net de 11 millions d'euros au titre de la quotepart de Sanofi dans OPAL JV Co pour la période commençant le 1er mai 2025 et se terminant le 30 juin 2025). Les états financiers incluent certaines transactions commerciales entre Sanofi et des sociétés qui sont consolidées par mise en équivalence, considérées comme des parties liées. Le tableau ci-dessous reprend les principales transactions de la période et soldes avec les parties liées : (en millions d'euros)
Au 30 juin 2026
Au 30 juin 2025
Ventes (c)
31
29
Redevances et autres produits (c)
142
63
Achats et autres charges (y compris frais de recherche) (c)
548
371
(en millions d'euros) Créances clients et autres créances (a) Autres actifs
Au 30 juin 2026 Au 31 décembre 2025 430
588
(b)
84
143
Autres passifs
379
710
(a) Ce poste inclut les prêts aux coentreprises et entreprises associées. (b) En octobre 2024, Sanofi a complété son investissement dans EUROAPI à hauteur de 200 millions d’euros sous la forme de titres subordonnés à durée indéterminée. Au 30 juin 2026, la juste valeur de cet investissement s'élève à 84 millions d'euros contre 143 millions d'euros au 31 décembre 2025. (c) Au 30 juin 2025, ces postes comprennent les transactions de Sanofi avec OPAL JV Co entre le 1er mai et le 30 juin 2025.
16
SANOFI
RAPPORT FINANCIER SEMESTRIEL 2026
Rapport financier semestriel 2026 Comptes semestriels consolidés condensés
Les principaux agrégats des états financiers au 30 juin 2026 d'OPAL JV Co tels que communiqués selon les délais de consolidation de Sanofi, non audités, sont présentés ci-dessous : (en millions d'euros)
Au 30 juin 2026
Au 30 juin 2025
2 657
887
(61)
24
Compte de résultat consolidé Chiffre d'affaires et autres revenus (a) Résultat net consolidé (a) État consolidé du résultat global Autres éléments du résultat global
83
(1)
Résultat global
22
23
a) A compter du 1er mai 2025, OPAL JV Co est comptabilisée en mise en équivalence après la perte de contrôle dans Opella par Sanofi le 30 avril 2025.
(en millions d'euros)
Au 30 juin 2026
Au 31 décembre 2025
Actifs non courants
16 673
15 013
Actifs courants
2 925
2 859
Total Actif
19 598
17 872
Capitaux propres consolidés d'OPAL JV Co - part du groupe
5 958
5 380
Bilan consolidé
Intérêts non contrôlants
436
490
Capitaux propres consolidés
6 394
5 870
Passifs non courants
11 575
9 850
Passifs courants
1 629
2 152
Total Passif
13 204
12 002
Total passif et capitaux propres
19 598
17 872
Au 30 juin 2026
Au 31 décembre 2025
2 435
2 200
B.6. Autres actifs non courants Les autres actifs non courants comprennent les éléments suivants : (en millions d'euros) Instruments de capitaux propres à la juste valeur en autres éléments du résultat global Instruments de dette à la juste valeur en autres éléments du résultat global
363
389
Autres actifs financiers à la juste valeur par le compte de résultat
1 099
1 004
Engagements de retraite financés d’avance
203
194
Charges constatées d'avance à long terme
185
175
Prêts, avances et autres créances à long terme
421
393
Instruments financiers dérivés Total
26
9
4 732
4 364
B.7. Clients et comptes rattachés Les créances clients s’analysent comme suit : Au 30 juin 2026
Au 31 décembre 2025
Valeur brute
(en millions d’euros)
8 818
8 510
Dépréciation
(104)
(100)
Valeur nette
8 714
8 410
L’incidence des pertes de valeur sur créances clients et des reprises représente une charge nette de 6 millions d’euros sur le premier semestre 2026 (contre une charge nette de 4 millions d’euros sur le premier semestre 2025). La répartition de la valeur brute des créances clients échues, en fonction de leur ancienneté, s’analyse de la façon suivante : Créances clients échues valeur brute
Créances < à 1 mois
Créances de 1 à 3 mois
Créances de 3 à 6 mois
Créances de 6 à 12 mois
Créances
à 12 mois
Au 30 juin 2026
522
183
127
142
27
43
Au 31 décembre 2025
468
184
134
71
27
52
(en millions d’euros)
Les créances échues à plus d’un mois correspondent principalement à des créances auprès d’organismes publics.
SANOFI
RAPPORT FINANCIER SEMESTRIEL 2026
17
Rapport financier semestriel 2026 Comptes semestriels consolidés condensés
Certaines filiales de Sanofi ont transféré sans recours des créances clients à des sociétés d’affacturage ou à des établissements bancaires. Conformément aux conditions mentionnées dans la note B.8.6. aux états financiers consolidés au 31 décembre 2025, le montant des créances décomptabilisées s’élève à 11 millions d’euros au 30 juin 2026 contre un montant nul au 31 décembre 2025. Le montant résiduel des garanties liées à ces cessions est marginal au 30 juin 2026.
B.8. Capitaux propres consolidés B.8.1. Capital Le capital social s’élève à 2 428 198 054 euros et est constitué de 1 214 099 027 actions (nombre total d’actions émises) de 2 euros au 30 juin 2026. Le détail des actions propres détenues par Sanofi se présente comme suit : Nombre d’actions (en millions)
% du capital de l’exercice
30 juin 2026
16,03
1,320 %
31 décembre 2025
11,96
0,981 %
30 juin 2025
10,66
0,868 %
1er janvier 2025
9,53
0,755 %
À la suite des levées d’options de souscription d’actions Sanofi, 30 070 actions ont été émises sur le premier semestre 2026. Par ailleurs, dans le cadre des plans d’attribution d’actions gratuites, 3 072 520 actions ont été définitivement acquises sur le premier semestre 2026, dont 1 886 523 actions par émission d’actions nouvelles et 1 185 997 actions par attribution d’actions gratuites existantes.
B.8.2. Rachat d'actions Sanofi L’assemblée générale ordinaire des actionnaires de Sanofi du 30 avril 2025 a autorisé un programme de rachat des actions Sanofi pour une durée de 18 mois. Dans ce cadre, Sanofi a racheté 12 571 455 actions au cours du premier semestre 2026 pour un montant total de 1 003 millions d’euros. Au cours de la réunion du Conseil d’administration en date du 29 janvier 2025, le Conseil a autorisé Sanofi à procéder au rachat des actions de la Société, pour un montant ne pouvant pas excéder 5 milliards d’euros, dans les conditions et selon les modalités fixées par l’Assemblée générale du 30 avril 2024 dans sa 19e résolution. Dans le cadre de cette autorisation, Sanofi a conclu avec son actionnaire historique L’Oréal un contrat de rachat d'actions en date du 2 février 2025 pour l’acquisition de 2,34 % de son capital social, soit l’équivalent de 29 556 650 actions, pour un montant global d’environ 3 milliards d’euros, représentant un prix de 101,50 euros par action. La conclusion de ce contrat a été approuvée par le Conseil d’administration le même jour préalablement à la signature dudit contrat et conformément à la procédure des articles L. 225-38 et suivants du Code de commerce. L’assemblée générale mixte des actionnaires de Sanofi le 29 avril 2026 a autorisé un programme de rachat des actions Sanofi pour une durée de 18 mois. Dans ce cadre, Sanofi n'a pas fait usage de cette autorisation au cours du premier semestre 2026.
B.8.3. Réduction de capital Au cours du premier semestre 2026, Sanofi a procédé à des annulations d’actions auto-détenues pour un total de 596 millions d'euros suite aux décisions du Conseil d'administration du 4 mars 2026. Ces annulations n’ont pas eu d’impact sur les capitaux propres de Sanofi à l'exception de la taxe sur annulation d'actions.
B.8.4. Programmes d'attribution d'actions Les programmes d’attribution d’actions sont comptabilisés en application des principes décrits dans la note B.24.3. aux états financiers consolidés au 31 décembre 2025. Les principales caractéristiques des plans attribués en 2026 sont les suivantes:
18
SANOFI
RAPPORT FINANCIER SEMESTRIEL 2026
Rapport financier semestriel 2026 Comptes semestriels consolidés condensés
2026 Plans d’actions de performance
Type de programme Date du conseil d’administration ayant décidé l’émission
29 avril 2026
Date du conseil d’administration ayant décidé les émissions pour la Directrice Générale
1 mai 2026
Nombre total d’actions octroyées soumises à une période de service de 3 ans
5 087 518
Dont non soumises à condition de marché
3 367 862
Juste valeur d’une action (a)
65,86 €
Dont soumises à des conditions de marché
1 719 656
Juste valeur d’une action hors Directrice Générale portant sur 1 674 656 actions (b)
57,99 €
Juste valeur d’une action pour la Directrice Générale portant sur 45 000 actions (b)
53,46 €
Nombre total d’actions octroyées soumises à une période de service de 5 ans
180 000
Juste valeur d’une action pour la Directrice Générale portant sur 180 000 actions (c)
40,46 €
Juste valeur des plans à l’attribution (en millions d’euros)
329
(a) Prix du marché de l’action à la date d’attribution, ajusté des dividendes attendus pendant la période d’acquisition des droits. (b) Pondération entre une juste valeur évaluée selon le modèle Monte Carlo et le prix du marché de l’action à la date d’attribution, ajusté des dividendes attendus pendant la période d’acquisition des droits de 3 ans. (c) Pondération entre une juste valeur évaluée selon le modèle Monte Carlo et le prix du marché de l’action à la date d’attribution, ajusté des dividendes attendus pendant la période d’acquisition des droits de 5 ans.
La charge totale relative à l’ensemble des plans d’attribution d’actions gratuites, ainsi que le nombre d’actions en cours d’acquisition, sont décrits dans le tableau ci-dessous : 30 juin 2026 Charge totale des plans d’attribution d’actions gratuites (en millions d’euros) Nombre d’actions en cours d’acquisition
30 juin 2025
138
146
12 995 668
11 550 347
Dont actions relatives aux plans 2026
5 267 518
—
Dont actions relatives aux plans 2025
3 897 342
4 020 451
Dont actions relatives aux plans 2024
3 772 461
4 110 089
Dont actions relatives aux plans 2023
58 347
3 313 588
Dont actions relatives aux plans 2022
—
106 219
B.8.5. Augmentations de capital réservées aux salariés Le Conseil d’administration du 28 janvier 2026 a décidé une augmentation de capital réservée aux salariés et a offert aux salariés de Sanofi la possibilité de souscrire à une augmentation de capital à un prix de souscription de 59,87 euros par action. La période de souscription s'est déroulée du 9 au 29 juin 2026. L’augmentation de capital a donné lieu à la souscription de 2 431 494 actions et à l’émission de 104 327 actions à titre d’abondement immédiat. Le montant de la charge enregistrée au 30 juin 2026 au titre de cette augmentation de capital conformément à la norme IFRS 2, Paiements fondés sur des actions, sur la base de la décote accordée aux salariés, s’élève à 46 millions d’euros. Le Conseil d’administration du 29 janvier 2025 a décidé une augmentation de capital réservée aux salariés et a offert aux salariés de Sanofi la possibilité de souscrire à une augmentation de capital à un prix de souscription de 72,97 euros par action. La période de souscription s'est déroulée du 10 au 30 juin 2025. L’augmentation de capital a donné lieu à la souscription de 2 260 776 actions et à l’émission de 116 794 actions à titre d’abondement immédiat. Le montant de la charge enregistrée au 30 juin 2025 au titre de cette augmentation de capital conformément à la norme IFRS 2, Paiements fondés sur des actions, sur la base de la décote accordée aux salariés, s’élève à 31 millions d’euros.
SANOFI
RAPPORT FINANCIER SEMESTRIEL 2026
19
Rapport financier semestriel 2026 Comptes semestriels consolidés condensés
B.8.6. Plan d'option de souscription d'actions Il n’y a pas eu de plan d'options de souscription d'actions octroyé au cours du premier semestre 2026 ni en 2025. Il n’y a plus de charge relative aux plans d’options de souscription d’actions comptabilisée en contrepartie des capitaux propres en 2026 et 2025. Le tableau ci-dessous synthétise les informations concernant les options en circulation et en particulier les options exerçables au 30 juin 2026 : En circulation
Exerçables
Nombre d'options
Durée de vie moyenne résiduelle (en années)
Prix moyen pondéré par actions (en euros)
Nombre d'options
Prix moyen pondéré par actions (en euros)
De 60,00 à 70,00 euros par action
168 784
1,84
65,84
168 784
65,84
De 70,00 à 80,00 euros par action
213 400
2,84
76,71
213 400
76,71
De 80,00 à 90,00 euros par action
257 010
0,86
88,97
257 010
88,97
Total
639 194
Fourchette des prix d’exercice par action
639 194
B.8.7. Résultat par action Résultat net : 30 juin 2026 (6 mois)
30 juin 2025 (6 mois)
Résultat net consolidé Part attribuable aux Actionnaires de Sanofi
1 957,0
5 812,0
dont résultat net des activités poursuivies
1 931,0
2 941,0
dont résultat net des activités abandonnées
26,0
2 871,0
30 juin 2026 (6 mois)
30 juin 2025 (6 mois)
1 200,4
1 225,5
Ajustement pour options sur actions ayant un effet dilutif
—
0,1
Ajustement pour actions gratuites
5,1
5,1
1 205,5
1 230,7
(en millions d’euros)
Nombre d'actions : (en millions d'actions) Nombre moyen d’actions en circulation
Nombre moyen d’actions pour le calcul du résultat dilué
Au 30 juin 2026 et au 30 juin 2025, toutes les options sur actions ont été prises en compte dans le calcul du résultat dilué par action car dilutives. Résultat par action : Le résultat par action dilué est calculé en tenant compte du nombre d'actions en circulation, augmenté des options sur actions ayant un effet dilutif et des actions gratuites. (en euros)
30 juin 2026 (6 mois)
30 juin 2025 (6 mois)
•
Résultat de base par action des activités poursuivies (en euros)
1,61
2,40
•
Résultat de base par action des activités abandonnées (en euros)
0,02
2,34
- Résultat de base par action (en euros)
1,63
4,74
•
Résultat dilué par action des activités poursuivies (en euros)
1,60
2,39
•
Résultat dilué par action des activités abandonnées (en euros)
0,02
2,33
1,62
4,72
- Résultat dilué par action (en euros)
20
SANOFI
RAPPORT FINANCIER SEMESTRIEL 2026
Rapport financier semestriel 2026 Comptes semestriels consolidés condensés
B.8.8. Autres éléments du résultat global Les autres éléments du résultat global ont varié de la manière suivante : (en millions d’euros)
30 juin 2026 (6 mois)
30 juin 2025 (6 mois)
157
105
Gains/(pertes) actuariels : •
Gains/(pertes) actuariels hors sociétés mises en équivalence
•
Gains/(pertes) actuariels sur sociétés mises en équivalence nets d'impôts
•
Effet d’impôts
1
1
(20)
(25)
Instruments de capitaux propres en actifs financiers et passifs financiers: •
Variation de juste valeur hors sociétés mises en équivalence
175
222
•
Variation de juste valeur sur sociétés mises en équivalence nette d'impôts
—
—
•
Instruments de couverture du risque actions qualifiés de couverture de juste valeur
—
—
•
Effet d’impôts
(23)
(60)
290
243
Éléments ne faisant pas ultérieurement l’objet d’un reclassement en résultat Instruments de dette en actifs financiers : •
Variation de juste valeur hors sociétés mises en équivalence (a)
5
3
•
Variation de juste valeur sur sociétés mises en équivalence nette d'impôts
—
—
•
Effet d’impôts
—
—
Couvertures de flux de trésorerie et de juste valeur: •
Variation de juste valeur hors sociétés mises en équivalence (b)
5
(23)
•
Variation de juste valeur sur sociétés mises en équivalence nette d'impôts
9
—
•
Effet d’impôts
(2)
6
1 747
(5 266)
Variation des écarts de conversion : •
Écarts de change résultant de la conversion des filiales étrangères hors sociétés mises en équivalence (c)
•
Écarts de change résultant de la conversion des sociétés mises en équivalence
•
Couvertures d’investissements nets à l’étranger
•
Effet d’impôts
Éléments faisant ultérieurement l’objet d’un reclassement en résultat
55
(26)
(489)
390
(3)
(101)
1 327
(5 017)
(a) Dont recyclés par le compte de résultat: montants non significatifs sur l'ensemble des périodes. (b) Dont recyclés par le compte de résultat : 1 million d'euros sur le premier semestre 2026, 2 millions d'euros sur le premier semestre 2025. (c) L'écart de change résulte de la conversion en euros des états financiers des filiales étrangères, lié principalement à l'appréciation du dollar. Dont recyclés par le compte de résultat : une perte de 146 millions d'euros sur le premier semestre 2026 contre une perte de 459 millions d'euros sur le premier semestre 2025 relatifs à la déconsolidation d'Opella.
B.9. Emprunts, dettes financières, trésorerie et équivalents de trésorerie La situation financière de Sanofi a évolué comme suit : Au 30 juin 2026
Au 31 décembre 2025
Emprunts à long terme
(en millions d’euros)
14 646
14 248
Emprunts à court terme et part à court terme de la dette à long terme
7 026
4 342
Instruments dérivés de taux et de change dédiés à la gestion de la dette financière
221
112
Total dette financière
21 893
18 702
Trésorerie et équivalents de trésorerie
(6 350)
(7 657)
(30)
(37)
15 513
11 008
Instruments dérivés de taux et de change dédiés à la gestion de la trésorerie et des équivalents de trésorerie Dette financière nette
(a)
a) La dette financière nette n’inclut pas le montant de la dette locative qui s'élève à 1 904 millions d'euros au 30 juin 2026, contre 1 739 millions d'euros au 31 décembre 2025.
Le total « Dette financière nette » est un agrégat utilisé par la Direction et les investisseurs pour mesurer l’endettement net global de Sanofi.
SANOFI
RAPPORT FINANCIER SEMESTRIEL 2026
21
Rapport financier semestriel 2026 Comptes semestriels consolidés condensés
B.9.1. Valeur de remboursement de la dette financière nette La réconciliation entre la valeur de la dette financière nette au bilan et la valeur de remboursement au 30 juin 2026 est détaillée ci-dessous : Valeur de remboursement Valeur au bilan au 30 juin 2026
Coût amorti
Ajustement dette en juste valeur
Emprunts à long terme
14 646
44
61
14 751
14 360
Emprunts à court terme et part à court terme de la dette à long terme
7 026
1
—
7 027
4 344
Instruments dérivés de taux et de change dédiés à la gestion de la dette financière
221
—
(131)
90
12
Total dette financière
21 893
45
(70)
21 868
18 716
Trésorerie et équivalents de trésorerie
(6 350)
—
—
(6 350)
(7 657)
(30)
—
—
(30)
(37)
15 513
45
(70)
15 488
11 022
(en millions d’euros)
Instruments dérivés de taux et de change dédiés à la gestion de la trésorerie et des équivalents de trésorerie Dette financière nette (a)
30 juin 2026
Au 31 décembre 2025
(a) La dette financière nette n’inclut pas le montant de la dette locative qui s'élève à 1 904 millions d'euros au 30 juin 2026, contre 1 739 millions d'euros au 31 décembre 2025.
Le détail de l’endettement financier net par nature en valeur de remboursement est le suivant : Au 30 juin 2026 courant
Total
non courant
courant
Total
14 702
3 599
18 301
14 306
3 165
17 471
Autres emprunts bancaires
49
3 291
3 340
54
936
990
Autres emprunts
—
1
1
—
1
1
Banques créditrices
—
136
136
—
242
242
Instruments dérivés de taux et de change dédiés à la gestion de la dette financière
—
90
90
—
12
12
(en millions d’euros)
non courant
Au 31 décembre 2025
Emprunts obligataires (a)
Total dette financière
(b)
14 751
7 117
21 868
14 360
4 356
18 716
Trésorerie et équivalents de trésorerie
—
(6 350)
(6 350)
—
(7 657)
(7 657)
Instruments dérivés de taux et de change dédiés à la gestion de la trésorerie et des équivalents de trésorerie
—
(30)
(30)
—
(37)
(37)
14 751
737
15 488
14 360
(3 338)
11 022
Dette financière nette
(a) Ces montants incluent 3 milliards de dollar US qualifiés de couverture d’investissement net aux États-Unis. (b) Au 30 juin 2026, les Autres emprunts bancaires courants incluent 3 217 millions d'euros relatifs au programme de Commercial Paper aux États-Unis.
Principales opérations de financement et de désendettement du semestre Le Groupe a réalisé une émission obligataire, en mai 2026, pour un montant total de 2,3 milliards d’euros en trois tranches : • 1 milliard d’euros d’obligations à taux fixe à échéance mai 2029 avec un coupon annuel, portant intérêt au taux annuel de 3,000 %; • 650 millions d’euros d’obligations à taux fixe à échéance mai 2033 avec un coupon annuel, portant intérêt au taux annuel de 3,375 %; • 650 millions d’euros d’obligations à taux fixe à échéance mai 2037 avec un coupon annuel, portant intérêt au taux annuel de 3,750 %. Au cours du premier semestre 2026, un emprunt obligataire a été remboursé, d’un montant de 1,5 milliard d’euros, émis en mars 2018 à taux fixe et échu le 21 mars 2026.
22
SANOFI
RAPPORT FINANCIER SEMESTRIEL 2026
Rapport financier semestriel 2026 Comptes semestriels consolidés condensés
Par ailleurs, dans le cadre de ses opérations courantes, Sanofi dispose au 30 juin 2026 de deux facilités de crédit syndiquées, intégrant des critères environnementaux et sociaux, afin d’assurer sa liquidité : • d’une ligne de crédit syndiquée de 4 milliards d’euros, mobilisable en euros et en dollars US, ayant une maturité au 6 mars 2030, et ne disposant plus d’option d’extension; • d’une nouvelle ligne de crédit syndiquée de 3,85 milliards d’euros, également mobilisable en euros et en dollars US, ayant une maturité au 23 avril 2031, et qui intègre deux options d’extension d’une année chacune. Cette nouvelle facilité, effective depuis le 23 avril 2026, remplace une facilité existante de 4 milliards d’euros qui a été annulée le même jour et qui devait arriver à maturité le 6 décembre 2027 Au 30 juin 2026, aucune de ces lignes n’est mobilisée. Sanofi dispose également de deux programmes de dette court terme : • un programme de 6 milliards d’euros de « Negotiable European Commercial Paper » en France; • un programme de 10 milliards de dollars US de « Commercial Paper » aux États-Unis. Au cours du premier semestre 2026 : • l'encours moyen du programme de « Commercial Paper » aux États-Unis a été de 3,0 milliards de dollars US; • l’encours moyen du programme de « Negotiable European Commercial Paper » en France a été de 0,1 milliard d’euros. Les financements en place au 30 juin 2026 au niveau de la société holding, qui centralise l’essentiel des opérations de financement de Sanofi, ne sont pas subordonnés au respect de ratios financiers et ne comportent ni clause d’indexation des marges ni commission en fonction du rating.
B.9.2. Valeur de marché de la dette financière nette La dette financière, nette de la trésorerie et des équivalents de trésorerie et des dérivés et hors coupon couru est valorisée de la manière suivante : Au 30 juin 2026
Au 31 décembre 2025
Valeur de marché
(en millions d'euros)
14 989
10 424
Valeur de remboursement
15 488
11 022
SANOFI
RAPPORT FINANCIER SEMESTRIEL 2026
23
Rapport financier semestriel 2026 Comptes semestriels consolidés condensés
B.10. Instruments financiers dérivés B.10.1 Instruments dérivés de change dédiés à la gestion de l'exposition opérationnelle Le tableau ci-dessous fournit un état des encours d’instruments de couverture de change opérationnelle en portefeuille au 30 juin 2026. Leur montant notionnel est converti en euros sur la base du cours de clôture. Dont dérivés qualifiés de couverture de flux de trésorerie
Au 30 juin 2026
Dont enregistrée en capitaux Juste valeur propres
Montant notionnel
Juste valeur
Montant notionnel
6 536
(66)
221
(8)
dont USD
2 968
(38)
—
dont SGD
555
—
(en millions d’euros) Contrats forward vendeurs
Dont dérivés non qualifiés comptablement de couverture
Montant notionnel
Juste valeur
(8)
6 315
(58)
—
—
2 968
(38)
—
—
—
555
— (6)
dont CNY
530
(6)
—
—
—
530
dont BRL (a)
422
(9)
221
(8)
(8)
201
(1)
dont SAR
224
(3)
—
—
—
224
(3)
Contrats forward acheteurs
5 039
33
—
—
—
5 039
33
dont USD
3 200
24
—
—
—
3 200
24
dont SGD
596
2
—
—
—
596
2
dont CNY
306
2
—
—
—
306
2
dont TRY
120
6
—
—
—
120
6
dont AED Total
120
1
—
—
—
120
1
11 575
(33)
221
(8)
(8)
11 354
(25)
(a) Dont contrats forward vendeurs d’un montant notionnel de 1 300 millions de réaux brésiliens de maturité sur 2027 qualifiés de couvertures de flux de trésorerie sur la cession de Medley au Brésil. Ces positions couvrent principalement les flux significatifs en devises étrangères intervenant après la date de clôture des comptes semestriels, liés à des transactions effectuées pendant le premier semestre 2026 et comptabilisées au bilan de Sanofi au 30 juin 2026. Les profits et pertes sur les instruments de couverture (termes fermes) sont calculés et reconnus parallèlement à la reconnaissance des profits et pertes sur les éléments couverts. Du fait de cet adossement, l’écart de change commercial à constater sur le second semestre 2026 sur ces éléments (couvertures et éléments couverts) sera non significatif.
B.10.2. Instruments dérivés de change et de taux dédiés à la gestion de l'exposition financière La centralisation des excédents et besoins de financement des filiales étrangères hors zone euro et certaines opérations de financement de Sanofi exposent certaines entités à un risque de change financier (risque lié à la variation de valeur de créances ou de dettes financières libellées en devises autres que la devise fonctionnelle de l’entité prêteuse ou emprunteuse). Ce risque de change est couvert par Sanofi au moyen d’instruments dérivés (swaps de change ou contrats à terme) qui modifient la répartition par devise de sa dette financière nette après prise en compte des instruments dérivés. Le tableau ci-dessous fournit un état des instruments de couverture de change financière en portefeuille au 30 juin 2026. Leur montant notionnel est converti en euros sur la base du cours de clôture. 30 juin 2026 (en millions d’euros) Swaps de devises vendeurs dont USD
Montant notionnel 1 523 1 523
Contrats forward vendeurs dont USD
13 361 1 401
dont BRL
204
Échéances maximales
(37) (a)
16 423
dont GBP Contrats forward acheteurs
Juste valeur (37)
2032
(272) (b)
(c)
11 466
(241)
2027
(7)
2026
(9)
2027
170
dont USD
8 657
143
2027
dont SGD
1 299
6
2026
dont HUF
543
19
2026
29 412
(139)
Total
24
SANOFI
RAPPORT FINANCIER SEMESTRIEL 2026
(d)
Rapport financier semestriel 2026 Comptes semestriels consolidés condensés
(a) Dont swaps de devises d’un montant notionnel de 870 millions de dollars payeur à 4,16 %, receveur EUR à 2,50 % et de maturité sur 2029 et d’un montant notionnel de 870 millions de dollars payeur à 4,53 %, receveur EUR à 3,00 % et de maturité sur 2032 qualifiés de couvertures d’investissement net aux États-Unis. Au 30 juin 2026, la juste valeur de ces contrats représente un passif de 37 millions d’euros dont 33 millions d’euros débités en Autres éléments du résultat global et 4 millions d’euros débités en résultat financier. (b) Dont contrats forward vendeurs d’un montant notionnel de 12 275 millions de dollars et de maturité sur 2026 et 2027, qualifiés de couvertures d’investissement net aux États-Unis. Au 30 juin 2026, la juste valeur de ces contrats représente un passif de 223 millions d’euros dont 222 millions d’euros débités en Autres éléments du résultat global, et 1 million d'euros débité en résultat financier. (c) Dont contrats forward vendeurs d’un montant notionnel de 1 200 millions de réaux brésiliens de maturité sur 2027, qualifiés de couvertures d’investissement net au Brésil. Au 30 juin 2026, la juste valeur de ces contrats représente un passif de 9 millions d’euros dont 10 millions d’euros débités en Autres éléments du résultat global, et 1 million d'euros crédité en résultat financier. (d) Dont contrats forward acheteurs d’un montant notionnel de 1 000 millions de dollars et de maturité sur 2026, qualifiés de couverture du risque de variation de juste valeur de 1 000 millions de dollars d’emprunts obligataires, lié à la variation du cours spot EUR/USD. Au 30 juin 2026, la juste valeur de ces contrats représente un passif de 6 millions d’euros dont 6 millions d'euros débités en résultat financier, l'impact en Autres éléments du résultat global au titre du traitement du coût de couverture étant non significatif.
Afin d’optimiser le coût de son endettement ou d’en réduire la volatilité, Sanofi utilise des instruments dérivés (swaps de taux d’intérêt, swaps de taux d’intérêt multidevises) qui modifient la répartition taux fixe/taux variable de sa dette financière nette. Ces instruments s’établissent ainsi au 30 juin 2026 : Dont dérivés qualifiés de couverture de juste valeur
(en millions d’euros)
2026
2027 2028 2029
2030 et audelà
Total
Juste valeur Notionnels
Dont dérivés qualifiés de couverture de flux de trésorerie
Juste valeur
Notionnels
Juste valeur
Dont enregistrés en capitaux propres
Swaps de taux Taux payeur 2,08% / receveur Euribor 3M
—
850
—
—
—
850
(2)
—
—
850
(2)
(2)
Taux payeur 3,77% / receveur SOFR USD capitalisé + 46bps
—
438
—
—
—
438
4
—
—
438
4
4
Taux payeur SOFR USD capitalisé / receveur 1,03%
—
—
438
—
—
438
(25)
438
(25)
—
—
—
Taux payeur SOFR USD / receveur 1,32%
—
—
438
—
438
(22)
438
(22)
Taux payeur 3,82% / receveur SOFR USD capitalisé + 54 bps
—
—
438
—
—
438
7
—
—
Taux payeur Ester capitalisé / receveur 0,92%
—
—
—
650
—
650
(28)
650
Taux payeur Ester capitalisé / receveur 2,53 %
—
—
—
750
—
750
2
Taux payeur Ester capitalisé / receveur 2,71 %
—
—
—
—
475
475
Taux payeur Ester capitalisé / receveur 2,91 %
—
—
—
—
475
Total
—
1 288
1 313 1 400
950
— 438
7
7
(28)
—
—
—
750
2
—
—
—
4
475
4
—
—
—
475
7
475
7
—
—
—
4 951
(52)
3 226
(62)
1 726
10
10
SANOFI
RAPPORT FINANCIER SEMESTRIEL 2026
25
Rapport financier semestriel 2026 Comptes semestriels consolidés condensés
B.11. Passifs liés à des regroupements d'entreprises et à des intérêts non contrôlants La nature des passifs comptabilisés sur les lignes Passifs liés à des regroupements d’entreprises et à des Intérêts non contrôlants est décrite dans la note B.8.4. aux états financiers consolidés au 31 décembre 2025. Les passifs liés à des regroupements d’entreprises et à des Intérêts non contrôlants dans le tableau ci-dessous sont des instruments de niveau 3 selon la classification IFRS 13 et IFRS 7 (voir note A.5.). Les variations des passifs liés à des regroupements d’entreprises et à des Intérêts non contrôlants sur le premier semestre 2026 sont les suivantes :
(en millions d’euros)
Complément de prix Shire résultant de l'acquisition Translate Bio
CVR émis CVR émis dans le dans le cadre cadre de de l’acquisition l’acquisition BluePrint Vigil
Autres
Total (a)
Soldes au 1er janvier 2026
531
48
5
1
585
Paiements
—
—
—
—
—
Ajustements de juste valeur comptabilisés en résultat – (gain) / perte (y compris désactualisation) (b)
38
8
3
—
49
Différences de conversion
16
2
1
(1)
18
Soldes au 30 juin 2026
585
58
9
—
652
Dont •
Part courante
•
Part non courante
— 652
(a) Dont au 1er janvier 2026, partie à plus d’un an de 585 millions d’euros. (b) Montants principalement présentés dans la ligne du compte de résultat « Ajustement de la juste valeur des compléments de prix ».
Au 30 juin 2026 les Passifs liés à des regroupements d’entreprises et à des Intérêts non contrôlants comprennent principalement la dette liée au complément de prix vis-à-vis de Shire Human Genetic Therapies Inc. (Shire) résultant de l’acquisition de Translate Bio en septembre 2021. La juste valeur de la dette vis-à-vis de Shire est déterminée sur la base des conditions contractuelles et des prévisions de développement et de ventes, affectées d’une probabilité de succès et actualisées. Elle est évaluée à 585 millions d’euros au 30 juin 2026 contre 531 millions d’euros au 31 décembre 2025. Si le taux d’actualisation baissait d’un point, la juste valeur de la dette vis-à-vis de Shire augmenterait de 13 % environ.
B.12. Provisions et autres passifs non courants Le solde des Provisions et autres passifs non courants se présente comme suit : (en millions d’euros)
30 juin 2026
31 décembre 2025
Provisions
4 592
Autres passifs non courants (a)
2 256
2 162
Total
6 848
6 703
4 541
(a) Dont au 30 juin 2026, 1 647 millions d'euros portant sur la dette relative aux redevances à payer à Sobi sur les ventes nettes de Beyfortus (nirsevimab) aux États-Unis (voir note C.2. aux états financiers consolidés au 31 décembre 2025). Compte tenu du mode de calcul des redevances dues, une variation à la hausse ou à la baisse des prévisions de ventes entrainerait une variation à proportion de la dette. Les montants en valeur nominale estimés être dus à plus d'un an et à moins de 5 ans s'élèvent à 916 millions d'euros. Les montants en valeur nominale estimés être dus à plus de cinq ans s'élèvent à 2 150 millions d'euros.
26
SANOFI
RAPPORT FINANCIER SEMESTRIEL 2026
Rapport financier semestriel 2026 Comptes semestriels consolidés condensés
Le tableau ci-dessous présente les mouvements intervenus sur les provisions :
(en millions d'euros) Soldes au 1er janvier 2026
Provisions pour retraites & autres avantages
Provisions pour autres avantages long terme
Provisions pour restructuration
Autres provisions
Total
1 440
827
654
1 620
4 541
Variation de périmètre
—
—
—
13
13
Augmentations de provisions et autres passifs
57
(a)
110
180
126
473
Reprises de provisions utilisées
(36)
(a)
(57)
(4)
(40)
(137)
Reprises de provisions non utilisées
(13)
(a)
(2)
(60)
(54)
(129)
Transferts (b)
11
—
(104)
(20)
(113)
Charge d’intérêts nette liée aux avantages du personnel et effets de la désactualisation
26
1
8
14
49
15
18
2
17
52
Écarts actuariels sur régimes à prestations définies
Différences de conversion
(157)
—
—
—
(157)
Soldes au 30 juin 2026
1 343
897
676
1 676
4 592
(a) Concernant les provisions pour retraites et autres avantages postérieurs à l’emploi, la ligne « Augmentations de provisions et autres passifs » correspond aux droits acquis par les employés au cours de la période et aux coûts des services passés ; la ligne « Reprises de provisions utilisées » correspond aux cotisations versées aux fonds de pension et aux bénéficiaires et la ligne « Reprises de provisions non utilisées » correspond aux réductions, liquidations et modifications de régime. (b) Principalement transferts vers la ligne Provisions et autres passifs courants.
Provisions pour retraites et autres avantages sociaux postérieures à l'emploi La sensibilité des engagements de retraites et autres avantages et les hypothèses utilisées au 31 décembre 2025 sont données dans la note D.19.1. aux états financiers consolidés au 31 décembre 2025. Au 30 juin 2026, les principales hypothèses utilisées, notamment les taux d’actualisation et d’inflation, ainsi que la valeur de marché des actifs de couverture, pour la zone euro, les États-Unis et le Royaume-Uni, ont été revues pour tenir compte de leur évolution sur le semestre. Les écarts actuariels relatifs aux retraites et autres avantages sociaux postérieurs à l’emploi comptabilisés en contrepartie des capitaux propres (montants avant impôts) s’analysent de la façon suivante : 30 juin 2026 (6 mois)
(en millions d'euros) Gains/(pertes) actuariels sur actifs de couverture
71
Gains/(pertes) actuariels sur engagements
86
30 juin 2025 (6 mois)
(c)
(45) (a)
152
(b)
(a) Inclut notamment la variation des taux d’actualisation (entre +0,05 % et +0,50 %), et du taux d’inflation de +0,15 % pour le Royaume-Uni au premier semestre 2026. (b) Inclut notamment la variation des taux d’actualisation (entre 0,00 % et +0,30 %), et du taux d’inflation de -0,30 % pour le Royaume-Uni au premier semestre 2025. (c) Inclut les gains/(pertes) actuariels d'Opella pour (4) millions d'euros sur le premier semestre 2025.
B.13. Engagements hors bilan Au 31 décembre 2025, les engagements hors bilan vis-à-vis de sociétés tierces sont présentés dans la note D21.1. aux états financiers consolidés. Les principaux engagements pris au cours de la période sont les suivants : • En mars 2026, Sanofi a conclu un accord de licence exclusive pour développer, fabriquer et commercialiser le rovadicitinib dans le monde entier auprès de CTTQ, une filiale de Sino Biopharmaceutical Limited. Le rovadicitinib est le premier inhibiteur oral à double cible JAK/ROCK de petite molécule de sa catégorie au niveau mondial qui a reçu sa première approbation en Chine en février 2026 en première ligne pour les indications de myélofibrose (MF). Selon les termes de cet accord, CTTQ a reçu un paiement initial de 135 millions de dollars et est en droit de recevoir jusqu'à 1,4 milliard de dollars en paiements d'étape de développement, réglementaires et commerciaux, ainsi que des redevances progressives à deux chiffres sur les ventes réalisées. • En mars 2026, Sanofi a conclu un accord de licence exclusif mondial pour un engageur de cellules T tri-spécifique de nouvelle génération destiné aux maladies auto-immunes avec Kali Therapeutics. Avec cet accord, Sanofi obtiendra les droits mondiaux exclusifs du KT501, un anticorps tri-spécifique novateur utilisant la plateforme propriétaire de découverte et de recherche de Kali Therapeutics. Selon les conditions de l'accord, Kali Therapeutics pourra recevoir jusqu'à 1,2 milliard de dollars, incluant un paiement initial (dont 0,1 milliard de dollars déjà versé), des paiements d'étape liés au développement et aux ventes, ainsi que des redevances échelonnées jusqu'à deux chiffres (d'un chiffre élevé à deux chiffres) sur les ventes de produits. Au 30 juin 2026, Sanofi n'a pas signé de nouvel accord significatif de contrat d'énergie renouvelable à long terme dans le cadre de sa stratégie de durabilité. Les principaux accords existants sont présentés dans la note D.21.1. aux états financiers consolidés du Document d'Enregistrement Universel 2025.
SANOFI
RAPPORT FINANCIER SEMESTRIEL 2026
27
Rapport financier semestriel 2026 Comptes semestriels consolidés condensés
B.14. Litiges et arbitrages Sanofi, ses filiales et les autres sociétés du Groupe sont impliquées dans des contentieux, des arbitrages ou d’autres procédures légales. Ces procédures sont généralement liées à des litiges en responsabilité civile produits, des litiges relatifs aux droits de propriété intellectuelle (notamment les actions intentées contre des fabricants de produits génériques cherchant à limiter la protection conférée par les brevets de Sanofi sur ses produits), des litiges en matière de droit de la concurrence et de pratiques commerciales, en matière commerciale, en matière de droit social, en matière fiscale, des litiges liés au traitement des déchets et à des atteintes à l’environnement et des demandes au titre de garanties de passif relatives à des cessions d’activités. Les contentieux listés ci-dessous sont ceux ayant le plus significativement évolué depuis la publication des états financiers pour l’exercice clos au 31 décembre 2025.
B.14.1. Produits Zantac - litige produit aux États-Unis Dans le cadre de la procédure de litige multi-district (Multi-District Litigation – MDL), où les affaires déposées devant les tribunaux fédéraux ont été coordonnées, la Cour d'appel du onzième circuit (Eleventh Circuit) a tenu les plaidoiries orales relatives à l'appel au quatrième trimestre 2025, et une décision est attendue au cours du second semestre 2026. Dans les affaires en cours dans le Delaware (juridiction d'Etat) où la question est de statuer sur les requêtes Daubert des défendeurs visant à exclure les experts des demandeurs, au cours du deuxième trimestre 2026, la Cour supérieure du Delaware (Delaware Superior Court) a accordé un jugement sommaire (summary judgment) et rejeté toutes les affaires pendantes contre Sanofi. Les demandeurs font appel de cette décision devant la Cour suprême du Delaware (Delaware Supreme Court) et Sanofi n'attend pas de décision relative à l'appel avant le quatrième trimestre 2027. Il n'est pas possible, à ce stade, d'évaluer avec certitude l'issue de ces procédures.
Talc - litige produit aux États-Unis Au 30 juin 2026, Sanofi était assignée comme défendeur dans environ 1430 actions en responsabilité produit. À ce jour, aucune affaire n’a été jugée. Il n’est pas possible, à ce stade, d’évaluer avec certitude l’issue de ces procédures.
Dupixent - litige produit aux États-Unis Environ 30 actions en responsabilité produit ont été introduites devant des tribunaux fédéraux à travers le pays, alléguant que Dupixent (dupilumab) provoque ou aggrave un lymphome à cellules T. En juin 2026, ces affaires ont été regroupées dans une procédure de litige multi-district (Multi-District Litigation – MDL) devant le tribunal fédéral du New Jersey (New Jersey Federal court). Par ailleurs, huit affaires ont été déposées devant les juridictions de l’État du New Jersey (New Jersey State court). Il n’est pas possible, à ce stade, d’évaluer avec certitude l’issue de ces procédures.
B.14.2. Brevets Litige brevet Amgen en lien avec Praluent (alirocumab) en Europe Le 6 mars 2026, Sanofi, Regeneron et Amgen ont conclu un accord transactionnel mettant fin aux contentieux en cours. Les termes de l'accord sont confidentiels. Ces affaires sont désormais terminées.
B.14.3. Autres litiges Litige lié à Plavix (clopidogrel) - Procureur général du Texas Dans l'action intentée par Sanofi et Bristol Myers Squibb (BMS) à l'encontre du Procureur général du Texas (Texas AG) dans le comté de Travis, le 28 avril 2026, le tribunal du comté de Travis (Travis County court) a accordé la requête du Texas AG visant à suspendre la procédure des sociétés à son encontre, et le 4 juin 2026, les sociétés ont déposé une requête en mandamus auprès de la Cour d'appel du Texas (Texas Court of Appeals) visant à faire annuler cette décision.
340-B drug pricing program aux États-Unis En février 2026, l’Administration américaine des ressources médicales et des services médicaux (Health Resources and Services Administration – HRSA) a procédé au retrait de son programme pilote de remise dans le cadre du dispositif 340B. Il est toutefois attendu qu’elle annonce la mise en place d’un nouveau programme pilote de remise 340B au cours de l’année 2026. Procédures ADR aux Etats-Unis Dans les procédures de règlement administratif des différends (Administrative Dispute Resolution – ADR) engagées contre Sanofi au titre du programme 340B — l’une déposée en 2023 par l’University of Washington/Harborview Medical Center et l’autre déposée en 2024 par Hudson Headwaters Health Network (toutes deux alléguant que l’initiative 340B de Sanofi avait entraîné des « surcoûts » au sens de la loi 340B) — le 9 mars 2026, le panel ADR a conclu qu’aucune violation liée à une surfacturation n’avait été commise par Sanofi dans la procédure concernant University of Washington Medical Center et Harborview Medical Center. Puis, le 27 mai 2026, le panel ADR a également conclu qu’aucune violation liée à une surfacturation n’avait été commise par Sanofi dans la procédure relative à Hudson Headwaters Health Network, lequel a demandé le réexamen de la décision du panel ADR.
28
SANOFI
RAPPORT FINANCIER SEMESTRIEL 2026
Rapport financier semestriel 2026 Comptes semestriels consolidés condensés
Mosaic Health aux Etats-Unis Depuis le renvoi de l'affaire par la Cour d’appel devant le tribunal de district (District Court) en août 2025 à la suite de la deuxième plainte modifiée déposée par les demandeurs, les défendeurs (Sanofi et trois autres fabricants) ont déposé une requête en rejet (motion to dismiss) visant certaines demandes fondées sur le droit des États. Les défendeurs ont également saisi la Cour suprême des États-Unis (Supreme Court of the United States) d’une requête en délivrance d’un certiorari (petition for a writ of certiorari), contestant deux aspects de la décision rendue par la Cour d’appel du deuxième circuit (Second Circuit). En juillet 2026, certaines demandes fondées sur le droit des États ainsi que les demandes des plaignants pour enrichissement sans cause (unjust enrichment) ont été rejetées. Le tribunal de district a par ailleurs fixé le calendrier de la procédure, prévoyant la clôture de la phase de collecte des preuves factuelles (fact discovery) en novembre 2027. Adventist Health/West aux Etats-Unis Dans l'appel déposé par Adventist Health System/West à la suite au rejet de son action prononcé par le tribunal en mars 2024 en faveur des fabricants de médicaments dont Sanofi, la Cour d'appel du neuvième circuit (Ninth Circuit Court of Appeals) a infirmé la décision et ordonné le renvoi de l'affaire devant le tribunal de district (District Court) le 17 mars 2026.
B.15. Autres produits et autres charges d'exploitation Au premier semestre 2026, les Autres produits d’exploitation s’élèvent à 800 millions d’euros (contre 533 millions d’euros au premier semestre 2025) et les Autres charges d’exploitation sont de 3 436 millions d’euros (contre 2 476 millions d’euros au premier semestre 2025), comme détaillé dans le tableau ci-dessous : 30 juin 2026 (6 mois)
30 juin 2025 (6 mois)
Gains/(pertes) nets sur cessions d'actifs d'exploitation ou d'activités
241
344
Produits de concession de licences relatifs à Amvuttra
398
120
Divers
161
69
800
533
(3 486)
(2 475)
(en millions d’euros)
Total Autres produits d’exploitation Alliances avec Regeneron (i) Quote-part (du bénéfice)/de la perte (ii) Quote-part supplémentaire couvrant le coût de développement de Regeneron
594
494
(iii) Remboursement des frais de commercialisation à Regeneron
(336)
(346)
Divers Total Autres charges d’exploitation
(208)
(149)
(3 436)
(2 476)
30 juin 2026 (6 mois)
30 juin 2025 (6 mois)
284
201
B.16. Coûts de restructuration et assimilés Les Coûts de restructuration et assimilés s’analysent de la façon suivante : (en millions d’euros) Charges liées au personnel Charges, gains ou pertes sur actifs
(a)
179
109
Coûts de programmes de transformation
10
80
Autres (b)
90
40
Total
563
430
(a) Cette ligne comprend des dépréciations et des dotations aux amortissements accélérés liés aux projets de fermetures ou cessions de sites (y compris ceux en location) ainsi que les gains ou pertes sur cession d’actifs, résultant des décisions de réorganisation des activités du Groupe. (b) Cette ligne comprend les coûts de transaction, d'intégration et de séparation liés aux acquisitions ou cessions importantes pour 73 millions d'euros au premier semestre 2026, qui sont principalement liés à l'acquisition de Dynavax (voir note B.1.).
B.17. Autres gains et pertes, litiges Au premier semestre 2026, la ligne Autres gains et pertes, litiges correspond à une charge de 95 millions d'euros principalement liée à des litiges majeurs ; cette ligne correspondait à une charge de 57 millions d'euros au 30 juin 2025.
SANOFI
RAPPORT FINANCIER SEMESTRIEL 2026
29
Rapport financier semestriel 2026 Comptes semestriels consolidés condensés
B.18. Résultat financier Les principales composantes du résultat financier s’analysent comme suit : (en millions d’euros)
30 juin 2026 (6 mois)
30 juin 2025 (6 mois)
(253)
(219)
Intérêts reçus (b)
118
162
Coût de la dette financière nette
(135)
(57)
Coût de la dette financière (a)
Gains/(pertes) de change (hors activités opérationnelles)
(3)
1
Effet de désactualisation des provisions (c)
(21)
(22)
Charges d’intérêts nettes liées aux avantages du personnel
(27)
(37)
Pertes de valeur sur actifs financiers, nettes des reprises
(1)
—
Charges d’intérêts nettes relatives aux contrats de location
(26)
(22)
Autres (d)
(115)
(40)
Résultat financier
(328)
(177)
dont : Charges financières
(465)
(361)
Produits financiers
137
184
(a) Dont résultat sur instruments dérivés de taux et de change dédiés à la gestion de la dette financière : 12 millions d’euros au 30 juin 2026 contre (25) millions d’euros au 30 juin 2025. (b) Dont résultat sur instruments dérivés de taux et de change dédiés à la gestion de la trésorerie et des équivalents de trésorerie : 6 millions d’euros au 30 juin 2026 contre (4) millions d’euros au 30 juin 2025. (c) Essentiellement sur provisions pour risques environnementaux, provisions pour restructuration et provisions pour risques produits (voir note B.12.). (d) Dont une charge financière d'un montant de 146 millions d’euros au 30 juin 2026 et de 50 millions d'euros au 30 juin 2025 comptabilisée au titre de la réestimation du passif inscrit au bilan reflétant les redevances estimées futures sur les ventes de Beyfortus aux États-Unis.
En 2026 et 2025, l’impact de l’inefficacité des opérations de couverture est non significatif.
B.19. Charges d'impôts Sanofi a opté pour des régimes d’intégration fiscale dans un certain nombre de pays dont principalement la France, l’Allemagne, le Royaume-Uni et les États-Unis. La charge d’impôt s’analyse comme suit : 30 juin 2026 (6 mois)
30 juin 2025 (6 mois)
Impôt courant
(1 089)
(1 202)
Impôt différé
218
491
(en millions d’euros)
Total Résultat avant impôts et sociétés mises en équivalence
(871)
(711)
2 840
3 582
L’écart entre le taux effectif d’imposition sur le résultat avant impôts et sociétés mises en équivalence et le taux de l’impôt sur les sociétés en vigueur en France s’analyse comme suit : 30 juin 2026 (6 mois) (a)
30 juin 2025 (6 mois) (a)
Taux de l’impôt en vigueur en France
25,8 %
25,8 %
Différence entre le taux normal d’imposition français et les taux applicables à Sanofi (b)
(17,9 %)
(7,3 %)
Impact fiscal relatif à amlitelimab (c)
19,3 %
—%
Réestimation des risques fiscaux et résolutions de contentieux
1,8 %
2,3 %
Autres (d)
1,5 %
(1,0 %)
30,6 %
19,8 %
(en pourcentage)
Taux effectif d’imposition sur le résultat
(a) Taux calculé sur la base de l’estimation du taux effectif d’impôt annuel (voir note A.2.). (b) La différence entre le taux d’imposition français et le taux d’imposition des filiales étrangères s’explique par la présence de Sanofi dans de nombreux pays dont la plupart ont des taux d’impôts inférieurs au taux français et par l’impact des régimes fiscaux préférentiels liés aux brevets. La composante 2025 de la contribution exceptionnelle temporaire sur les bénéfices des sociétés, introduite dans le cadre du projet de loi de finance 2026, est incluse dans la charge fiscale mais exclue du calcul du taux d'imposition effectif moyen annuel conformément à la norme IAS 34. (c) Correspond à la non-déductibilité de la dépréciation comptabilisée sur l'actif incorporel amlitelimab (voir note B.4.) et aux impacts liés sur actifs d'impôts différés.. (d) Inclut au 30 juin 2026 une charge d'impôt de 57 millions d'euros au titre de l'estimation de l'impact Pilier 2, basée sur notre compréhension des règles applicables, contre 17 millions d'euros au 30 juin 2025.
30
SANOFI
RAPPORT FINANCIER SEMESTRIEL 2026
Rapport financier semestriel 2026 Comptes semestriels consolidés condensés
B.20. Revenus provenant de contrats avec des clients B.20.1. Ventilation du chiffre d'affaires Le chiffre d’affaires, pour le premier semestre 2026 et premier semestre 2025 est présenté dans le tableau ci-dessous : (en millions d'euros)
Europe
États-Unis
Autres pays
30 juin 2026
Europe
États-Unis
Autres pays
30 juin 2025
Total Groupe
4 304
11 633
6 169
22 106
4 144
9 535
6 210
19 889
1 146
6 922
1 256
9 324
944
5 283
1 085
7 312
Immunologie dont
Dupixent
Maladies rares dont
ALTUVIIIO
—
576
98
674
—
456
86
542
Fabrazyme
138
256
129
523
134
261
130
525
Nexviazyme/Nexviadyme
152
211
63
426
132
195
60
387
Cerezyme
126
86
140
352
119
91
153
363
Ayvakit
44
322
1
367
—
—
—
—
Sarclisa
108
132
114
354
83
119
74
276
Lantus
146
344
323
813
149
395
332
876
Toujeo
259
134
336
729
248
126
318
692
Oncologie dont
Autres médicaments dont
Plavix
40
2
398
440
44
3
426
473
Lovenox
202
5
157
364
247
9
191
447
Rezurock
36
218
42
296
23
220
20
263
181
7
2
190
241
1
9
251
Vaccins polio / pertussis / hib et rappels, incl. Heplisav B
206
487
671
1 364
223
320
818
1 361
Vaccin RSV (Beyfortus)
87
65
240
392
85
68
203
356
Vaccins Méningite, voyageurs et endémiques
118
268
179
565
96
319
194
609
Ventes industrielles Vaccins dont
Vaccins contre la grippe, COVID-19 Dont nouveaux lancements
33
16
72
121
52
54
108
214
546
1 891
610
3 047
423
1 204
473
2 100
B.20.2 Autres revenus (en millions d’euros) Ventes VaxServe de produits non Sanofi Ventes à Opella
(a)
Redevances Autres (b)
30 juin 2026 (6 mois)
30 juin 2025 (6 mois)
746
842
60
61
91
68
271
275
Total Biopharma Autres revenus
1 168
1 246
Ventes / Revenus des produits Opella (c)
270
206
Total Autres revenus
1 438
1 452
(a) Chiffre d'affaires généré par les entités juridiques appartenant au périmètre des activités poursuivies en raison de la fabrication de produits Opella. Jusqu'au 30 avril 2025, les entités Opella sont dans le périmètre des activités abandonnées (voir Note B.1.). À partir du 1er mai 2025, les entités Opella sont traitées en parties liées conformément à la norme IAS24 (voir Note B.5.). (b) Cette ligne comprend principalement les revenus perçus par Sanofi dans le cadre de prestations de services de production au profit de tiers. (c) Activités de Santé Grand Public qui n'ont pas transférées à la date effective de la perte du contrôle sur Opella, celles-ci comprenant notamment (i) les ventes de produits Opella réalisées sur le canal « hôpital » en Chine dont le transfert est prévu au plus tôt en 2028 ; (ii) les ventes réalisées par l’entité dédiée Opella Russie, dont le capital reste détenu par Sanofi. Sanofi poursuit la distribution des produits Opella sur le territoire russe selon les termes de l’accord de distribution conclu dans le cadre de la séparation, les parties se réservant le droit de discuter du transfert de cette entité pendant la durée de l’accord de distribution ; ainsi que (iii) les ventes du produit Gold-Bond poursuivies aux États-Unis par l’intermédiaire de la filiale Gold Bond LLC conservée et détenant les droits de propriété mondiaux associés.
SANOFI
RAPPORT FINANCIER SEMESTRIEL 2026
31
Rapport financier semestriel 2026 Comptes semestriels consolidés condensés
B.21. Information sectorielle L’information sectorielle présentée par Sanofi est constituée d’un unique secteur opérationnel Biopharma. Le secteur opérationnel Biopharma comprend les opérations commerciales, les activités de recherche, de développement et de production relatives aux franchises Médecine de Spécialités, Médecine Générale et à l’activité Vaccins ainsi que les fonctions supports et centrales, pour l’ensemble des territoires géographiques. Il comprend également les revenus liés à la fabrication de produits Santé Grand Public, facturés à Opella Healthcare SAS (Opella), qui constitue une partie liée depuis le 30 avril 2025, date de déconsolidation, correspondant à la clôture de la vente par Sanofi d’une participation majoritaire d’environ 50 % dans Opella à Clayton, Dubilier & Rice (CD&R). Ces revenus qui précédemment étaient des transactions intra-groupe sont maintenant présentés sur la ligne Autres revenus du compte de résultat. Le secteur opérationnel Biopharma inclut également le prix d’achat des produits Biopharma lorsque ceux-ci sont fabriqués par Opella. La section « Autres » comprend les éléments tels que, principalement, les activités Opella non transférées à la date effective de perte de contrôle d’Opella, celles-ci comprenant notamment (i) les ventes de produits Opella réalisées sur le canal « hôpital » en Chine dont le transfert est prévu au plus tôt en 2028 ; (ii) les ventes réalisées par l’entité dédiée Opella Russie, dont le capital reste détenu par Sanofi. Sanofi poursuit la distribution des produits Opella sur le territoire russe selon les termes de l’accord de distribution conclu dans le cadre de la séparation, les parties se réservant le droit de discuter du transfert de cette entité pendant la durée de l’accord de distribution ; ainsi que (iii) les ventes du produit Gold-Bond poursuivies aux États-Unis par l’intermédiaire de la filiale Gold Bond LLC conservée et détenant les droits de propriété mondiaux associés.
B.21.1. Résultats sectoriels Le résultat sectoriel de Sanofi est le « Résultat opérationnel des activités ». Cet indicateur est utilisé en interne par le principal décideur opérationnel pour évaluer la performance du secteur opérationnel et décider de l’allocation des ressources. Le « Résultat opérationnel des activités » correspond au Résultat opérationnel après prise en compte des éléments suivants : • extourne des amortissements et des dépréciations des actifs incorporels (hors logiciels et d’autres droits de nature industrielle ou opérationnelle) ; • extourne des ajustements de la juste valeur des compléments de prix liés aux regroupements d’entreprises (IFRS 3) ou aux cessions d’une activité figurant sur la ligne Ajustement de la juste valeur des compléments de prix ; • extourne de la charge résultant de la réévaluation des stocks à la suite d’un regroupement d’entreprises (IFRS 3) ou d’acquisitions de groupe d’actifs ne constituant pas une activité selon le §2-B de la norme IFRS 3 ; • retraitements des montants figurant sur les lignes Coûts de restructuration et assimilés ; • extourne des autres gains et pertes (y compris plus ou moins-values de cessions majeures) présentée sur la ligne du compte de résultat consolidé Autres gains et pertes, litiges ; • extourne des autres coûts ou provisions sur litiges (présentés sur la ligne Autres gains et pertes, litiges) ; • ajout de la quote-part du résultat net des sociétés mises en équivalence pour les coentreprises et entreprises associées dans la mesure où celle-ci se rapporte (i) aux coentreprises ou (ii) aux entreprises associées avec lesquelles Sanofi a conclu des accords de R&D et/ou dont les opérations sont gérées comme faisant partie intégrante des activités commerciales de Sanofi; • déduction de la part attribuable aux Intérêts non contrôlants, part relative aux activités poursuivies et excluant la part relative aux éléments mentionnés ci-dessus.
32
SANOFI
RAPPORT FINANCIER SEMESTRIEL 2026
Rapport financier semestriel 2026 Comptes semestriels consolidés condensés
Les résultats sectoriels sont présentés dans le tableau ci-dessous : 30 juin 2026 (6 mois) Biopharma 30 juin 2026
(en millions d’euros)
Autres
Evolution à Evolution à changes données constants 30 juin publiées au au 30 juin 2026 30 juin 2025 (non 2025 (IFRS) IFRS)
Total
Evolution à Evolution à changes données constants 30 juin publiées au au 30 juin 2026 30 juin 2025 (non 2025 (IFRS) IFRS)
Evolution à données publiées au 30 juin 2025 (IFRS)
Evolution à changes constants au 30 juin 2025 (non IFRS)
22 106
+11,1%
+15,7%
Chiffre d’affaires
22 106
+11,1%
+15,7%
Autres revenus
1 168
-6,3%
-2,0%
270
+31,1%
+31,1%
1 438
-1,0%
+2,7%
Coût des ventes
(5 812)
+1,0%
+3,8%
(133)
+3,9%
+3,1% (5 945)
+1,1%
+3,8%
Frais de recherche et développement
(3 979)
+7,1%
+9,9%
(1)
—%
—% (3 980)
+7,1%
+9,9%
Frais commerciaux et généraux
(4 690)
+5,5%
+9,4%
(102)
+72,9%
+76,3% (4 792)
+6,3%
+10,3%
Autres produits et charges d’exploitation
(2 630)
Quote-part du résultat net des sociétés mises en équivalence
74
Part attribuable aux intérêts non contrôlants
(7)
+16,7%
+22,3%
Résultat opérationnel des activités
6 230
% du chiffres d'affaires
(6)
(2 636) 74 (7)
+16,5%
+22,2%
28
+75,0%
+68,8% 6 258
28,2 %
28,3 % 30 juin 2025 (6 mois)
(en millions d'euros)
Biopharma
Chiffres d'affaires
19 889
Autres
Total 19 889
Autres revenus
1 246
206
1 452
Coût des ventes
(5 753)
(128)
(5 881)
Frais de recherche et développement
(3 716)
(1)
(3 717)
Frais commerciaux et généraux
(4 447)
(59)
(4 506)
Autres produits et charges d'exploitation
(1 941)
(2)
(1 943)
Quote-part du résultat net des sociétés mises en équivalence
77
—
77
Part attribuable aux Intérêts non contrôlants
(8)
—
(8)
5 347
16
5 363
Résultat opérationnel des activités
Le tableau ci-dessous présente, conformément à IFRS 8, la réconciliation entre le « Résultat opérationnel des activités » et le Résultat avant impôts et sociétés mises en équivalence : (en millions d'euros) Résultat opérationnel des activités Quote-part du résultat net des sociétés mises en équivalence (a) Part attribuable aux Intérêts non contrôlants (b)
30 juin 2026 (6 mois) 6 258
30 juin 2025 (6 mois) 5 363
(74)
(77)
7
8
Amortissement des actifs incorporels
(1 087)
(777)
Dépréciations des actifs incorporels (c)
(1 031)
(210)
Ajustement de la juste valeur des compléments de prix
(37)
(61)
Charge résultant des conséquences des acquisitions sur les stocks (d)
(210)
—
Coûts de restructuration et assimilés (e)
(563)
(430)
Autres gains et pertes, litiges (f)
(95)
(57)
Résultat opérationnel
3 168
3 759
Charges financières
(465)
(361)
Produits financiers
137
184
2 840
3 582
Résultat avant impôts et sociétés mises en équivalence
(a) Coentreprises et entreprises associées avec lesquelles Sanofi a conclu un accord de partenariat stratégique. (b) À l’exclusion des coûts de restructuration et autres éléments ajustés attribuables aux Intérêts non contrôlants. (c) Au premier semestre 2026, le suivi des indicateurs de perte de valeur des autres actifs incorporels a conduit à enregistrer une dépréciation nette d’un montant de 1 031 millions d’euros correspondant principalement à la dépréciation de l'incorporel amlitelimab pour 952 millions d'euros. Au 30 juin 2025, cette ligne inclut une charge nette de dépréciation d’un montant de (210) millions d’euros principalement liée à des projets de recherche et développement. (d) Cette ligne correspond à l’impact de l’écoulement des stocks réévalués à leur juste valeur à la date d’acquisition, qui inclut au 30 juin 2026 les impacts relatifs aux acquisitions de Blueprint Medicines et Dynavax. (e) Voir note B.16. (f) Voir note B.17.
SANOFI
RAPPORT FINANCIER SEMESTRIEL 2026
33
Rapport financier semestriel 2026 Comptes semestriels consolidés condensés
B.21.2. Autres informations sectorielles La valeur comptable de la participation dans les entreprises associées et coentreprises comptabilisées selon la méthode de la mise en équivalence dans la mesure où celle-ci se rapporte (i) aux coentreprises ou (ii) aux entreprises associées avec lesquelles Sanofi a conclu des accords de R&D et/ou dont les opérations sont gérées comme faisant partie intégrante des activités commerciales de Sanofi ; ainsi que les montants des acquisitions des actifs corporels et incorporels sont présentés dans les tableaux ci-dessous. Les sociétés mises en équivalence incluent principalement les participations dans MSP Vaccine Company et Infraserv GmbH & Co. Höchst KG (voir note B.5.). Les acquisitions d’immobilisations incorporelles et corporelles correspondent aux acquisitions d’immobilisations réglées au cours de la période. Biopharma (en millions d’euros)
30 juin 2026
30 juin 2025
Participation dans les sociétés mises en équivalence(a)
204
483
Acquisition d’immobilisations corporelles
882
845
Acquisition d’autres actifs incorporels
414
575
(a) Valeur des participations à la date d’arrêté des comptes.
B.21.3. Information par zone géographique L’information par zone géographique présentée dans les tableaux ci-dessous est établie sur la base de l’implantation géographique des clients pour le chiffre d’affaires. Chiffre d’affaires (en millions d’euros)
30 juin 2026
30 juin 2025
4 304
4 144
Europe Dont France
725
835
États-Unis
11 633
9 535
Reste du Monde
6 169
6 210
Dont Chine
1 325
1 388
22 106
19 889
Total
Les actifs non courants présentés sont, conformément à la norme IFRS 8, les actifs non courants autres que les instruments financiers, les actifs d’impôts différés et les excédents versés sur engagements de retraite et excluant les droits d'utilisation reconnus suite à l'application d' IFRS 16. 30 juin 2026 (en millions d’euros) Europe
Immobilisations corporelles 5 998
31 décembre 2025
Autres actifs Immobilisations incorporels corporelles 3 951
5 760
Autres actifs incorporels 5 094
Dont France
3 161
—
3 123
—
États-Unis
2 270
21 972
2 229
20 694
Reste du Monde
2 096
436
2 063
473
167
—
122
—
10 364
26 359
10 052
26 261
Dont Chine Total
Conformément à la note D.5. aux états financiers consolidés annuels 2025 il n’y a pas d’allocation de l’écart d’acquisition par zone géographique.
B.21.4. Informations relatives aux clients importants Les ventes réalisées avec les clients les plus importants, en particulier certains grossistes aux États-Unis, représentent 42 % du chiffre d’affaires de Sanofi sur le premier semestre 2026. Les trois clients les plus significatifs représentent respectivement environ 22 %, 14 % et 6 % du chiffre d’affaires de Sanofi au premier semestre 2026 (contre respectivement environ 18 %, 12 % et 5 % au premier semestre 2025).
34
SANOFI
RAPPORT FINANCIER SEMESTRIEL 2026
Rapport financier semestriel 2026 Comptes semestriels consolidés condensés
B.22. Informations liées à Opella présentée en activité abandonnée Le 30 avril 2025, la transaction Opella a été finalisée engendrant la perte de contrôle d'Opella et la décomptabilisation de tous les actifs et passifs des filiales Opella. Le tableau ci-dessous détaille les principaux éléments présentés sur la ligne Résultat net des activités abandonnées : 30 juin 2026
30 juin 2025
Chiffre d'affaires et autres revenus (a)
(en millions d'euros)
—
1 736
Résultat opérationnel (a)
—
266
Plus-value de cession Opella avant impôts
18
2 781 3 039
Résultat avant impôts et sociétés mises en équivalence, incluant la plus-value de cession Opella avant impôts
22
Charges d'impôts (b)
4
(158)
Résultat net de l'activité Opella abandonnée
26
2 881
(a) Pour le premier semestre 2025, ces lignes reflètent le chiffre d'affaires et le résultat opérationnel d'Opella jusqu'à la date de perte de contrôle. (b) En 2025, cette ligne inclut 88 millions d'euros de charge d'impôts relative à la plus-value sur la perte de contrôle d'Opella.
SANOFI
RAPPORT FINANCIER SEMESTRIEL 2026
35
Rapport financier semestriel 2026 Rapport semestriel d'activité
- Rapport semestriel d'activité A/ Évènements marquants du premier semestre 2026 A.1. Panorama du semestre Au cours du premier semestre 2026, Sanofi a poursuivi la mise en œuvre de sa stratégie de croissance et d'innovation, axée sur le lancement d'innovations majeures, la réaffectation des ressources et le développement d'une R&D innovante de premier plan. Les évènements notables de mise en œuvre de la stratégie au cours de la période sont indiqués ci-dessous (pour de plus amples informations concernant les évolutions en matière de Recherche et Développement, se référer à la section A.2. Recherche et développement ci-après). Le 29 janvier 2026, Sanofi a annoncé son intention d’exécuter un programme de rachat d'actions en 2026 d'un montant de 1 milliard d’euros et le 2 février 2026, elle a conclu un mandat avec un prestataire de services d’investissement pour ce programme. Selon les termes de ce mandat, Sanofi devait racheter ses propres actions pour un montant maximum de 1 milliard d’euros. Le programme s'est achevé fin avril 2026. Le 10 février 2026, Sanofi a annoncé avoir finalisé l’acquisition de Dynavax Technologies Corporation (Dynavax). L’acquisition comprend le vaccin contre l’hépatite B pour adultes de Dynavax, HEPLISAV-B, actuellement commercialisé aux États-Unis et qui se distingue par son schéma vaccinal à deux doses administrées sur un mois. Elle comprend également le vaccin candidat contre le zona de Dynavax (Z-1018), actuellement en phase 1/2 d’essais cliniques, ainsi que d’autres projets de vaccins en développement. Le 24 avril 2026, Sanofi a annoncé avoir placé avec succès une émission obligataire pour un montant de 2,3 milliards d’euros. Les obligations ont été émises dans le cadre du programme Euro Medium Term Note. Sanofi affectera le produit net de l’émission de ces obligations aux besoins généraux de l’entreprise. Le chiffre d’affaires au premier semestre 2026 s’établit à 22 106 millions d’euros, en hausse de 11,1 % par rapport au premier semestre 2025. À taux de change constants (tcc) (1) le chiffre d’affaires est en hausse de 15,7 %, reflétant principalement les bonnes performances de Dupixent, d'Ayvakit, ainsi que d'ALTUVIIIO. Le Résultat net consolidé – Part attribuable aux actionnaires de Sanofi s’établit à 1 957 millions d’euros au premier semestre 2026, contre 5 812 millions d'euros au premier semestre 2025. Le résultat net par action s’inscrit à 1,63 euros, contre 4,74 euros au premier semestre 2025. Le résultat net des activités(2) s’établit à 4 765 millions d’euros, en hausse de 14,8 % par rapport au premier semestre 2025, et le bénéfice net par action des activités (BNPA des activités(2)) à 3,97 euros, en hausse de 17,1 % par rapport au premier semestre 2025.
A.2. Recherche et développement La recherche et le développement (R&D) de Sanofi visent à développer et à mettre à disposition des médicaments et des vaccins qui changent la vie de patients pour de nombreuses maladies parmi les plus complexes au monde. Les progrès réalisés en R&D au cours du premier semestre 2026 sont décrits en détail ci-dessous, et une mise à jour du portefeuille de R&D est présentée à la Section G/ du présent rapport de gestion semestriel.
Immunologie Dupixent (dupilumab) Après évaluation dans le cadre d'un examen prioritaire, la Food and Drug Administration (FDA) a approuvé Dupixent pour le traitement des patients adultes et pédiatriques âgés de 6 ans et plus atteints de rhinosinusite fongique allergique (RSFA) ayant des antécédents de chirurgie sino-nasale. Cette approbation élargit la couverture des maladies sino-nasales par Dupixent, qui inclut désormais la RSFA, en plus de la rhinosinusite chronique avec polypes nasaux (RSC avec PN). La FDA et la Commission européenne (CE) ont approuvé Dupixent pour le traitement des enfants âgés de deux à 11 ans atteints d'urticaire chronique spontanée (UCS) qui restent symptomatiques malgré un traitement par antihistaminique H1 (AH1). Ces approbations élargissent les précédentes autorisations de Dupixent chez les adultes et adolescents âgés de 12 ans et plus atteints d'UCS. Le Ministère de la Santé, du Travail et du Bien-être (MHLW) du Japon a accordé l'autorisation de commercialisation et de fabrication de Dupixent pour le traitement des adultes atteints de pemphigoïde bulleuse (PB) modérée à sévère. Lors de la publication des résultats du premier trimestre 2025, Sanofi a annoncé l'acceptation de la demande d'autorisation de mise sur le marché par l'Agence européenne des médicaments (EMA) pour Dupixent dans le traitement de la BP. Suite aux commentaires de l'EMA lors de l'examen en cours de Dupixent dans cette indication, Sanofi a décidé de retirer la demande d'autorisation.
(1) (2)
Indicateur alternatif de performance, voir définition à la section « D.3. Chiffre d’affaires ». Indicateur alternatif de performance, voir définition à la section « D.2. Résultat net des activités ».
36
SANOFI
RAPPORT FINANCIER SEMESTRIEL 2026
Rapport financier semestriel 2026 Rapport semestriel d'activité
Les deux études de phase 3 du programme clinique LIBERTY-LSC, STYLE 1 et STYLE 2 (identifiants des études cliniques: NCT06687967 et NCT06687980, respectivement), évaluant Dupixent dans le lichen simplex chronicus (LSC) n'ont pas atteint leurs critères d'évaluation principaux de réduction du prurit par rapport au placebo. Les données de sécurité de ces études étaient globalement cohérentes avec le profil de sécurité connu de Dupixent. En raison de ce résultat, Sanofi et Regeneron procéderont à une analyse approfondie de ces données et prévoient de les présenter lors d'un prochain congrès médical.
Rezurock (belumosudil) La CE a accordé une autorisation de mise sur le marché conditionnelle pour Rezurock dans le traitement de la maladie chronique du greffon contre l'hôte (GVHDc) chez les adultes et les enfants âgés de 12 ans et plus pesant au moins 40 kg. Le médicament doit être utilisé lorsque les autres options thérapeutiques offrent un bénéfice clinique limité, ne sont pas adaptées ou ont été épuisées. Cette autorisation de mise sur le marché conditionnelle fait suite à l'avis favorable du Comité des médicaments à usage humain (CHMP) de l'EMA en janvier, et est subordonnée à l'achèvement d'une étude confirmatoire, randomisée et contrôlée.
Tzield/Teizeild (teplizumab) En avril, la FDA a approuvé la demande complémentaire de licence de produit biologique (sBLA) pour Tzield, élargissant l'indication aux patients âgés d'au moins un an, contre minimum huit ans auparavant, pour retarder l'apparition du diabète de type 1 (DT1) de stade 3 chez les patients diagnostiqués à un stade 2. En juin, la FDA a approuvé Tzield pour retarder le déclin de la production endogène d'insuline chez les enfants âgés de huit à 17 ans récemment diagnostiqués à un stade 3 du DT1. Les deux approbations ont été accordées dans le cadre d'une procédure d'examen prioritaire. Dans l'UE, le teplizumab a été approuvé (sous le nom de Teizeild) pour retarder l'apparition du DT1 de stade 3 chez les adultes et les patients pédiatriques âgés de huit ans et plus diagnostiqués à un stade 2.
amlitelimab (anticorps monoclonal anti-OX40L) Le 24 juillet, dans le cadre d’une évaluation stratégique en cours du portefeuille de développement, il a été décidé de ne pas soumettre amlitelimab à des évaluations réglementaires mondiales. Sanofi a déterminé que l’ensemble des données d’efficacité et de sécurité générées à ce jour ne sont pas favorables à un développement plus poussé de l’amlitelimab dans la DA. Si l’étude d’extension à long terme de phase 3 ESTUARY (identifiant de l’étude clinique: NCT06407934) a montré un maintien à long terme de la réponse clinique sans rechute chez les patients âgés de 12 ans et plus atteints de DA modérée à sévère, et un profil de sécurité émergent qui s’appuie sur des données antérieures (notamment les études de phase 3 COAST 1, SHORE et COAST 2; identifiants des études cliniques: NCT06130566, NCT06224348 et NCT06181435, respectivement), l’amlitelimab ne représenterait pas une amélioration significative du traitement standard pour les patients atteints de DA.
itepekimab (anticorps monoclonal anti-IL33) Après une évaluation complète des résultats des deux études de phase 3 dans la bronchopneumopathie chronique obstructive (BPCO), AERIFY 1 et AERIFY 2 (identifiants des études cliniques: NCT04701983 et NCT04751487, respectivement), dont les résultats sont parus en mai 2025, et en tenant compte du paysage concurrentiel, Sanofi et son partenaire Regeneron ont décidé de ne pas poursuivre le développement de l'itepekimab dans la BPCO. En conséquence, le programme de développement sera arrêté, y compris toutes les études dans la rhinosinusite chronique.
duvakitug (anticorps monoclonal anti-TL1A) Les résultats positifs de l'étude d'extension à long terme (LTE) RELIEVE UCCD du duvakitug (identifiant de l'étude clinique: NCT05668013) ont montré une efficacité clinique et endoscopique durable maintenue sur 44 semaines chez les patients atteints de rectocolite hémorragique (RCH) et de maladie de Crohn (MC) ayant initialement répondu à la phase d'induction. RELIEVE UCCD LTE est une étude randomisée en double aveugle évaluant l'efficacité, la sécurité et la tolérabilité à long terme du duvakitug dans la RCH et la MC. Les données d'efficacité issues de l'étude LTE et de la précédente étude d'induction de phase 2b RELIEVE UCCD (identifiant de l'étude clinique: NCT05499130) renforcent le potentiel thérapeutique du duvakitug dans la RCH et la MC, actuellement évalué dans des études cliniques de phase 3.
lunsekimig (Nanobody® VHH anti-IL13xTSLP) Les études de phase 2 évaluant le lunsekimig dans deux maladies respiratoires chroniques, l'asthme modéré à sévère (étude de phase 2b AIRCULES; identifiant de l'étude clinique: NCT06102005) et la RSC avec PN (étude de preuve de concept de phase 2a DUET; identifiant de l'étude clinique: NCT06454240), ont atteint leurs critères d'évaluation principaux et secondaires clés par rapport au placebo. L'étude exploratoire de phase 2b VELVET (identifiant de l'étude clinique: NCT06790121) n'a pas atteint son critère d'évaluation principal dans la dermatite atopique modérée à sévère. Dans toutes les études, le lunsekimig a été bien toléré.
frexalimab (anticorps monoclonal anti-CD40L) L'étude de phase 2/3 FREXERA (identifiant de l'étude clinique: NCT07412470) évaluant le frexalimab dans la transplantation rénale a débuté, avec l'administration au premier patient en mars 2026. L'étude teste si le frexalimab, administré par voie souscutanée (après une dose intraveineuse initiale) en association avec le traitement de référence, peut réduire le risque de rejet du nouveau rein, contribuer à sa durabilité et améliorer la fonction rénale.
SANOFI
RAPPORT FINANCIER SEMESTRIEL 2026
37
Rapport financier semestriel 2026 Rapport semestriel d'activité
Maladies rares Nexviazyme (avalglucosidase alfa) Nexviazyme a atteint son critère d'évaluation principal — à savoir la proportion de participants vivants et exempts de ventilation invasive — chez les nourrissons traitement-naïfs âgés de zéro à six mois dans l'étude de phase 3 Baby-COMET (identifiant de l'étude clinique: NCT04910776). De plus, l'étude a atteint tous les critères d'évaluation secondaires. Sanofi a l'intention de soumettre les données pour soutenir une demande réglementaire aux États-Unis pour le traitement de la maladie de Pompe d'apparition infantile.
Wayrilz (rilzabrutinib) En juin, le MHLW du Japon a accordé l'autorisation de commercialisation et de fabrication de Wayrilz pour le traitement de la thrombopénie immunitaire (TPI) persistante ou chronique chez les patients ne répondant pas suffisamment à d'autres traitements ou pour lesquels la tolérabilité pose problème. L'approbation repose sur l'étude de phase 3 LUNA 3 (identifiant de l'étude clinique: NCT04562766), dans laquelle Wayrilz a atteint les critères d'évaluation principaux et secondaires, montrant un impact positif sur le maintien du taux de plaquettes et sur d'autres symptômes.
Myqorzo (aficamten) En mai, Cytokinetics, le concédant de licence de Myqorzo en Chine pour Sanofi, a annoncé des résultats positifs préliminaires de l'étude de phase 3 ACACIA-HCM de Myqorzo chez les patients atteints de cardiomyopathie hypertrophique non obstructive symptomatique. Dans l'étude, tous les critères d'évaluation principaux ont été atteints, des améliorations statistiquement significatives des critères d'évaluation secondaires clés ont été obtenues, et aucun nouveau signal de sécurité n'a été identifié. Les résultats devraient former la base d'une demande réglementaire en Chine en 2027.
Redemplo (plozasiran) En Chine, Redemplo a reçu la désignation de thérapie innovante dans l'hypertriglycéridémie sévère. Redemplo sera commercialisé en Grande Chine par Sanofi en vertu d'un accord avec Arrowhead. En 2025, Sanofi a acheté ces droits à Visirna, une filiale majoritaire d'Arrowhead créée pour développer et commercialiser quatre médicaments du portefeuille cardiométabolique d'Arrowhead en Grande Chine. Sanofi prévoit de lancer Redemplo dans un proche avenir pour la réduction des niveaux de triglycérides chez les patients adultes atteints de syndrome de chylomicronémie familiale (SCF), une maladie rare et sévère entraînant un risque substantiellement plus élevé de développer une pancréatite aiguë, récurrente et potentiellement mortelle.
venglustat (inhibiteur oral de la glucosylcéramide synthase) En mai, la FDA a accordé un examen prioritaire à la demande de nouveau médicament (NDA) pour le venglustat dans le traitement de la maladie de Gaucher de type 3 (GD3), un trouble rare du stockage lysosomal. S'il est approuvé, le venglustat deviendrait le premier traitement disponible aux États-Unis pour traiter les manifestations neurologiques progressives associées à la GD3 et élargir le portefeuille de Sanofi d'options thérapeutiques pour les patients atteints de maladies de stockage lysosomal. La date cible de la décision de la FDA est le 25 novembre 2026. Dans la maladie de Fabry, le venglustat n'a pas atteint le critère d'évaluation principal dans les études de phase 3 PERIDOT et CARAT (identifiants des études cliniques: NCT05206773 et NCT05280548, respectivement). Les extensions à long terme des études PERIDOT et CARAT se poursuivent.
efdoralprin alfa (protéine de fusion alpha-1 antitrypsine) Les données de l'étude mondiale de phase 2 ElevAATe (identifiant de l'étude clinique: NCT05856331) ont démontré la supériorité de l'efdoralprin alfa par rapport au traitement de référence dans l'obtention et le maintien de niveaux normalisés d'alpha-1 antitrypsine fonctionnelle chez les patients adultes atteints d'emphysème lié à la déficience en alpha-1 antitrypsine (DAAT). Des résultats supplémentaires de sécurité et d'efficacité à long terme sont en cours d'évaluation dans l'étude de phase 2 ElevAATe OLE (identifiant de l'étude clinique: NCT05897424). L'efdoralprin alfa est une protéine recombinante distincte de la thérapie dérivée du plasma, qui a été le traitement de référence pendant près de 40 ans. Elle a reçu la désignation Fast Track et celle de médicament orphelin aux États-Unis, ainsi que la désignation de médicament orphelin dans l'UE. La première soumission du dossier d'approbation de l'efdoralprin alfa est attendue aux États-Unis au second semestre 2026, sous réserve des commentaires réglementaires finaux .
Neurologie Cenrifki (tolebrutinib) En juin, la CE a approuvé Cenrifki pour le traitement de la sclérose en plaques secondairement progressive (SPSP) sans rechutes au cours des deux dernières années. Cette approbation a suivi l'avis favorable du CHMP de l'EMA et reposait sur l'étude de phase 3 HERCULES (identifiant de l'étude clinique: NCT04411641) dans la SPSP sans rechutes (SPSPsr), avec des données de soutien des études de phase 3 GEMINI 1 et GEMINI 2 (identifiants des études cliniques: NCT04410978 et NCT04410991, respectivement) dans la sclérose en plaques rémittente. L'étude HERCULES a démontré que Cenrifki retardait significativement l'apparition de la progression du handicap dans la SPSPsr.
38
SANOFI
RAPPORT FINANCIER SEMESTRIEL 2026
Rapport financier semestriel 2026 Rapport semestriel d'activité
riliprubart (anticorps monoclonal anti-C1s) En juin, Sanofi a annoncé l'arrêt de l'étude de phase 3 MOBILIZE (identifiant de l'étude clinique: NCT06290128) du riliprubart chez les patients atteints de polyneuropathie inflammatoire démyélinisante chronique (PIDC) réfractaire au traitement de référence. Cette décision a suivi une analyse intermédiaire par un comité de surveillance des données indépendant, qui a déterminé que l'étude MOBILIZE était peu susceptible de fournir une efficacité suffisante. Aucun signal de sécurité lié au riliprubart n'a été identifié dans le cadre de cette analyse intermédiaire. La poursuite des autres études en cours avec le riliprubart, y compris l'étude de phase 3 VITALIZE (identifiant de l'étude clinique: NCT06290141) chez des patients atteints de PIDC traités par IgIV, a été évaluée. L'étude VITALIZE se poursuit comme prévu.
Oncologie Sarclisa (isatuximab) La CE (en juin) et la FDA (en juillet) ont approuvé Sarclisa / Sarclisa Escena (nom aux États-Unis) par voie sous-cutanée (SC) en association avec les régimes de traitement de référence pour le traitement des patients atteints de myélome multiple (MM) pour toutes les indications existantes de la formulation intraveineuse (IV) de Sarclisa. Sarclisa / Sarclisa Escena est la première thérapie anticancéreuse à être administrée via un injecteur sur le corps (OBI) et le premier traitement du MM disponible à la fois par OBI SC et administration manuelle dans l'UE et aux États-Unis, offrant ainsi la flexibilité d'une administration au domicile des patients et en ambulatoire. Sarclisa / Sarclisa Escena peut être utilisé en conjonction avec l'injecteur sur le corps CirCLIQ d'Enable Injections pour être administré par voie sous-cutanée en appuyant sur un bouton, en utilisant une aiguille rétractable, plus courte et plus fine. La formulation SC de Sarclisa en association avec les régimes de traitement de référence approuvés pour le traitement du MM a également été approuvée par le MHLW au Japon. Une demande réglementaire pour l'injecteur sur le corps CirCLIQ d'Enable Injections est en cours d'examen au Japon. Une demande pour Sarclisa SC administré par injection manuelle est actuellement en cours d'examen en Chine.
Vaccins Nuvaxovid (COVID-19) Le vaccin COVID-19 à base de protéines non-ARNm de Sanofi, Nuvaxovid (NVX-CoV2705), a démontré une réactogénicité systémique statistiquement significativement plus faible (les effets secondaires attendus qui pourraient survenir suite à la vaccination) par rapport à mNEXSPIKE (ARNm-1283), le dernier vaccin COVID-19 à ARNm de Moderna, pour tous les critères d'évaluation pré-spécifiés dans l'étude COMPARE (identifiant de l'étude clinique: NCT07051031), qui a enrôlé 1 000 adultes aux États-Unis.
Fluzone HD / Efluelda (grippe) La FDA et l'EMA ont accepté pour examen la demande réglementaire de Fluzone haute dose (HD) / Efluelda pour une utilisation chez les adultes âgés de 50 ans et plus pour prévenir la grippe. La demande réglementaire fait suite aux résultats positifs de l'étude de phase 3 QHD00042 (identifiant de l'étude clinique: NCT06641180) rapportés en octobre 2025.
A.3. Autres évènements marquants A.3.1. Gouvernance L’Assemblée Générale Mixte des actionnaires de Sanofi s’est réunie le 29 avril 2026, au Palais des Congrès - 75017 Paris, sous la présidence de Frédéric Oudéa. Toutes les résolutions soumises au vote ont été adoptées par ses actionnaires. L’Assemblée a notamment approuvé les comptes sociaux et les comptes consolidés de l’exercice 2025. L'assemblée a décidé de distribuer un dividende annuel ordinaire, de 4,12 euros par action.
Le Conseil d'administration Le Conseil d'administration de Sanofi s'est réuni le 11 février 2026 et a décidé de ne pas renouveler le mandat d’administrateur de Paul Hudson. Le 18 février 2026, Paul Hudson a démissionné de son mandat d'administrateur, avec effet immédiat. L’Assemblée Générale Mixte des actionnaires de Sanofi du 29 avril 2026 a approuvé le renouvellement des mandats d'administrateur de Jean-Paul Kress (administrateur indépendant) et Christophe Babule et la nomination de Belén Garijo et Christel Heydemann, en qualité d’administratrice indépendante. Du fait du non-renouvellement du mandat de Patrick Kron à l'issue de l'Assemblée générale du 29 avril 2026, le Conseil d’administration est de nouveau composé de 16 administrateurs, dont huit femmes et deux administrateurs représentant les salariés. Il reste très majoritairement composé d’administrateurs indépendants. Suite au départ de Paul Hudson et de Patrick Kron du Conseil d'administration et sur proposition du Comité des Nominations, de la Gouvernance et de la RSE, le Conseil d'Administration a nommé Frédéric Oudéa en tant que Président du Comité des Nominations, de la Gouvernance et de la RSE. Par ailleurs, le Conseil d'Administration a nommé Belén Garijo en tant que membre
SANOFI
RAPPORT FINANCIER SEMESTRIEL 2026
39
Rapport financier semestriel 2026 Rapport semestriel d'activité
du Comité Stratégique, et Christel Heydemann en tant que membre du Comité des Nominations, de la Gouvernance et de la RSE et du Comité des Rémunérations.
La direction générale Le Conseil d'administration a mis fin aux fonctions de Directeur Général de Paul Hudson avec effet au 17 février 2026 au soir. Olivier Charmeil (Vice-Président Exécutif, Médecine Générale), a assuré les fonctions de Directeur général par intérim du 18 février au 30 avril 2026. Le Conseil d'administration du 29 avril 2026 a confirmé la nomination de Belén Garijo en qualité de Directrice Générale de Sanofi avec effet au 1er mai 2026.
Le Comité exécutif Au cours du premier semestre 2026, le Comité exécutif a vu sa composition évoluer avec: • le départ de Paul Hudson en qualité de Directeur général le 17 février au soir et la nomination de Belén Garijo pour pourvoir à son remplacement avec effet au 1er mai 2026, • la nomination de Manuela Buxo au poste de Vice-Présidente Exécutive, Médecine de Spécialités, à compter du 1er mars 2026. Manuela Buxo a succédé à Brian Foard, qui a décidé de quitter Sanofi le 28 février 2026, ayant accepté un poste de direction à l'extérieur du Groupe, et • le départ de Natalie Bickford du poste de Vice-Présidente Exécutive, Chief People Officer le 31 mai 2026. Depuis le 1er juin 2026, Véronique Jaillet est Vice-Présidente Exécutive, Chief People Officer, ad interim. Par ailleurs, le 21 juillet 2026, Sanofi a annoncé qu'à compter du 1er septembre 2026, la composition du Comité exécutif évoluerait et qu'il serait composé comme suit : • François Roger, Vice-Président Exécutif, Finance • Paulo Fontoura, Vice-Président Exécutif, Responsable de la R&D • Manuela Buxo, Vice-Présidente Exécutive, Responsable Médecine de Spécialités • Thomas Triomphe, Vice-Président Exécutif, Responsable Vaccins • Thomas Grenier, Vice-Président Exécutif, Responsable Médecine Générale • Brendan O’Callaghan, Vice-Président Exécutif, Manufacturing & Supply • Jamie Haney, Vice-Président Exécutif, Directrice Juridique • Véronique Jaillet, Vice-Présidente Exécutive, Chief People Officer, ad interim.
A.3.2. Litiges et arbitrages Les contentieux ayant le plus significativement évolué depuis la publication des états financiers pour l’exercice clos au 31 décembre 2025 sont présentés en note B.14. aux comptes semestriels consolidés condensés.
Enquêtes gouvernementales et litiges associés Dans l'action anticoncurrentielle liée à l'insuline intentée au nom des acheteurs directs devant le tribunal fédéral du Massachusetts (Massachusetts Federal Court), le procès devrait débuter en janvier 2027. Dans la plainte déposée en 2024 devant le tribunal d'État du Texas, alléguant des violations du Texas Medicaid Fraud Prevention Act (TMFPA), l'État du Texas a déposé, le 13 février 2026, une requête en intervention (Petition in Intervention) fondée sur une théorie de responsabilité reposant sur de fausses certifications (false certification theory of liability). Sanofi a demandé la récusation de l'un des cabinets d'avocats du dénonciateur (relator) et une audience sur cette demande est attendue en août 2026. La phase de discovery doit s'achever le 15 janvier 2027 ; le procès est programmé pour le 19 juillet 2027. Ces deux dates sont toutefois susceptibles d'être reportées dans l'attente d'une décision du tribunal sur la demande de récusation.
A.3.3. Autres Le 4 juin 2026, Sanofi a annoncé le plan d'Action 2026, son plan mondial d’actionnariat salarié ouvert à environ 75 000 salariés dans 52 pays. Ce plan, qui entre dans sa douzième année d’existence, témoigne de la volonté renouvelée de Sanofi et de son Conseil d’administration d’associer les salariés à la croissance et aux résultats de l’entreprise. Les actions ont été proposées au prix de souscription de 59,87 euros, soit une décote de 20 % par rapport à la moyenne des vingt cours d’ouverture de l’action Sanofi du 6 mai au 2 juin 2026. Par ailleurs, pour cinq actions souscrites, les salariés ont eu la possibilité de recevoir une action gratuite (dans la limite de quatre actions gratuites par employé). Chaque salarié éligible a pu souscrire jusqu’à 1 500 actions Sanofi, dans la limite légale d’un montant maximum de souscription n’excédant pas 25 % de leur rémunération brute annuelle, déduction faite des versements volontaires déjà effectués au titre des dispositifs d’épargne salariale (Plan d'épargne entreprise, et/ou Plan d’épargne Groupe, et/ou Plan d’épargne pour la retraite collectif - les versements volontaires dans le PERCOL ne sont pas à déduire) au cours de l’année 2026.
40
SANOFI
RAPPORT FINANCIER SEMESTRIEL 2026
Rapport financier semestriel 2026 Rapport semestriel d'activité
B/ Avancées dans la mise en œuvre de la stratégie de durabilité L'avis positif obtenu pour l'acoziborole marque une avancée majeure vers l'élimination de la maladie du sommeil Le CHMP a rendu un avis favorable sur l'acoziborole en tant que traitement oral à dose unique administré sous forme de trois comprimés, ce qui constitue une avancée significative vers la réalisation de l'objectif de l'OMS visant à éliminer la maladie du sommeil d'ici 2030. Grâce à l'engagement de Sanofi, aux côtés de partenaires de longue date que sont DNDi (Drugs for Neglected Diseases Initiative), l'OMS et d'autres acteurs mondiaux de la santé, le nombre de cas de maladie du sommeil a pu être réduit de 98 % depuis 2001. Sanofi fera don d'acoziborole à l'OMS par l'intermédiaire de sa branche philanthropique, la Sanofi Foundation, afin que les patients puissent bénéficier gratuitement du traitement.
Une étude soutenue par Sanofi quantifie les facteurs environnementaux et socio-économiques qui aggravent les maladies respiratoires La stratégie de développement durable de Sanofi s’appuie sur son ambition de s'attaquer au lien entre défis environnementaux, santé et soins de santé. Une étude – soutenue par Sanofi et menée en partenariat avec Regeneron – a analysé les données de santé recueillies en France, entre 2018 et 2022, auprès de plus de 710 000 patients atteints d’asthme et de BPCO(1), en croisant ces données avec des indicateurs environnementaux et socio-économiques, afin d’identifier les facteurs de risque et les leviers de protection associés à l’exacerbation des maladies respiratoires. Les résultats de l'étude montrent que le cadre de vie et les conditions de vie influencent directement la sévérité des maladies respiratoires. Vivre dans de grandes villes augmente directement (de 40 %) le risque de crise sévère chez les personnes asthmatiques, de 53 % chez les enfants asthmatiques et de 8 % chez les personnes atteintes de BPCO. À l'inverse, certains environnements naturels - forêts, espaces végétalisés ou étendues d'eau, réduisent le risque de 5 % et 20 % respectivement. L'étude confirme le rôle central de la pollution atmosphérique dans l'aggravation des maladies respiratoires. D'autres facteurs, tels que le tabagisme et les températures extrêmes, de plus en plus fréquentes dans le contexte du changement climatique, augmentent également le risque d'exacerbation. De plus, les inégalités socio-économiques aggravent les risques environnementaux, les patients vivant dans des zones de grande pauvreté étant exposés à un risque d'exacerbation jusqu'à 36 % plus élevé.
Progrès de la GHU en matière d’accès aux soins et de renforcement des systèmes de santé La Global Health Unit (GHU) de Sanofi vise à offrir un accès à un large portefeuille de médicaments dans les pays ayant les besoins médicaux non satisfaits les plus élevés. À cette fin, la GHU propose Impact : une marque à but non lucratif qui propose des traitements de référence jugés essentiels par l’OMS et produits par Sanofi. Le portefeuille de médicaments Impact, désormais disponible dans 30 pays(2), marque une étape importante dans l'expansion de l'accès à des médicaments de qualité dans les régions défavorisées à l'échelle mondiale. Cette étape illustre les progrès opérationnels de la GHU et contribue à la trajectoire vers la réalisation de l’objectif de traitement de deux millions de patients atteints de soins pour maladies non transmissibles d’ici 2030. La GHU renforce également les systèmes de santé dans 40 pays défavorisés grâce à des partenariats stratégiques, atteignant 6,6 millions de bénéficiaires – dont 6,5 millions ont été dépistés pour les MNT, 1,1 million diagnostiqués, et près de 500 000 sont reliés à diverses options de soins (traitement médical, surveillance, services d’appui, etc.). Parallèlement, plus de 40 000 professionnels de santé et agents de santé communautaires ont été formés, et plus de 1 000 pharmacies, distributeurs et cliniques ont été soutenus pour améliorer l’efficacité de la chaîne d’approvisionnement.
Le programme AccesS Diabetes s’étend à l’Afrique du Sud et à l’Inde Le programme AccesS Diabetes de Sanofi vise à lever les éventuels obstacles au traitement du diabète, par diverses initiatives de soutien aux patients, des actions visant à renforcer les capacités et les compétences, ainsi que par la fourniture d’insuline analogue de haute qualité, grâce à des partenariats avec diverses autorités publiques et parties prenantes afin de répondre aux besoins spécifiques de chaque pays. Sanofi a signé deux nouveaux accords, en Afrique du Sud et en Inde (État du Madhya Pradesh), marquant ainsi une expansion significative de ses initiatives d’accès aux traitements antidiabétiques dans des régions caractérisées par d'importants besoins médicaux non satisfaits. Au Madhya Pradesh, le programme vise également à renforcer les dispositifs pour le diagnostic et le traitement des maladies rares. Le programme AccesS pour le diabète est désormais déployé au Ghana, au Nigeria (États de Delta et Kano), en Afrique du Sud et en Inde (État du Madhya Pradesh).
La République démocratique du Congo approuve l’acoziborole, premier traitement à dose unique contre la maladie du sommeil S’appuyant sur l’avis favorable rendu par l’EMA au premier trimestre 2026, la République démocratique du Congo a approuvé l’acoziborole, un traitement oral révolutionnaire à dose unique. À la suite d’études cliniques concluantes menées en RDC et en Guinée, cet enregistrement marque une avancée importante dans la lutte contre la trypanosomiase humaine africaine à Gambiense.
Tableau de bord « Développement durable » à T2 2026 Veuillez vous référer au communiqué de presse des résultats de T2 2026 - Annexes tableau de bord «Développement durable» . (1) (2)
Étude réalisée à partir des données du Système national de données de santé, et plus particulièrement des données hospitalières. par le biais d’autorisations d’enregistrement ou de licences d’importation SANOFI
RAPPORT FINANCIER SEMESTRIEL 2026
41
Rapport financier semestriel 2026 Rapport semestriel d'activité
C/ Évènements postérieurs au 30 juin 2026 Les principaux événements liés à recherche et développement survenus entre la date de clôture et la date d'examen des comptes consolidés condensés par le Conseil d'administration sont décrits dans la section « A.2. Recherche et développement », aucun autre événement significatif n'est survenu sur cette période.
42
SANOFI
RAPPORT FINANCIER SEMESTRIEL 2026
Rapport financier semestriel 2026 Rapport semestriel d'activité
D/ Comptes consolidés du premier semestre 2026 Dans ce rapport, sauf indication contraire, toutes les données financières sont présentées selon le référentiel comptable international (IFRS) qui intègre les normes comptables internationales et leurs interprétations (voir la note A.1. aux comptes semestriels consolidés condensés).
Comptes de résultat consolidés des premiers semestres 2025 et 2026 30 juin 2026 (6 mois)
en % des ventes
30 juin 2025 (6 mois)
en % des ventes
Chiffre d'affaires
22 106
100,0 %
19 889
100,0 %
Autres revenus
1 438
6,5 %
1 452
7,3 % -29,6 %
(en millions d’euros)
Coûts des ventes
(6 155)
-27,8 %
(5 881)
Marge brute
17 389
78,7 %
15 460
77,7 %
Frais de recherche et développement
(3 980)
-18,0 %
(3 717)
-18,7 %
-21,7 %
(4 506)
-22,7 %
Frais commerciaux et généraux
(4 792)
Autres produits d'exploitation
800
533
Autres charges d'exploitation
(3 436)
(2 476)
Amortissements des incorporels
(1 087)
(777)
Dépréciations des incorporels
(1 031)
(210)
Ajustement de la juste valeur des compléments de prix
(37)
(61)
Coûts de restructuration et assimilés
(563)
(430)
Autres gains et pertes, litiges
(95)
(57)
Résultat opérationnel
3 168
Charges financières
(465)
Produits financiers Résultat avant impôts et sociétés mises en équivalence Charges d'impôts Quote-part du résultat net des sociétés mises en équivalence
14,3 %
3 759
18,9 %
(361)
137
184
2 840
12,8 %
(871)
3 582
18,0 %
(711)
2
85
Résultat net des activités poursuivies
1 971
8,9 %
2 956
Résultat net des activités abandonnées
26
0,1 %
2 881
14,5 %
Résultat net de l'ensemble consolidé
1 997
9,0 %
5 837
29,3 %
Part attribuable aux Intérêts non contrôlants
40
Résultat net consolidé Part attribuable aux Actionnaires de Sanofi
1 957
25 8,9 %
5 812
Nombre moyen d'actions en circulation (en millions)
1 200,4
1 225,5
Nombre moyen d'actions après dilution (en millions)
1 205,5
1 230,7 2,40
•
Résultat de base par action des activités poursuivies (en euros)
1,61
•
Résultat de base par action des activités abandonnées (en euros)
0,02
2,34
Résultat de base par action (en euros)
1,63
4,74
•
Résultat dilué par action des activités poursuivies (en euros)
1,60
2,39
•
Résultat dilué par action des activités abandonnées (en euros)
0,02
2,33
1,62
4,72
Résultat dilué par action (en euros)
14,9 %
SANOFI
29,2 %
RAPPORT FINANCIER SEMESTRIEL 2026
43
Rapport financier semestriel 2026 Rapport semestriel d'activité
D.1. Informations sectorielles D.1.1. Secteurs opérationnels En application de la norme IFRS 8, Secteurs opérationnels, l’information sectorielle présentée est établie sur la base des données de gestion interne communiquées à la Directrice Générale, principal décideur opérationnel de Sanofi. Le secteur opérationnel est suivi individuellement en terme de reporting interne, selon des indicateurs communs. L’information sur le secteur opérationnel, en application de la norme IFRS 8, est également présentée dans la note B.21. aux comptes semestriels consolidés condensés. L’information sectorielle présentée par Sanofi est constituée d’un unique secteur opérationnel Biopharma. Le secteur opérationnel Biopharma comprend les opérations commerciales, les activités de recherche, de développement et de production relatives aux franchises Médecine de Spécialités, Médecine Générale et à l’activité Vaccins ainsi que les fonctions supports et centrales, pour l’ensemble des territoires géographiques. Il comprend également les revenus liés à la fabrication de produits Santé Grand Public, facturés à Opella Healthcare SAS (Opella), qui constitue une partie liée depuis le 30 avril 2025, date de déconsolidation, correspondant à la clôture de la vente par Sanofi d’une participation majoritaire d’environ 50 % dans Opella à Clayton, Dubilier & Rice (CD&R). Ces revenus qui précédemment étaient des transactions intra-groupe sont maintenant présentés sur la ligne Autres revenus du compte de résultat. Le secteur opérationnel Biopharma inclut également le prix d’achat des produits Biopharma lorsque ceux-ci sont fabriqués par Opella. La section « Autres » comprend les éléments tels que, principalement, les activités Opella non transférées à la date effective de perte de contrôle d’Opella, celles-ci comprenant notamment (i) les ventes de produits Opella réalisées sur le canal « hôpital » en Chine dont le transfert est prévu au plus tôt en 2028 ; (ii) les ventes réalisées par l’entité dédiée Opella Russie, dont le capital reste détenu par Sanofi. Sanofi poursuit la distribution des produits Opella sur le territoire russe selon les termes de l’accord de distribution conclu dans le cadre de la séparation, les parties se réservant le droit de discuter du transfert de cette entité pendant la durée de l’accord de distribution ; ainsi que (iii) les ventes du produit Gold-Bond poursuivies aux États-Unis par l’intermédiaire de la filiale Gold Bond LLC conservée et détenant les droits de propriété mondiaux associés.
D.1.2. Résultat opérationnel des activités Le résultat sectoriel de Sanofi est le « Résultat opérationnel des activités ». Cet indicateur est utilisé en interne par le principal décideur opérationnel pour évaluer la performance du secteur opérationnel et décider de l’allocation des ressources. La définition de cet indicateur, est présenté à la note B.21.1. aux comptes semestriels consolidés condensés. Le « Résultat opérationnel des activités » est un indicateur non-IFRS de la performance financière de l’entreprise, il se réconcilie avec l’indicateur IFRS Résultat opérationnel. Au premier semestre 2026, le Résultat opérationnel s'est inscrit à 3 168 millions d'euros, contre 3 759 millions d'euros au premier semestre 2025, et le « Résultat opérationnel des activités » s’est établi à 6 258 millions d'euros, contre 5 363 millions d'euros au premier semestre 2025. Le rapprochement entre ces deux indicateurs est présenté dans le tableau ci-dessous. Étant donné que le « Résultat opérationnel des activités » est un indicateur alternatif de performance, il peut ne pas être directement comparable aux indicateurs alternatifs de performance utilisés par d'autres sociétés. Malgré l’utilisation de cet indicateur par la Direction pour établir des objectifs et mesurer la performance, il convient de rappeler qu’il s’agit d’un agrégat n’ayant pas de signification standard prescrite par les normes IFRS. Cet indicateur est présenté uniquement pour permettre aux investisseurs de bien comprendre comment la Direction de Sanofi évalue la performance sous-jacente de l’entreprise. Il ne se substitue en aucun cas aux indicateurs IFRS, pas plus qu’il ne devrait l’être, et devrait être examiné conjointement avec les indicateurs IFRS de la performance et de la situation financière de l’entreprise. En conséquence, l’utilité de cet indicateur pour les investisseurs comporte un certain nombre de limites. (en millions d’euros) Résultat opérationnel
30 juin 2026 (6 mois) 3 168
30 juin 2025 (6 mois) 3 759
Autres gains et pertes, litiges (a)
(95)
(57)
Coûts de restructuration et assimilés (b)
(563)
(430)
Charges résultant des conséquences des acquisitions sur les stocks (c)
(210)
0
Ajustement de la juste valeur des compléments de prix
(37)
(61)
Dépréciations des actifs incorporels (d)
(1 031)
(210)
Amortissement des actifs incorporels
(1 087)
(777)
Part attribuable aux Intérêts non contrôlants (e)
7 (74) 6 258
8 (77) 5 363
Quote-part du résultat net des sociétés mises en équivalence (f) Résultat opérationnel des activités
(a) Voir note B.17. Autres gains et pertes, litiges aux états financiers consolidés . (b) Voir note B.16. Coûts de restructuration et assimilés aux états financiers consolidés . (c) Cette ligne correspond à l’impact de l’écoulement des stocks réévalués à leur juste valeur à la date d’acquisition, qui inclut au 30 juin 2026 les impacts relatifs aux acquisitions de Blueprint Medicines et Dynavax. (d) Au premier semestre 2026, le suivi des indicateurs de perte de valeur des autres actifs incorporels a conduit à enregistrer une dépréciation nette d’un montant de 1 031 millions d’euros correspondant principalement à la dépréciation de l'incorporel amlitelimab pour 952 millions d'euros. Au 30 juin 2025, cette ligne inclut une charge nette de dépréciation d’un montant de (210) millions d’euros principalement liée à des projets de recherche et développement. (e) À l’exclusion des coûts de restructuration et autres éléments ajustés attribuables aux Intérêts non contrôlants. (f) Principalement des coentreprises.
44
SANOFI
RAPPORT FINANCIER SEMESTRIEL 2026
Rapport financier semestriel 2026 Rapport semestriel d'activité
D.2. Résultat net des activités (non-IFRS) Sanofi présente l’indicateur financier « Résultat net des activités (non-IFRS) » qui n’est pas défini par les normes comptables et n’est pas inclus dans les états financiers primaires. L'indicateur non-IFRS le plus directement comparable au « Résultat net des activités (non-IFRS) » est le Résultat net consolidé – Part attribuable aux Actionnaires de Sanofi qui a atteint 1 957 millions d’euros au premier semestre 2026, contre 5 812 millions d’euros au premier semestre 2025 (soit une baisse de 66,3 %. Le « Résultat net des activités » s'est élevé à 4 765 millions d’euros au premier semestre 2026, en hausse de 14,8 % par rapport à 4 152 millions d’euros au premier semestre 2025. Le « Résultat net des activités (non-IFRS) » représente 21,6 % du chiffre d’affaires au premier semestre 2026, contre 20,9 % du chiffre d’affaires au premier semestre 2025. Sanofi présente également un « Bénéfice net par action des activités » (BNPA des activités). Ce dernier est un indicateur alternatif de performance que Sanofi définit comme le « Résultat net des activités » divisé par la moyenne pondérée du nombre d’actions en circulation. Le BNPA des activités s’établit à 3,97 euros au premier semestre 2026, contre 3,39 euros au premier semestre 2025, en hausse de 17,1 %, sur la base d’un nombre moyen d’actions en circulation de 1 200,4 millions au premier semestre 2026, contre 1 225,5 millions au premier semestre 2025. Le « Résultat net des activités » correspond au Résultat net consolidé – Part attribuable aux actionnaires de Sanofi (conforme au référentiel IFRS) avant : • résultat net des activités abandonnées, dont Opella ; • amortissements et dépréciations des actifs incorporels (hors logiciels et autres droits de nature industrielle ou opérationnelle) ; • ajustements de la juste valeur des compléments de prix liés aux regroupements d’entreprises (IFRS 3) ou aux cessions d’opérations répondant à la définition d’une activité ; • charges résultant de la réévaluation des stocks à la suite de regroupements d’entreprises (IFRS 3) ou d’acquisitions de groupe d’actifs ne constituant pas une activité comme évoqué dans le §2-B de la norme IFRS 3 ; • coûts de restructuration et assimilés (présentés sur la ligne du compte de résultat consolidé Coûts de restructuration et assimilés) ; • autres gains et pertes (y compris plus ou moins-values de cessions majeures) présentés sur la ligne du compte de résultat consolidé Autres gains et pertes, litiges ; • autres coûts ou provisions sur litiges (présentés sur la ligne du compte de résultat consolidé Autres gains et pertes, litiges) ; • (produits)/charges financiers relatifs aux passifs financiers évalués au coût amorti pouvant donner lieu à réestimations périodiques selon le §B.5.4.6 de la norme IFRS 9 (Instruments financiers) ; • quote-part des profits/pertes des investissements comptabilisés selon la méthode de la mise en équivalence, à l’exception de la quote-part des profits/pertes des investissements comptabilisés selon la méthode de la mise en équivalence, dans la mesure où celle-ci se rapporte (i) aux coentreprises ou (ii) aux entreprises associées avec lesquelles Sanofi a conclu des accords de R&D et/ou dont les activités sont gérées comme partie intégrante des activités de Sanofi ; et • la part attribuable aux Intérêts non contrôlants sur les éléments ci-dessus.
SANOFI
RAPPORT FINANCIER SEMESTRIEL 2026
45
Rapport financier semestriel 2026 Rapport semestriel d'activité
Le tableau ci-dessous présente la réconciliation entre le Résultat net consolidé – Part attribuable aux Actionnaires de Sanofi et le « Résultat net des activités » : (en millions d'euros) Résultat net consolidé – Part attribuable aux Actionnaires de Sanofi (IFRS)
Au 30 juin 2026 Au 30 juin 2025 (6 mois) (6 mois) 1 957
5 812
(26)
(2 881)
Amortissement des incorporels
1 087
777
Dépréciation des incorporels (b)
1 031
210
Ajustement de la juste valeur des compléments de prix
70
68
Charges résultant des conséquences des acquisitions sur les stocks
210
—
Coûts de restructuration et assimilés
563
430
Autres gains et pertes, et litiges (c)
95
57
(Produits)/Charges financiers relatifs aux passifs financiers évalués au coût amorti assujettis à réestimations périodiques (d)
146
50
Résultat net issu de l'activité Opella abandonnée (a)
Effet d’impôts sur les éléments ci-dessus :
(423)
(384)
•
liés aux amortissements et dépréciations des incorporels
(198)
(173)
•
liés aux ajustements de la juste valeur des compléments de prix
(6)
(14)
•
liés aux charges résultant des conséquences des acquisitions sur les stocks
(47)
—
•
liés aux coûts de restructuration et assimilés
(89)
(113)
•
autres éléments
(83)
(84)
Autres effets d'impôts
(17)
11
Autres éléments (e)
72
2
Résultat net des activités (non-IFRS)
4 765
4 152
Nombre moyen d’actions en circulation (en millions)
1 200,4
1 225,5
Résultat de base par action (IFRS) (en euros)
1,63
4,74
Éléments de réconciliation par action (en euros) (f)
2,34
(1,35)
Bénéfice net par action (BNPA) des activités (non-IFRS) (en euros)
3,97
3,39
(a) En 2026, cette ligne concerne principalement l'impact de la finalisation des états financiers d'Opella au 30 avril 2025. En 2025, cette ligne comprend 2 693 millions d’euros liés au gain net résultant de la cession d’Opella à la date de perte de contrôle (voir note B.1. dans les états financiers consolidés de l'exercice 2025 tels que présentés dans le rapport semestriel 2025). (b) Au premier semestre 2026, le suivi des indicateurs de perte de valeur des autres actifs incorporels a conduit à enregistrer une dépréciation nette d’un montant de 1 031 millions d’euros correspondant principalement à la dépréciation de l'incorporel amlitelimab pour 952 millions d'euros. Au 30 juin 2025, cette ligne inclut une charge nette de dépréciation d’un montant de (210) millions d’euros principalement liée à des projets de recherche et développement. (c) Au premier semestre 2026, cette ligne correspond à une charge de 95 millions d'euros principalement liée à des litiges majeurs. Au premier semestre 2025, elle incluait une charge de 57 millions d’euros. (d) Cette ligne correspond à la charge financière relative à la réévaluation du passif inscrit au bilan, qui reflète les redevances estimées futures sur les ventes de Beyfortus aux États-Unis. (e) Les autres éléments comprennent la quote-part de Sanofi dans les pertes de ses filiales EUROAPI et OPAL JV Co (Opella). (f) Correspond au rapprochement entre le résultat de base par action (IFRS) et le bénéfice net par action (BNPA) des activités (non IFRS) : total des éléments de réconciliation divisé par la moyenne pondérée du nombre d’actions en circulation.
Les principaux éléments de réconciliation entre le « Résultat net des activités » et le Résultat net consolidé – Part attribuable aux actionnaires de Sanofi sont liés i) aux effets comptables des acquisitions de groupes d’actifs et des regroupements d’entreprises, en particulier à l’amortissement et à la dépréciation des actifs incorporels (hors logiciels et autres droits de nature industrielle ou opérationnelle), ii) aux impacts liés aux restructurations ou à des transactions considérées comme non-récurrentes et portant sur des montants particulièrement significatifs, iii) aux ajustements de valeurs comptabilisés en résultat de créances à la juste valeur sur des cessions d’activités et de passifs à la juste valeur nés de regroupements d’entreprises (IFRS 3) ou au coût amorti assujettis à des réestimations périodiques selon IFRS 9 et iv) au résultat net des activités abandonnées, dont Opella. Sanofi estime que l’exclusion de ces impacts permet aux investisseurs de mieux comprendre la performance économique sous-jacente, considérant que l’exclusion de ces éléments permet de mieux refléter la performance opérationnelle courante de l’entreprise. Ainsi, Sanofi considère que l’élimination des charges liées aux effets comptables des acquisitions et des regroupements d’entreprises (en particulier l’amortissement et la dépréciation de certains actifs incorporels) facilite la comparaison de sa performance opérationnelle avec celle de ses pairs du secteur pharmaceutique. Ces actifs incorporels (essentiellement des droits relatifs à la recherche et développement, à des plateformes technologiques et à la commercialisation des produits) sont comptabilisés selon les normes IAS 38, Actifs incorporels, et IFRS 3, Regroupements d’entreprises. Sanofi considère que l’élimination des autres effets liés aux acquisitions (tels que les coûts incrémentaux des ventes résultant de l’écoulement des stocks acquis et évalués à leur juste valeur à la suite d’acquisitions par regroupement d’entreprises), améliore également la lecture de la performance opérationnelle courante. L’élimination des coûts de restructuration et assimilés améliore la comparabilité avec les pairs, car ces coûts sont engagés dans le cadre de processus de réorganisation et de transformation de la Société, d’intégration ou de séparation dans le cadre d’opérations importantes.
46
SANOFI
RAPPORT FINANCIER SEMESTRIEL 2026
Rapport financier semestriel 2026 Rapport semestriel d'activité
Sanofi considère que l’élimination des effets liés à des transactions considérées comme non-récurrentes et portant sur des montants particulièrement significatifs (les gains et pertes majeurs sur cessions, ainsi que les coûts et provisions relatifs à des litiges importants et tout autre élément non récurrent majeur) facilite la comparaison d’une période à l’autre. Enfin, les ajustements de valeurs de la période comptabilisés en résultat sur des actifs ou des passifs évalués à la juste valeur, inscrits au bilan dans le cadre d’opérations d’acquisition ou cession d’activités, ou sur des passifs évalués au coût amorti réestimés de manière périodique, généralement déterminés sur la base de révisions de projections de ventes, ne reflètent pas la performance opérationnelle de la Société. En complément des éléments mentionnés ci-dessus, le « Résultat net des activités » exclut le résultat d’Opella, classé distinctement dans la ligne résultat net des activités abandonnées du compte de résultat depuis octobre 2024. Selon la norme IFRS 5 (Actifs non courants détenus en vue de la vente et activités abandonnées), une activité abandonnée est définie comme une composante de la Société qui a été cédée ou qui a été classée comme détenue en vue de la vente et qui représente une ligne d’activité principale et distincte. Depuis cette date, le résultat net des activités relevant des activités poursuivies est utilisé par la Direction pour évaluer la performance financière de Sanofi de manière habituelle. Sanofi juge que la communication d’un indicateur de performance reflétant la vision de la Direction est utile pour les investisseurs et les analystes. Sanofi rappelle toutefois aux investisseurs que le « Résultat net des activités » ne devrait pas être examiné séparément, ni à la place du Résultat net consolidé – Part attribuable aux actionnaires de Sanofi conforme aux normes IFRS. De plus, l’entreprise encourage vivement les investisseurs et les investisseurs potentiels à ne pas se fier à une seule mesure financière, mais à examiner attentivement et dans leur intégralité les états financiers consolidés du présent rapport (y compris les notes annexes). Compte tenu des limites significatives mentionnées ci-dessus, le « Résultat net des activités » ne doit être utilisé qu’en complément des informations financières présentées selon les normes IFRS. Sanofi veille à ce que ses rapports contiennent suffisamment d’informations pour permettre aux lecteurs de comprendre pleinement tous les ajustements apportés au « Résultat net des activités ». Le « Résultat net des activités » et le « BNPA des activités » étant des indicateurs alternatifs de performance, ils ne peuvent être directement comparés aux mesures financières des autres sociétés qui utilisent le même indicateur alternatif de performance ou un indicateur semblable.
SANOFI
RAPPORT FINANCIER SEMESTRIEL 2026
47
Rapport financier semestriel 2026 Rapport semestriel d'activité
D.3. Chiffre d'affaires Au premier semestre 2026, le chiffre d’affaires consolidé de Sanofi s’établit à 22 106 millions d’euros, en hausse de 11,1 % à taux de change publié, par rapport au premier semestre 2025. Les variations de taux de change ont eu un effet négatif de 4,6 points de pourcentage, principalement du fait de l'effet négatif du taux du dollar américain. À taux de change constants (tcc, voir définition ci-dessous), le chiffre d’affaires est en hausse de 15,7 %, reflétant principalement les bonnes performances de Dupixent, d'Ayvakit, ainsi que d'ALTUVIIIO. Les opérations de cession et d’harmonisation du portefeuille ont eu sur la croissance des ventes un impact négatif de 0,4 point de pourcentage.
Tableau de passage du chiffre d’affaires (IFRS) au chiffre d’affaires à changes constants (non-IFRS) (en millions d’euros) Chiffre d’affaires
Au 30 juin 2026 (6 mois)
Au 30 juin 2025 (6 mois)
Évolution
22 106
19 889
+11,1 %
19 889
+15,7 %
Impact des variations de taux de change
(905)
Chiffre d’affaires à changes constants
23 011
La référence aux variations du chiffre d’affaires à changes constants ou, à taux de change constants (tcc), signifie que l’impact des variations de taux de change a été exclu. L’impact des taux de change est éliminé en recalculant les ventes de l’exercice considéré sur la base des taux de change utilisés pour l’exercice précédent à l'exception des pays soumis à un traitement d'hyperinflation, selon la norme IAS 29 (à savoir l’Argentine et la Turquie, voir la note A.4 aux comptes semestriels consolidés condensés).
D.3.1. Chiffre d’affaires par segment opérationnel Le chiffre d’affaires de Sanofi est constitué du chiffre d’affaires de l’activité Biopharma.
(en millions d'euros)
Au 30 juin 2026 (6 mois)
Au 30 juin 2025 (6 mois)
Évolution à données publiées
Évolution à changes constants
Activité Biopharma
22 106
19 889
+11,1 %
+15,7 %
Total chiffre d'affaires
22 106
19 889
+11,1 %
+15,7 %
48
SANOFI
RAPPORT FINANCIER SEMESTRIEL 2026
Rapport financier semestriel 2026 Rapport semestriel d'activité
D.3.2. Chiffre d'affaires par médicament, vaccin et zone géographique Le chiffre d'affaires par principaux produits et par zone géographique est ventilé comme suit : (en millions d'euros)
Total chiffre d'affaires
Var. Publiée
Var. TCC États-Unis
Var. TCC
Europe
Var. TCC
Reste du Monde
Var. TCC
Immunologie Dupixent
9 324
+27,5 %
+34,4 %
6 922
+39,5 %
1 146
+20,9 %
1 256
+20,8 %
Kevzara
301
+22,9 %
+28,6 %
207
+45,7 %
73
+10,8 %
21
-20,7 %
ALTUVIIIO (*)
674
+24,4 %
+32,3 %
576
+34,4 %
—
—%
98
+20,9 %
Fabrazyme
523
-0,4 %
+4,0 %
256
+4,6 %
138
+2,2 %
129
+4,6 %
Nexviazyme/Nexviadyme (*)
426
+10,1 %
+14,5 %
211
+15,4 %
152
+15,2 %
63
+10,0 %
Maladies Rares
Ayvakit (*)
367
—%
—%
322
—%
44
—%
1
—%
Cerezyme
352
-3,0 %
-1,7 %
86
+1,1 %
126
+5,0 %
140
-8,5 %
Alprolix
282
-7,5 %
-1,6 %
215
-4,2 %
—
—%
67
+7,7 %
Myozyme
220
-20,0 %
-18,2 %
77
-9,9 %
62
-36,1 %
81
-6,9 %
Cerdelga
183
+10,2 %
+14,5 %
101
+21,3 %
74
+7,4 %
8
—%
Cablivi (*)
153
+12,5 %
+16,2 %
87
+29,6 %
58
+5,5 %
8
-20,0 % -19,0 %
Aldurazyme
147
-9,8 %
-7,4 %
36
+8,3 %
44
+2,3 %
67
Eloctate
142
+5,2 %
+12,6 %
77
-14,4 %
—
—%
65
+81,6 %
Xenpozyme (*)
127
+15,5 %
+18,2 %
47
+6,4 %
44
—%
36
+89,5 %
Wayrilz (*)
27
—%
—%
27
—%
—
—%
—
—%
Qfitlia (*)
12
+1100,0 %
+1200,0 %
12
+1200,0 %
—
—%
—
—%
Myqorzo (*)
3
—%
—%
—
—%
—
—%
3
—%
Sarclisa (*)
354
+28,3 %
+33,0 %
132
+17,6 %
108
+30,1 %
114
+60,8 %
Jevtana
136
-3,5 %
+4,3 %
94
-6,5 %
1
-50,0 %
41
+45,2 %
-0,9 %
Oncologie
Autres médicaments Lantus
813
-7,2 %
-3,8 %
344
-6,6 %
146
-2,7 %
323
Toujeo
729
+5,3 %
+7,5 %
134
+14,3 %
259
+3,6 %
336
+7,9 %
Plavix
440
-7,0 %
-4,4 %
2
—%
40
-9,1 %
398
-4,0 % -17,8 %
Lovenox
364
-18,6 %
-19,2 %
5
-44,4 %
202
-19,4 %
157
Praluent
317
+18,7 %
+18,4 %
—
—%
265
+25,8 %
52
-8,6 %
Rezurock (*)
296
+12,5 %
+18,3 %
218
+5,5 %
36
+60,9 %
42
+110,0 % +13,7 %
Thymoglobulin
257
+3,6 %
+8,5 %
157
+7,8 %
20
-4,8 %
80
Aprovel
218
+2,8 %
+4,2 %
1
-66,7 %
33
-5,7 %
184
+7,5 %
Soliqua/iGlarLixi
165
+21,3 %
+24,3 %
53
+27,3 %
24
-3,8 %
88
+33,3 % -10,0 %
Multaq
151
-5,6 %
+0,6 %
137
+1,4 %
5
—%
9
Apidra
140
—%
+1,4 %
2
-60,0 %
51
-3,8 %
87
+8,4 %
Synvisc
93
-18,4 %
-16,7 %
59
-7,4 %
9
—%
25
-37,8 %
Tzield (*)
37
+27,6 %
+34,5 %
32
+25,9 %
4
+300,0 %
1
—%
Autres
1 700
-13,2 %
-11,8 %
162
-29,4 %
514
-13,5 %
1 024
-7,3 %
190
-24,3 %
-21,9 %
7
+700,0 %
181
-22,4 %
2
-88,9 %
Vaccins polio / pertussis / hib et rappels, incl. Heplisav B (*)
1 364
+0,2 %
+2,8 %
487
+61,3 %
206
-7,6 %
671
-17,2 %
Vaccins Méningite, voyageurs et endémiques
565
-7,2 %
-3,9 %
268
-11,0 %
118
+22,9 %
179
-5,7 %
Vaccins SRS (Beyfortus) (*)
392
+10,1 %
+13,2 %
65
+2,9 %
87
+2,4 %
240
+21,2 %
Vaccins contre la grippe, COVID-19 (*)
121
-43,5 %
-42,1 %
16
-64,8 %
33
-34,6 %
72
-34,3 %
Biopharma
22 106
+11,1 %
+15,7 %
11 633
+29,9 %
4 304
+3,6 %
6 169
+1,9 %
Dont nouveaux lancements (*)
3 047
45,1 %
51,8 %
1 891
+66,9 %
546
+29,6 %
610
+33,2 %
Ventes industrielles
Vaccins
SANOFI
RAPPORT FINANCIER SEMESTRIEL 2026
49
Rapport financier semestriel 2026 Rapport semestriel d'activité
D.3.3. Activité Biopharma Au premier semestre 2026, le chiffre d’affaires de l’activité Biopharma (voir « Chapitre D.1. Informations sectorielles » pour une information détaillée sur les segments) s’inscrit à 22 106 millions d’euros, en hausse de 11,1 % à données publiées, et de 15,7 % à taux de change constants (tcc), portées par Dupixent et les nouveaux lancements. Les performances des produits majeurs de l’activité Biopharma sont commentées ci-après.
Immunologie Dupixent (dermatite atopique (DA), asthme, rhinosinusite chronique avec polypose nasosinusienne (RCcPN), œsophagite à éosinophiles, prurigo nodulaire (PN), urticaire chronique spontanée (USC), bronchopneumopathie chronique obstructive (BPCO), pemphigoïde bulleuse et rhinosinusite fongique allergique (RFA)) a généré un chiffre d’affaires de 9 324 millions d’euros au premier semestre 2026, soit une progression de 27,5 % à données publiées et de 34,4 % à taux de change constants. Cette croissance a été portée par une forte progression en volume dans toutes les indications homologuées, Dupixent conservant un positionnement leader sur le marché dans toutes ses indications thérapeutiques. Aux États-Unis, les ventes de Dupixent atteignent 6 922 millions d’euros au premier semestre 2026, en hausse de 39,5 % tcc, cette progression s’explique essentiellement par une forte demande, par des optimisations opérationnelles, et à une évolution favorable des estimations après déductions du brut au net. En Europe, le chiffre d’affaires au premier semestre 2026 atteint 1 146 millions d’euros, soit une progression de 20,9 % tcc, reflétant une croissance continue dans toutes les indications homologuées et la poursuite de la croissance sur les principaux marché, dont l’Allemagne. Dans la région Reste du Monde, Dupixent a généré un chiffre d'affaires de 1 256 millions d’euros, en croissance de 20,8 % tcc, essentiellement soutenues par le Brésil et le Canada. Les ventes de Kevzara (polyarthrite rhumatoïde, autres indications rhumatologiques) s’élèvent à 301 millions d’euros, soit une hausse de 28,6 % tcc. L’essentiel des ventes est réalisé aux États-Unis (207 millions d’euros), avec une croissance de 45,7 % tcc expliquée principalement par une utilisation accrue dans le traitement de la polymyalgie rhumatismale, indication approuvée en 2024.
Maladies rares ALTUVIIIO (hémophilie A) a généré des ventes de 674 millions d’euros au premier semestre 2026 dont 85,5 % réalisées aux ÉtatsUnis. Cette performance reflète la transition de patients abandonnant les traitements à facteur de remplacement classiques à demi-vie courte et dans une moindre mesure, d’autres produits sans facteur de remplacement. Les ventes dans la région Reste du Monde s'élèvent à 98 millions d’euros, bénéficiant des lancements effectués au Japon et à Taïwan. Les ventes de la franchise de médicaments à facteur de remplacement pour le traitement de l'hémophilie A (ALTUVIIIO et Eloctate combinés) ont atteint 816 millions d’euros (+28,4 % tcc comparativement au premier semestre 2025), portée surtout par la performance commerciale soutenue d’ALTUVIIIO et par les lancements géographiques. Eloctate a généré 142 millions d’euros de chiffre d'affaires au premier semestre 2026, en hausse de 12,6 % tcc, reflétant la transition des patients vers ALTUVIIIO. Au premier semestre 2026, le chiffre d’affaires du traitement de la maladie de Fabry (Fabrazyme) a atteint 523 millions d’euros, soit une hausse de 4,0 % tcc, en raison notamment de l’augmentation de l’utilisation par les patients et du prix aux États-Unis. Nexviazyme/Nexviadyme (maladie de Pompe) a généré un chiffre d'affaires de 426 millions d'euros, en hausse de 14,5 % tcc, porté par une croissance de 15,2 % tcc en Europe, où la transition des patients depuis Myozyme/Lumizyme se poursuit. Aux États-Unis la croissance atteint 15,4 % tcc, la plupart des patients ayant déjà effectué cette transition. Les ventes de la franchise maladie de Pompe (Nexviazyme/Nexviadyme et Myozyme/Lumizyme) s'établissent à 646 millions d'euros, en hausse de 0,9 % tcc avec Nexviazyme/Nexviadyme représentant désormais 65,9 % du chiffre d'affaires de la franchise. Les ventes d'Ayvakit (mastocytose systémique) s’établissent à 367 millions d'euros. Elles se répartissent notamment entre les États-Unis (322 millions d’euros) et l’Europe (44 millions d’euros), où le nombre de patients traités et la durée de traitement continuent de progresser. L'intégration de Blueprint à Sanofi a entraîné une augmentation des remises accordées aux pouvoirs publics aux États-Unis, impactant négativement les ventes. Sans cette augmentation des remises accordées aux États Unis, la croissance du chiffre d'affaires aurait été d'environ neuf points de pourcentage supérieure. Les redevances sur les ventes réalisées par CStone Pharmaceuticals en Chine sont comptabilisées en Autres revenus. Le chiffre d’affaires de Cerezyme est en baisse de 1,7 % tcc, à 352 millions d’euros, une croissance en Europe (+5,0 % tcc) et aux États-Unis (+1,1 % tcc) compensée par la baisse des ventes dans la région Reste du Monde (-8,5 % tcc). Les ventes de la franchise de la maladie de Gaucher (Cerezyme et Cerdelga, combinés) s’élèvent à 535 millions d’euros. Au premier semestre 2026, les ventes d’Alprolix ont atteint 282 millions d’euros, en recul de 1,6 % tcc, en raison d'un déclin aux États-Unis (-4,2 %), compensé par une hausse des ventes dans la région Reste du Monde qui comprend les ventes de fournitures au partenaire de Sanofi, Sobi. Le chiffre d’affaires de Myozyme/Lumizyme, a baissé de 18,2 % tcc au premier semestre 2026, à 220 millions d’euros, sous l’effet de la transition des patients vers Nexviazyme/Nexviadyme. Les ventes de Cablivi (purpura thrombotique thrombocytopénique acquis) s'élèvent à 153 millions d’euros (+16,2 % tcc) au premier semestre, soutenues par une augmentation du nombre de patients traités aux États-Unis (où les ventes ont augmenté de 29,6 % tcc), et en Europe (+5,5 % tcc). Dans la région Reste du Monde, les ventes s'élèvent à 8 millions d'euros (-20,0 % tcc). Les ventes de Xenpozyme (déficit en sphingomyélinase acide) progressent à 127 millions d’euros au premier semestre, en hausse de 18,2 % tcc, principalement portées par la région Reste du Monde (+89,5 % tcc).
50
SANOFI
RAPPORT FINANCIER SEMESTRIEL 2026
Rapport financier semestriel 2026 Rapport semestriel d'activité
Les ventes de Wayrilz (thrombocytopénie immunitaire) représentent 27 millions d’euros, exclusivement aux États-Unis, suite à l’approbation de mise sur le marché obtenue en août 2025. Les ventes de Qfitlia (hémophilie A et B) se chiffrent à 12 millions d'euros, exclusivement aux États-Unis, l’approbation du traitement ayant eu lieu en mars 2025. Les ventes de Myqorzo (cardiomyopathie hypertrophique obstructive) s'élèvent à 3 millions d'euros, entièrement en Chine, après l’autorisation de mise sur le marché obtenue en janvier 2026. Le rovadicitinib (myélofibrose) a été lancé en Chine au cours du deuxième trimestre, les ventes devant être rapportées à partir des résultats du troisième trimestre 2026.
Principaux autres médicaments Les ventes de Lantus ont atteint 813 millions d’euros, soit un recul de 3,8 % tcc au premier semestre. Aux États-Unis, les ventes de Lantus ont reculé de 6,6 % tcc. En Europe, le recul atteint 2,7 % tcc, et dans la région Reste du Monde, le chiffre d'affaires combiné recule de 0,9 % tcc, principalement en raison de la stratégie de transfert vers Toujeo. Les ventes de Toujeo ont augmenté de 7,5 % tcc, à 729 millions d’euros, portées par les États-Unis (+14,3 %) et l’Europe (+3,6 %). Toujeo continue de bénéficier d'une solide progression en volume et une augmentation de sa part de marché, tant à l’échelle locale qu’à l’échelle internationale. Les ventes de Plavix s'élèvent à 440 millions d’euros, en recul de 4,4 % tcc, reflétant sa décroissance dans la région Reste du Monde, qui représente l’essentiel des ventes (398 millions d’euros, -4,0 % tcc). Les ventes de Lovenox ont atteint 364 millions d’euros, soit une diminution de 19,2 % tcc, en raison de l'impact soutenu des biosimilaires. Les ventes de Sarclisa (myélome multiple) ont atteint 354 millions d'euros (+33,0 % tcc), soutenues par une forte croissance en Europe (+30,1 % tcc), largement alimentée par une utilisation accrue chez les patients nouvellement diagnostiqués, et dans la région Reste du Monde (+60,8 % tcc), en partie grâce à des remboursements et contrats commerciaux favorables. Au premier semestre 2026, les ventes de Praluent ont progressé de 18,4 % tcc, à 317 millions d’euros, reflétant une augmentation des ventes en Europe de 25,8 % tcc, partiellement compensée par une baisse dans la région Reste du Monde de 8,6 % tcc. Rezurock (maladie chronique du greffon contre l’hôte, troisième ligne) a progressé à 296 millions d’euros au premier semestre, en augmentation de 18,3 % tcc. Cette croissance est portée par une forte performance dans la région Reste du Monde (+110,0 % tcc, essentiellement en Chine), tandis que les États-Unis enregistre une croissance de 5,5 % tcc et l'Europe de 60,9 % tcc, la Commission européenne ayant accordé le 31 mars 2026 une autorisation de mise sur le marché conditionnelle pour le traitement de la maladie du greffon contre l’hôte. Thymoglobulin a progressé de 8,5 % tcc, à 257 millions d’euros, en raison d’une augmentation des ventes dans la région Reste du Monde, principalement en Chine. Les ventes d’Aprovel restent plutôt stables à 218 millions d’euros (+4,2 % tcc) ; réalisées principalement dans la région Reste du Monde (184 millions d’euros, +7,5 % tcc). Les ventes de Tzield/Teizeild (diabète de type 1) ont atteint 37 millions d’euros (+34,5 % tcc) (dont 32 millions d’euros réalisées aux États-Unis, en hausse de 25,9 % tcc). Les lancements en Europe (4 millions d’euros) et dans la région Reste du Monde (1 million d’euros) ont débuté. Plus de 1 000 patients ont déjà été traités avec Tzield/Teizeild.
Vaccins Le chiffre d’affaires des Vaccins au premier semestre 2026 a diminué de 3,8 % à données publiées et de -1,1 % tcc, à 2 443 millions d’euros, essentiellement à cause d’une baisse des ventes de vaccins antigrippaux et de vaccins Méningite, voyageurs et endémiques. Les ventes des vaccins Polio/Coqueluche/Hib (PPH) et rappels, y compris Heplisav-B, ont atteint 1 364 millions d’euros, en hausse de 2,8 % tcc. Les ventes aux États-Unis (487 millions d’euros, +61,3 % tcc) ont bénéficié de l’ajout au portefeuille de Heplisav-B, récemment acquis. Dans la région Reste du Monde (671 millions), les ventes ont enregistré un recul de 17,2 % tcc, lié au déclin du nombre de naissances dans certains pays tels que la Chine. Les ventes de vaccins Méningite, Voyageurs et Endémiques ont enregistré un recul de 3,9 % tcc, à 565 millions d’euros, en raison d’une baisse des ventes aux États-Unis (268 millions d’euros, -11,0 % tcc) partiellement compensée par la performance réalisée en Europe (118 millions d’euros, +22,9 % tcc). Les ventes de Beyfortus ont atteint 392 millions d'euros, en hausse de 13,2 % tcc. L'augmentation modérée des ventes aux ÉtatsUnis (+2,9 % tcc) s’explique par un effet de base de comparaison élevée due à une augmentation des stocks au premier semestre 2025, ainsi que par la concurrence. Les ventes en Europe (+2,4 % tcc) et dans la région Reste du Monde (+21,2 % tcc) ont tiré profit de la poursuite du déploiement géographique de la protection infantile, Beyfortus protègeant désormais les nourrissons dans plus de 45 pays. Les ventes de vaccins contre la grippe et COVID-19 ont atteint 121 millions d’euros, en recul de 42,1 % tcc, principalement en raison des éléments non récurrents provenant des immunisations de fin de saison aux États-Unis et en Europe et des ventes plus faibles dans l'hémisphère sud, avec des ventes du Reste du Monde de 72 millions d'euros (-34,3 % en devises constantes).
SANOFI
RAPPORT FINANCIER SEMESTRIEL 2026
51
Rapport financier semestriel 2026 Rapport semestriel d'activité
D.3.4. Chiffre d'affaires par zone géographique Au 30 juin 2026 (6 mois)
Au 30 juin 2025 (6 mois)
Évolution à données publiées
Évolution à changes constants
États-Unis
11 633
9 535
+22,0 %
+29,9 %
Europe
4 304
4 144
+3,9 %
+3,6 %
Reste du Monde
6 169
6 210
-0,7 %
+1,9 %
dont Chine
1 325
1 388
-4,5 %
-3,5 %
22 106
19 889
+11,1 %
+15,7 %
(en millions d'euros)
Total chiffre d’affaires
Au premier semestre 2026, les ventes aux États-Unis ont atteint 11 633 millions d’euros, en hausse de 22,0 % à données publiées et de +29,9 % à changes constants, soutenues par la forte croissance de Dupixent et les nouveaux lancements. Les ventes de Vaccins enregistrent une forte hausse, +16,8 %, portées par une belle croissance des vaccins Polio/Coqueluche/Hib (PPH) et rappels, y compris Heplisav-B, . En Europe, le chiffre d’affaires a augmenté de 3,9 % à données publiées et de 3,6 % à changes constants au premier semestre 2026 pour s'établir à 4 304 millions d’euros, portées par Dupixent et les lancements, partiellement compensé par une baisse des ventes des principaux autres médicaments. Dans la zone Reste du Monde, les ventes au premier semestre ont diminué de 0,7 % à données publiées, et ont augmenté de 1,9 % à taux de change constants, pour s'établir à 6 169 millions d'euros, avec une croissance notamment de Dupixent, Beyfortus et les nouveaux lancements compensant en partie le recul des autres vaccins et des autres médicaments principaux. En Chine, les ventes ont baissé de 4,5 % à données publiées et de 3,5 % à changes constants, à 1 325 millions d’euros. Les ventes ont été soutenues par Dupixent, qui a renoué avec la croissance après un ajustement de prix en 2025, par les trois médicaments lancés en Chine (Rezurock, Sarclisa et Myqorzo). Tout ceci a été plus que compensé par la baisse des ventes de médicaments établis (et notamment Plavix), et par un recul marqué des ventes de vaccins PPH en lien avec la diminution du nombre de naissances en Chine.
D.4. Autres éléments du Compte de résultat D.4.1 Autres revenus Au premier semestre 2026, les Autres revenus ont baissé de 1,0 % pour s’établir à 1 438 millions d’euros (contre 1 452 millions d’euros au premier semestre 2025). La ligne autres revenus inclut notamment les ventes de vaccins non-Sanofi distribués par VaxServe pour 746 millions d’euros (contre 842 millions d'euros en 2025). De plus, les autres revenus comprennent divers services de fabrication (271 millions d’euros), la vente de produits de santé grand public Opella sur certains marchés (270 millions d’euros), des redevances (91 millions d’euros) et des ventes d'approvisionnement à Opella, etc. (60 millions d’euros).
D.4.2. Marge brute Au 30 juin 2026, la Marge brute s’élève à 17 389 millions d’euros, contre 15 460 millions d’euros au 30 juin 2025, soit une hausse de 12,5 %. Cette augmentation comprend une charge d'amortissement de 210 millions d'euros résultant de la réévaluation des stocks liés aux acquisitions de Blueprint et Dynavax et comptabilisée dans le coût des ventes. Elle est partiellement compensée par la reprise de provisions pour stocks antérieures au lancement, d'un montant supérieur à 200 millions d'euros, suite à l'approbation réglementaire de Sarclisa SC. En pourcentage du chiffre d’affaires, la marge brute a augmenté à 78,7 % du chiffre d’affaires au premier semestre 2026, contre 77,7 % au premier semestre 2025. Au premier semestre 2026, la « marge brute des activités » s’est élevé à 17 599 millions d’euros, en hausse de 13,8 % par rapport aux 15 460 millions d’euros enregistrés au premier semestre 2025. La « marge brute des activités » est un indicateur non-IFRS qui exclut totalement de la marge brute calculée selon les normes IFRS l’incidence de la réévaluation à la juste valeur des stocks comptabilisée lors de leur acquisition, qui s’élevait à 210 millions d’euros au premier semestre 2026 et était nulle au premier semestre 2025 (voir D.2. Rapprochement du Résultat net consolidé – Part attribuable aux Actionnaires de Sanofi avec le « Résultat net des activités »).
D.4.3. Frais de recherche et développement Au premier semestre 2026, les Frais de recherche et développement s’élèvent à 3 980 millions d’euros, contre 3 717 millions d’euros au premier semestre 2025, soit une hausse de 7,1 %. Cette augmentation comprend plus de 200 millions d’euros des frais de désengagement liés à des décisions relatives au pipeline. Les dépenses de R&D représentent 18,0 % du chiffre d’affaires contre 18,7 % au premier semestre 2025.
52
SANOFI
RAPPORT FINANCIER SEMESTRIEL 2026
Rapport financier semestriel 2026 Rapport semestriel d'activité
D.4.4. Frais commerciaux et généraux Les Frais commerciaux et généraux s’élèvent à 4 792 millions d’euros au 30 juin 2026 (21,7 % du chiffre d’affaires), contre 4 506 millions d’euros au 30 juin 2025 (22,7 % du chiffre d’affaires). L'augmentation de 6,3 % des frais généraux et administratifs provient de la consolidation des récentes acquisitions : Blueprint (juillet 2025) et Dynavax (février 2026). Le ratio frais commerciaux et généraux sur chiffre d’affaires a baissé de 1,0 point de pourcentage par rapport au premier semestre 2025.
D.4.5. Autres produits et charges d'exploitation Au premier semestre 2026, les Autres produits d’exploitation s’élèvent à 800 millions d’euros (contre 533 millions d’euros au premier semestre 2025) et les Autres charges d’exploitation sont de 3 436 millions d’euros (contre 2 476 millions d’euros au premier semestre 2025). Le solde des Autres produits et charges d’exploitation représente une charge nette de 2 636 millions d’euros au premier semestre 2026 contre une charge nette de 1 943 millions d’euros au premier semestre 2025, comme détaillé dans le tableau ci-dessous : 30 juin 2026 (6 mois)
30 juin 2025 (6 mois)
Gains/(pertes) nets sur cessions d'actifs d'exploitation ou d'activités
241
344
Produits de concession de licences relatifs à Amvuttra
398
120
Divers
161
69
800
533
(3 486)
(2 475)
(en millions d’euros)
Total Autres produits d’exploitation Alliances avec Regeneron (i) Quote-part (du bénéfice)/de la perte (ii) Quote-part supplémentaire couvrant le coût de développement de Regeneron
594
494
(iii) Remboursement des frais de commercialisation à Regeneron
(336)
(346)
Divers Total Autres charges d’exploitation
(208)
(149)
(3 436)
(2 476)
D.4.6. Amortissements des incorporels La charge d’amortissement des immobilisations incorporelles s'élève à 1 087 millions d’euros au 30 juin 2026 contre 777 millions d’euros au 30 juin 2025. Cette augmentation est principalement liée à l'amortissement des immobilisations incorporelles comptabilisées au premier semestre 2026 suite aux acquisitions de Blueprint et Dynavax.
D.4.7. Dépréciations des incorporels Au premier semestre 2026, le suivi des indicateurs de perte de valeur des autres actifs incorporels (hors logiciels) a conduit à enregistrer une dépréciation nette d’un montant de 1 031 millions d’euros principalement liée à la dépréciation d'amlitelimab pour un montant de 952 millions d'euros, soit la totalité de la valeur nette comptable de cet actif incorporel.
D.4.8. Ajustement de la juste valeur des compléments de prix Les ajustements de juste valeur d’actifs et de passifs reconnus lors des acquisitions, conformément à la norme comptable IFRS 3, représentent une charge nette de 37 millions d’euros au premier semestre 2026, contre une charge nette de 61 millions d’euros au premier semestre 2025.
D.4.9. Coûts de restructuration et assimilés Les Coûts de restructuration et assimilés représentent une charge de 563 millions d’euros au premier semestre 2026 (contre une charge de 430 millions d’euros au premier semestre 2025). La charge comptabilisée au premier semestre 2026 comprend principalement 284 millions d'euros de charges liées au personnel (contre une charge de 201 millions d'euros pour le premier semestre 2025) et 179 millions d'euros de charges, gains ou pertes sur actifs (contre une charge de 109 millions d'euros pour le premier semestre 2025).
D.4.10. Autres gains et pertes, litiges Au premier semestre 2026, la ligne Autres gains et pertes, litiges correspond à une charge de 95 millions d'euros principalement liée à des litiges majeurs ; cette ligne correspondait à une charge de 57 millions d'euros au 30 juin 2025.
D.4.11. Résultat opérationnel Le Résultat opérationnel ressort à 3 168 millions d’euros au premier semestre 2026, contre 3 759 millions d’euros au premier semestre 2025. Cette variation s'explique principalement par la hausse d'autres frais d'exploitation.
SANOFI
RAPPORT FINANCIER SEMESTRIEL 2026
53
Rapport financier semestriel 2026 Rapport semestriel d'activité
D.4.12. Charges et produits financiers La charge financière nette s’élève à 328 millions d’euros au 30 juin 2026 contre 177 millions d’euros au 30 juin 2025, soit une hausse de 151 millions d’euros. Le montant au 30 juin 2026 inclut la charge financière d'un montant de 146 millions d’euros (contre 50 millions d'euros au 30 juin 2025) comptabilisée au titre de la réestimation du passif inscrit au bilan reflétant les redevances estimées futures sur les ventes de Beyfortus aux États-Unis. Le coût de la dette financière nette (voir définition à la section « D.7. Bilan consolidé » ci-après) est une charge nette de 135 millions d’euros au premier semestre 2026 contre une charge nette de 57 millions d’euros au premier semestre 2025.
D.4.13. Résultat avant impôts et sociétés mises en équivalence Le Résultat avant impôts et sociétés mises en équivalence s’élève à 2 840 millions d’euros au premier semestre 2026 contre 3 582 millions d’euros au premier semestre 2025.
D.4.14. Charges d'impôts Les Charges d’impôts représentent 871 millions d’euros au 30 juin 2026 contre 711 millions d’euros au 30 juin 2025, soit un taux effectif d’imposition sur le résultat net consolidé de 30,6 %, contre 19,8 % au premier semestre 2025. L'augmentation du taux d'imposition effectif était principalement due à la non-déductibilité des pertes de valeur de l'exercice en cours liées à l'actif incorporel amlitelimab. Le taux effectif d’imposition sur le « Résultat net des activités(1) » est un indicateur alternatif de performance. Il est calculé sur le résultat opérationnel des activités avant quote-part du résultat net des sociétés mises en équivalence et part attribuable aux Intérêts non contrôlants, diminué des produits et charges financiers. Sanofi considère que la présentation de cet indicateur alternatif, utilisé par la Direction, est également utile pour les investisseurs puisqu’il permet d’analyser le coût effectif d’imposition sur nos activités opérationnelles courantes. Il ne doit cependant pas se substituer au taux effectif d’imposition sur le résultat net consolidé. Le taux effectif d’imposition sur le « Résultat net des activités » ressort à 21,8 % au premier semestre 2026, contre 21,0 % au premier semestre 2025 et 19,9 % pour l’ensemble de l’année 2025. Les principaux facteurs comprennent les variations des provisions pour impôts différés liées à l'actif incorporel Amlitelimab ainsi que la variation d'une année sur l'autre, compte tenu des effets complets de la part de 2026 de la surtaxe exceptionnelle temporaire en France basée sur les bénéfices imposables de 2025.
D.4.15. Quote-part du résultat net des sociétés mises en équivalence La Quote-part de résultat net des sociétés mises en équivalence s'élève à un gain net de 2 millions d'euros sur le premier semestre 2026 qui inclut une perte nette de 39 millions d'euros au titre de la quote-part de Sanofi dans OPAL JV Co (à comparer à un gain net de 85 millions d'euros sur le premier semestre 2025 qui inclut un gain net de 11 millions d'euros au titre de la quotepart de Sanofi dans OPAL JV Co pour la période commençant le 1er mai 2025 et se terminant le 30 juin 2025).
D.4.16. Résultat net des activités poursuivies Le Résultat net des activités poursuivies s’élève à 1 971 millions d’euros au premier semestre 2026, contre 2 956 millions d’euros au premier semestre 2025.
D.4.17. Résultat net des activités abandonnées Au premier semestre 2026, le résultat net des activités abandonnées s'est élevé à 26 millions d'euros en raison principalement de l'impact de la finalisation des états financiers d'Opella, contre 2 881 millions en 2025 qui reflétait les résultats d'Opella jusqu'à la date de perte de contrôle et incluant un gain net de 2 693 millions d'euros résultant de la cession d'Opella à la date de perte de contrôle.
D.4.18. Résultat net de l'ensemble consolidé Le Résultat net de l’ensemble consolidé s’élève à 1 997 millions d’euros au premier semestre 2026, contre 5 837 millions d’euros au premier semestre 2025, ce chiffre comprenait un gain de 2 693 millions d’euros sur la cession d’Opella.
D.4.19. Part attribuable aux intérêts non contrôlants La Part attribuable aux Intérêts non contrôlants ressort à 40 millions d’euros au 30 juin 2026 contre 25 millions d’euros au 30 juin 2025.
D.4.20. Résultat net consolidé – Part attribuable aux actionnaires de Sanofi Le Résultat net consolidé - Part attribuable aux actionnaires de Sanofi s’élève à 1 957 millions d’euros au premier semestre 2026 contre 5 812 millions d’euros au premier semestre 2025.
(1)
Voir définition à la section « D.2. Résultat net des activités ».
54
SANOFI
RAPPORT FINANCIER SEMESTRIEL 2026
Rapport financier semestriel 2026 Rapport semestriel d'activité
Le résultat de base par action s’établit à 1,63 euro, contre 4,74 euros au premier semestre 2025, sur la base d’un nombre moyen d’actions en circulation de 1 200,4 millions, contre 1 225,5 millions au premier semestre 2025. Le résultat dilué par action s’établit à 1,62 euro, contre 4,72 euros au premier semestre 2025, tenant compte d’un nombre moyen d’actions après dilution de 1 205,5 millions, contre 1 230,7 millions au premier semestre 2025.
D.5. Résultats sectoriels Pour le segment Biopharma, le « Résultat opérationnel des activités » (voir la définition et le détail dans la note B.21.1. aux comptes semestriels consolidés condensés) s’élève à 6 258 millions d’euros au premier semestre 2026 contre 5 363 millions d’euros au premier semestre 2025, en augmentation de 16,7 %. Il représente 28,3 % du chiffre d’affaires, contre 27,0 % au premier semestre 2025.
D.6. Synthèse des flux de trésorerie consolidés Tableau synthétique des flux de trésorerie consolidés (en millions d'euros)(a) Flux de trésorerie liés aux activités opérationnelles poursuivies Flux de trésorerie liés aux activités opérationnelles d'Opella (activité abandonnée)
30 juin 2026 (6 mois)
30 juin 2025 (6 mois)
4 643
3 367
—
188
Flux de trésorerie liés aux activités opérationnelles
4 643
3 555
Flux de trésorerie liés aux activités d’investissement poursuivies
(2 423)
(1 979)
Flux de trésorerie liés aux activités d’investissement d'Opella (activité abandonnée) Flux de trésorerie nets liés à la transaction Opella (b)
—
(36)
(220)
10 742
Flux de trésorerie liés aux activités d'investissement
(2 643)
8 727
Flux de trésorerie liés aux activités de financement poursuivies
(3 332)
(4 441)
—
(48)
Flux de trésorerie liés aux activités de financement d'Opella (activité abandonnée) Flux de trésorerie liés aux activités de financement
(3 332)
(4 489)
Incidence sur la trésorerie de la variation des taux de change
19
(42)
Trésorerie reclassée en Actifs destinés à être cédés au 31 décembre 2024
—
167
(1 313)
7 918
Variation nette de la trésorerie Trésorerie à l’ouverture (c)
7 663
7 441
Trésorerie à la clôture de l'exercice
6 350
15 359
(a) Les flux de trésorerie d’Opella sont présentés séparément en application de la norme IFRS 5, Actifs non courants détenus en vue de la vente et activités abandonnées. (b) Au 30 juin 2025, ce montant inclut (667) millions d’euros correspondant au montant de trésorerie et d’équivalents de trésorerie d’Opella au 30 avril 2025. (c) Inclut l'impact de l'amendement IFRS 9 relatif au classement des instruments financiers applicable à compter du 1er janvier 2026.
Les flux de trésorerie liés aux activités opérationnelles poursuivies s’élèvent à 4 643 millions d’euros au premier semestre 2026 contre 3 367 millions d’euros au premier semestre 2025. Cette augmentation provient principalement d'une amélioration de la marge brute d'autofinancement (5 233 millions d’euros au 30 juin 2026 contre 3 980 millions d’euros au 30 juin 2025). Le besoin en fonds de roulement diminue de 590 millions d'euros au premier semestre 2026, contre une diminution de 613 millions d’euros au premier semestre 2025. Les flux de trésorerie liés aux activités d’investissement poursuivies représentent un décaissement net de 2 423 millions d’euros au premier semestre 2026. Le principal décaissement au premier semestre 2026 concerne l'acquisition de Dynavax pour 1 403 millions d'euros (voir note B.1.1. aux comptes semestriels consolidés condensés), contre un décaissement net de 1 979 millions d’euros au premier semestre 2025 principalement lié à l'acquisition de Dren-0201, Inc. pour 539 millions d'euros. En outre, les acquisitions d’immobilisations corporelles et incorporelles s’élèvent à 1 296 millions d’euros (contre 1 420 millions d’euros au premier semestre 2025). Les acquisitions d’immobilisations corporelles (882 millions d’euros, contre 845 millions d’euros au premier semestre 2025) correspondent principalement à des investissements dans le domaine industriel. Les acquisitions d’immobilisations incorporelles (414 millions d’euros, contre 575 millions d’euros au premier semestre 2025) correspondent principalement aux paiements contractuels relatifs aux droits incorporels essentiellement liés à des accords de licence ou de collaboration. Les produits de cessions nets d’impôts, à l'exclusion des produits de cession de titres consolidés et de participations des sociétés mises en équivalence, s'élèvent à 424 millions d’euros au premier semestre 2026 contre 434 millions d'euros au premier semestre 2025, et correspondent notamment à la cession d'actifs et d'activités liés à la rationalisation du portefeuille et à la cession d'instruments de capitaux propres et de dettes.
SANOFI
RAPPORT FINANCIER SEMESTRIEL 2026
55
Rapport financier semestriel 2026 Rapport semestriel d'activité
Les flux de trésorerie liés aux activités de financement poursuivies présentent un décaissement net de 3 332 millions d’euros au premier semestre 2026 contre un décaissement net de 4 441 millions d’euros au premier semestre 2025. Au premier semestre 2026, ils intègrent notamment le versement de dividendes aux actionnaires de Sanofi pour 4 923 millions d’euros (contre 4 772 millions d’euros au premier semestre 2025), un encaissement net d'emprunts de 2 607 millions d’euros (contre un encaissement net d'emprunts de 4 332 millions d’euros au premier semestre 2025), et des mouvements sur le capital de Sanofi incluant les achats d'actions propres et l'effet fiscal associé pour 1 009 millions d'euros (contre 4 003 millions d'euros au premier semestre 2025). Le flux de trésorerie net de la transaction Opella pour le premier semestre 2026 a représenté une sortie de trésorerie de 220 millions d'euros contre une entrée de trésorerie nette de 10 742 millions d'euros. La variation nette de la trésorerie à l’actif du bilan au cours du premier semestre 2026 correspond à une diminution de 1 313 millions d’euros, contre une augmentation de 7 918 millions d’euros au premier semestre 2025. Le « Cash-Flow libre » est un indicateur non IFRS suivi par la Direction de l’entreprise qui fournit des informations utiles afin d’évaluer la trésorerie nette générée par les opérations du Groupe et disponible pour les investissements stratégiques (1) (nets des désinvestissements (1)), le remboursement de la dette nette et les paiements aux actionnaires. Le « Cash-Flow libre » est déterminé à partir du résultat net des activités (2) après ajout (charges, pertes) ou déduction (produits, gains) des amortissements et dépréciations, des résultats des sociétés mises en équivalence nets des dividendes reçus, des plus ou moins-values sur cessions d’actifs non courants, de la variation des provisions (incluant celles pour retraites et autres avantages postérieurs à l’emploi), des impôts différés, et du coût lié aux paiements en actions et des autres éléments sans impact sur la trésorerie. Il inclut également les variations du besoin en fonds de roulement, les acquisitions d’immobilisations corporelles et autres acquisitions (3) nettes des produits de cessions d’actifs (3) et les paiements liés aux restructurations et assimilées. Le « Cash-Flow libre » n’est pas définit par les normes IFRS et ne remplace pas l’indicateur IFRS du Flux de trésorerie liés aux activités opérationnelles. La Direction reconnaît que le terme « Cash-Flow libre » peut être interprété différemment par d’autres sociétés et dans des circonstances différentes. Le tableau ci-dessous présente la réconciliation entre le Flux de trésorerie liés aux activités opérationnelles et le « Cash-Flow libre » : (en millions d’euros) Flux de trésorerie liés aux activités opérationnelles (a) Flux de trésorerie liés aux activités opérationnelles Opella (activité abandonnée)
30 juin 2026 (6 mois)
30 juin 2025 (6 mois)
4 643
3 555
—
(188)
Acquisitions d’immobilisations corporelles et logiciels
(967)
(873)
Acquisitions d’immobilisations incorporelles, titres et autres actifs financiers long-terme (b)
(534)
(986)
Produits de cessions d’immobilisations corporelles, incorporelles et autres actifs non courants nets d'impôts (b)
361
434
Remboursement de la dette des contrats de location
(147)
(124)
Autres (c)
368
640
3 724
2 458
Cash-flow libre (d) (non-IFRS)
(a) Agrégat IFRS réconciliable au Cash-flow libre. (b) Transactions n'excédant pas 500 millions d'euros par transaction. (c) Ce poste comprend les sorties de trésorerie liées aux litiges majeurs non inclus dans le flux de trésorerie disponible, notamment Plavix Hawaii en 2025. (d) Indicateur non IFRS (voir définition ci-dessus).
D.7. Bilan consolidé Au 30 juin 2026, le total du bilan s’élève à 129 060 millions d’euros contre 126 805 millions d’euros au 31 décembre 2025, en hausse de 2 255 millions d’euros. La dette financière nette, s’établit à 15 513 millions d’euros au 30 juin 2026 contre 11 008 millions d’euros au 31 décembre 2025. Sanofi estime que l'examen de cet indicateur non IFRS par la Direction est utile pour suivre le niveau global des liquidités et ressources en capital. Il est défini comme la somme de la dette financière (à court et à long terme) et des instruments dérivés de taux et de change dédiés à la gestion de la dette, diminuée du montant de la trésorerie et des équivalents de trésorerie et des instruments dérivés de taux et de change dédiés à la couverture de la trésorerie et aux équivalents de trésorerie.
(1) (2) (3)
56
Montant supérieur à 500 millions d’euros par transaction. Indicateur alternatif de performance, voir définition à la section « Résultat net des activités ». Montant n’excédant pas 500 millions d’euros par transaction.
SANOFI
RAPPORT FINANCIER SEMESTRIEL 2026
Rapport financier semestriel 2026 Rapport semestriel d'activité
Au 30 juin 2026
31 décembre 2025
Emprunts à long terme
14 646
14 248
Emprunts à court terme et part à court terme de la dette à long terme
7 026
4 342
(en millions d’euros)
Instruments dérivés de taux et de change dédiés à la gestion de la dette financière
221
112
Total dette financière (IFRS)
21 893
18 702
Trésorerie et équivalents de trésorerie
(6 350)
(7 657)
(30)
(37)
15 513
11 008
69 567
71 710
Instruments dérivés de taux et de change dédiés à la gestion de la trésorerie et des équivalents de trésorerie Dette financière, nette
(a)
(non-IFRS)
Total des capitaux propres Ratio d’endettement (non-IFRS)
22,3 %
15,4 %
(a) La dette financière nette n’inclut pas le montant de la dette locative qui s'élève à 1 904 millions d'euros au 30 juin 2026, contre 1 739 millions d'euros au 31 décembre 2025.
Sanofi utilise également le ratio d’endettement, indicateur alternatif de performance, considéré pertinent pour évaluer le risque lié au financement. Ce ratio de la « dette financière nette » sur le total des capitaux propres passe de 15,4 % au 31 décembre 2025 à 22,3 % au 30 juin 2026. L’endettement financier de Sanofi au 30 juin 2026 et au 31 décembre 2025 est détaillé dans la note B.9. aux comptes semestriels consolidés condensés. Étant donné que la « Dette financière nette » et le « Ratio d’endettement » sont des indicateurs alternatifs de performance, ils peuvent ne pas être directement comparables aux indicateurs alternatifs de performance utilisés par d'autres sociétés. Malgré l’utilisation de ces indicateurs par la Direction pour établir des objectifs et mesurer la performance, il convient de rappeler qu'il s’agit de mesures n'ayant pas de signification standard prescrite par les normes IFRS. Sanofi estime que les flux futurs de trésorerie liés aux activités opérationnelles seront suffisants pour rembourser sa dette. Les financements en place au 30 juin 2026, au niveau de la Société Sanofi, ne sont pas subordonnés au respect de ratios financiers et ne comportent ni clause d’indexation des marges ni commission en fonction du rating. Les principales autres évolutions du bilan sont résumées ci-dessous. Le total des capitaux propres s’établit à 69 567 millions d’euros au 30 juin 2026 contre 71 710 millions d’euros au 31 décembre 2025. Cette variation nette reflète principalement : • en augmentation, le résultat net de l’ensemble consolidé du premier semestre 2026 (1 997 millions d’euros); • en augmentation de 1 802 millions d'euros, reflétant l'écart de change qui résulte de la conversion en euros des états financiers des filiales étrangères, lié principalement à la variation du cours de change du dollar; • en réduction, les dividendes versés aux actionnaires pour 4 923 millions d'euros; et • Sanofi a racheté 12 571 455 de ses propres actions au cours du premier semestre 2026 pour un montant total de 1 003 millions d'euros, auxquels s'ajoutent 3 millions d'euros d'impôts payés. Au 30 juin 2026, Sanofi détenait 16,03 millions de ses propres actions inscrites en diminution des capitaux propres, représentant 1,320 % du capital. Les postes Écart d’acquisition et Autres actifs incorporels (68 313 millions d’euros) augmentent de 752 millions d’euros, une variation principalement attribuée l'acquisition de Dynavax ainsi qu'à l’impact des taux de change, en particulier à la fluctuation du dollar américain partiellement compensée par l'amortissement et la dépréciation des autres immobilisations incorporelles comptabilisés au cours de la période. Le poste Participations dans les sociétés mises en équivalence (3 207 millions d’euros) diminue de 52 millions d’euros. Les Autres actifs non courants (4 732 millions d’euros) sont en augmentation de 368 millions d’euros. Les Impôts différés actifs nets (7 210 millions d’euros au 30 juin 2026, contre 6 942 millions d’euros au 31 décembre 2025) affichent une hausse de 268 millions d’euros. Les Provisions et autres passifs non courants (6 848 millions d’euros) augmentent de 145 millions d’euros par rapport au 31 décembre 2025. Les Passifs liés à des regroupements d’entreprises et à des Intérêts non contrôlants (652 millions d’euros) sont en hausse de 67 millions d’euros.
SANOFI
RAPPORT FINANCIER SEMESTRIEL 2026
57
Rapport financier semestriel 2026 Rapport semestriel d'activité
E/ Facteurs de risque et transactions entre parties liées E.1. Facteurs de risque Les principaux facteurs de risque auxquels Sanofi est exposé figurent dans le document d'enregistrement universel 2025 de Sanofi déposé auprès de l’Autorité des marchés financiers le 17 février 2026 sous le numéro D.26-0030 (1). Chacun de ces risques, et d'autres qui n'ont pas encore pu être identifiés, sont susceptibles de survenir au second semestre de l’exercice 2026 ou durant les exercices ultérieurs, et pourraient entraîner un écart significatif entre les résultats actuels et ceux décrits dans le reste de ce document.
E.2. Transactions entre parties liées Les principales parties liées sont définies à la note D.33. aux états financiers consolidés du document d'enregistrement universel 2025 (1), page 427. La note B.5. aux comptes semestriels consolidés condensés présente les principales transactions et les soldes du premier semestre 2026 avec des sociétés consolidées par mise en équivalence, considérées comme des parties liées. Aucune opération n’a été conclue avec un membre des organes de direction au cours du premier semestre 2026. Les relations à caractère financier avec les principaux actionnaires présentent le caractère d’opérations courantes et sont non significatives sur le premier semestre 2026.
(1)
58
Ce document est disponible sur le site internet www.sanofi.com.
SANOFI
RAPPORT FINANCIER SEMESTRIEL 2026
Rapport financier semestriel 2026 Rapport semestriel d'activité
F/ Perspectives En 2026, Sanofi anticipe un taux de croissance autour de 10 % pour son chiffre d’affaires, à taux de change constant (tcc) (1). Le résultat net des activités (BNPA) (2) devrait connaître une croissance légèrement supérieure à celle des ventes. Aux cours de change en vigueur en juillet 2026, l’incidence des changes sur le chiffre d’affaires est estimée à environ -1 %, et sur le BNPA à environ -2 %. Pour l’ensemble de l’année 2025, le résultat net des activités s’élevait à 9 555 millions d’euros soit 7,83 euros par action. Ces perspectives ont été élaborées sur une base comparable à celle de la préparation de l’information financière historique et en conformité avec les principes comptables de Sanofi. Elles ont été établies sur la base d’hypothèses définies par la Société et ses filiales, notamment concernant les éléments suivants : • • • • • • •
l’évolution de la concurrence en termes de produits innovants et d’introduction de produits génériques ; le respect des droits de propriété intellectuelle ; l’avancement des programmes de recherche et développement ; l’impact de la politique de maîtrise des coûts opérationnels et leur évolution ; l’évolution des cours de change et des taux d’intérêt ; l’intégration de la contribution des acquisitions ; et le nombre moyen d’actions en circulation.
Certaines de ces informations, hypothèses et estimations, émanent ou reposent, entièrement ou en partie, sur des appréciations et des décisions de la Direction de Sanofi qui pourraient évoluer ou être modifiées dans le futur.
(1) (2)
Indicateur alternatif de performance, voir définition à la section « D.3. Chiffre d'affaires». Indicateur alternatif de performance, voir définition à la section « D.2. Résultat net des activités ».
SANOFI
RAPPORT FINANCIER SEMESTRIEL 2026
59
Rapport financier semestriel 2026 Rapport semestriel d'activité
Avertissement sur les prévisions et les informations prospectives Ce document contient des déclarations prospectives (au sens du US Private Securities Litigation Reform Act of 1995). Ces déclarations ne constituent pas des faits historiques. Ces déclarations comprennent des projections et des estimations ainsi que les hypothèses sur lesquelles celles-ci reposent, des déclarations portant sur des projets, des objectifs, des intentions et des attentes concernant des résultats financiers, des événements, des opérations, des services futurs, le développement de produits et leur potentiel ou les performances futures. Ces déclarations prospectives peuvent souvent être identifiées par les mots « s’attendre à », « anticiper », « pouvoir », « contempler », « croire », « avoir l’intention de », « envisager », « viser », « planifier », « est conçu pour », « pourrait », « prévoir », « prédire », « potentiel », « objectif », « estimer », « projeter », « programmer », « devoir », « vouloir », « ambition », « chercher à », ou le négatif de ceux-ci et le cas échéant, d'autres termes similaires. Bien que la direction de Sanofi estime que ces déclarations prospectives sont raisonnables, les investisseurs sont alertés sur le fait que ces déclarations prospectives sont soumises à de nombreux risques et incertitudes, difficilement prévisibles et généralement en dehors du contrôle de Sanofi, qui peuvent impliquer que les résultats et événements effectifs réalisés diffèrent significativement de ceux qui sont exprimés, induits ou prévus dans les informations et déclarations prospectives. Ces risques, incertitudes et hypothèses comprennent notamment les incertitudes inhérentes à la recherche et développement, les futures données cliniques et analyses, y compris postérieures à la mise sur le marché, les décisions des autorités réglementaires, telles que la FDA ou l’EMA, d’approbation ou non, et à quelle date, de la demande d’autorisation de mise sur le marché ou de dépôt d’un médicament, d’un procédé ou d’un produit biologique pour l’un de ces produits candidats, ainsi que leurs décisions relatives à l’étiquetage et d’autres facteurs qui peuvent affecter la disponibilité ou le potentiel commercial de ces produits candidats, le fait que les produits candidats s’ils sont approuvés pourraient ne pas rencontrer un succès commercial, l’approbation future et le succès commercial d’alternatives thérapeutiques, la capacité de l'entreprise à saisir des opportunités de croissance externe et à finaliser les transactions y afférentes et/ou à obtenir les autorisations réglementaires, les risques associés à la propriété intellectuelle et les litiges en cours ou futurs y afférents ainsi que leur dénouement, l’évolution des cours de change et des taux d’intérêt, l’instabilité des conditions économiques et de marché, des initiatives de maîtrise des coûts et leur évolution, et le nombre moyen d’actions en circulation. Tout impact significatif sur ces derniers pourrait négativement impacter Sanofi. La situation évolue rapidement et d’autres conséquences encore ignorées pourraient apparaître et exacerber les risques précédemment identifiés. Ces risques et incertitudes incluent aussi ceux qui sont développés ou identifiés dans les documents publics déposés par Sanofi auprès de l'Autorité des marchés financiers (AMF) et de la Securities and Exchange Commission (SEC), y compris ceux énumérés dans les rubriques « Facteurs de risque (1) et « Déclarations prospectives » du document d’enregistrement universel 2025 de Sanofi, qui a été déposé auprès de l’AMF ainsi que dans les rubriques « Risk Factors » (2) et « Cautionary Statement Regarding Forward-Looking Statements » du rapport annuel 2025 sur Form 20-F de Sanofi, qui a été déposé auprès de la SEC. Une mise à jour des litiges figure dans la note « B.14. Litiges et arbitrages » de l’information financière semestrielle consolidée au 30 juin 2026 (page 28), à la section « A.3.2. Litiges et arbitrages » (page 40) et à la section « E/ Facteurs de risques et transactions entre parties liées » (page 58) du présent rapport semestriel d’activité. En ce qui concerne les informations relatives au développement durable ou environnemental, social et à la gouvernance (ESG) contenues dans le présent document, à la lumière des incertitudes significatives inhérentes à ces déclarations prospectives et autres informations connexes contenues dans le présent document, ces dernières ne doivent pas être considérées comme une déclaration ou une garantie, de la part de Sanofi ou de quiconque, que Sanofi atteindra ses buts, objectifs, aspirations, indicateurs, plans ou cibles dans un délai donné, ou qu’elle les atteindra tout court, et notamment pour ce qui concerne les questions relatives au domaine ESG et au développement durable. De telles déclarations et autres informations sont tributaires de l’évolution future de facteurs de marché tels que la demande des clients, la poursuite des progrès technologiques ainsi que, de la part des pouvoirs publics, d'un soutien politique et de l’adoption de règles en temps opportun ou du maintien de mesures incitatives et de financements. La capacité de Sanofi à atteindre ses buts, ses objectifs, ses aspirations, ses indicateurs, ses plans ou ses cibles, dans un délai donné voire tout court, notamment pour ce qui concerne les questions relatives au domaine ESG et au développement durable, est tributaire d'autres conditions et considérations, qui échappent pour certaines au contrôle de Sanofi, et qui peuvent également nuire à sa capacité à mettre en place les mesures nécessaires pour les atteindre. Parmi ces autres conditions et considérations figurent notamment les facteurs de risque décrits ci-dessus. En outre, il n’est pas exclu que certaines déclarations relatives à l'environnement, à d'autres facteurs ESG ou au développement durable, qu'elles concernent le passé, le présent ou l'avenir, soient fondées sur des standards (s’agissant de mesurer des progrès réalisés) encore en cours d'élaboration, sur des contrôles et processus internes qui continuent d'évoluer, ou sur des hypothèses susceptibles d'être modifiées à l'avenir, et notamment par certaines lois et réglementations futures. Sanofi entend continuer à évaluer ses buts, objectifs, aspirations, indicateurs, plans et cibles, ainsi que sa manière de les approcher, et pourrait être amenée à y apporter les ajustements qu'elle juge nécessaires à la lumière de telles considérations. Sanofi ne prend aucun engagement de mettre à jour les informations et déclarations prospectives sous réserve de la réglementation applicable notamment les articles 223-1 et suivants du règlement général de l’Autorité des marchés financiers. Toutes les marques commerciales mentionnées dans ce document sont protégées, et sont des marques appartenant à Sanofi et/ ou ses filiales, ou des marques qui sont prises en licence par Sanofi et/ou par ses filiales, ou des marques appartenant à des tiers (notamment Regeneron et Sobi).
(1) (2)
Voir pages 274 à 296 du document d’enregistrement universel 2025 ; ce document est disponible sur le site internet www.sanofi.com. Voir pages 1 à 16 de l’Annual report on Form 20-F 2025 ; ce document est disponible sur le site internet www.sanofi.com.
60
SANOFI
RAPPORT FINANCIER SEMESTRIEL 2026
Rapport financier semestriel 2026 Rapport semestriel d'activité
Annexe – Portefeuille de recherche & développement Enregistrement Nom
Description
Indication
venglustat
Inhibiteur oral de GCS
Maladie de Gaucher de type 3 (US, EU, JP)
Sarclisa
AcM CD38, voie sous-cutanée
Myélome multiple (CN)
Fluzone HD
Vaccin inactivé multivalent
Grippe, 50 ans+ (US, EU)
SP0087
Vaccin sur cellules Vero
Rage (EU)
Phase 3 Nom
Description
Indication
Immunologie
Nom
Description
Indication
Maladies rares
Dupixent (a)
AcM IL4R
Prurit chronique d’origine inconnue
Nexviazyme
Enzymothérapie substitutive
Maladie de Pompe, forme infantile (US)
duvakitug (b)
AcM TL1A
Maladie de Crohn Colite ulcéreuse
elenestinib
Inhibiteur de KIT muté D816V
Mastocytose systémique indolente/latente
lunsekimig
Nanobody® VHH IL13xTSLP
Bronchopneumopathie chronique obstructive
fitusiran
ARNi ciblant l’antithrombine
Hémophilie A et B (EU, JP)
Rezurock
Inhibiteur de ROCK2
Dysfonction chronique de greffon pulmonaire
Inhibiteur de BTK
Drépanocytose Maladie liée aux IgG4 Anémie hémolytique auto-immune à auto-anticorps chauds
frexalimab (c)
AcM CD40L
Rejet de greffe de rein
frexalimab (c)
AcM CD40L
Sclérose en plaques récurrente Sclérose en plaques progressive secondaire
riliprubart
AcM C1s
PIDC traitée par IgIV
Neurologie
Wayrilz
Oncologie Sarclisa AcM CD38
MMND, TE (HD7) MMND, TE (IsKia) Myélome multiple indolent (ITHACA)
Vaccins SP0218
Vaccin sur cellules Vero Fièvre jaune
SP0202 (d)
Vaccin conjugué 21valent
Infections à pneumocoque (enfants)
Collaborations : (a) Regeneron - (b) Teva Pharmaceuticals - (c) ImmuNext - (d) SK bioscience Abréviations : AcM : anticorps monoclonal - BTK : tyrosine kinase de Bruton - CD : cluster de différenciation - C1s : composant 1 du complément - PIDC : polyneuropathie inflammatoire démyélinisante chronique - CN: Chine - EU: Europe - GCS : glucosylcéramide synthase - HD : haute dose - IgG4: Immunoglobulines G4 - IL : interleukine - IVIg : immunoglobuline intraveineuse - JP : Japon - MM : myélome multiple - SEP : sclérose en plaques - NDMM : myélome multiple nouvellement diagnostiqué - ARNi : interférence ARN - ROCK2 : protéine kinase 2 associée à la protéine coiled-coil contenant Rho - VRS : virus respiratoire syncytial - TE : éligible à une greffe - TI : inéligible à une greffe - US : États-Unis.
SANOFI
RAPPORT FINANCIER SEMESTRIEL 2026
61
Rapport financier semestriel 2026 Rapport semestriel d'activité
Phase 2 Nom
Description
Indication
brivekimig
Nanobody® VHH TNFaxOX40L
Maladie de Crohn Hidradénite suppurée Colite ulcéreuse Diabète de type 1, stade 3
frexalimab (a)
AcM CD40L
lunsekimig
Description
Indication
Wayrilz
Inhibiteur de BTK
Maladie de Graves
Diabète de type 1, stade 3
efdoralprin alfa
Protéine de fusion AAT
Emphysème dans le déficit en alpha-1 antitrypsine
Nanobody® VHH IL13xTSLP
Asthme Asthme à haut risque Rhinosinusite chronique avec polypes nasaux
frexalimab rilzabrutinib brivékimig
AcM CD40L Inhibiteur de BTK Nanobody® VHH TNFaxOX40L
Glomérulosclérose segmentaire et focale/ maladie à changement minimal
SAR449028
Inhibiteur de KIT de type sauvage
Urticaire chronique
SAR444336
Synthorin non-beta IL2
Colite microscopique
Oncologie
SAR445399 (1)
AcM IL1R3
Hidradénite suppurée
SAR445877
Protéine de fusion PD1xIL15
Tumeurs solides
Sarclisa
AcM CD38
Myélome multiple récidivant ou réfractaire en combinaison
SP0256
Vaccin à ARNm
Infections à VRS+hMPV (adultes âgés)
Immunologie
Maladie rare
Neurologie SAR402663
Nom
Vaccins Thérapie génique VAA sFLT01
Dégénérescence maculaire liée à l’âge
SP0268
Vaccin à ARNm
Acné
SP0289
Vaccin à ARNm
Grippe H5 pandémique
SP0335
Vaccin inactivé adjuvanté Grippe H5 pandémique
Nom
Description
Indication
Phase 1 Nom
Description
Indication
Oncologie
Immunologie SAR446422
Anticorps bispécifique CD28×OX40
Indication inflammatoire
SAR445953 (b)
Conjugué anticorpsmédicament CEACAM5Topo1
Cancer colorectal
SAR448501
AcM CD20 bispécifique
Indication inflammatoire
SAR446523
AcM GPRC5D
Myélome multiple récidivant ou réfractaire
SAR447971
IRAK4 degrader
Hidradénite suppurée
SAR449336
Inhibiteur de pan KRAS
Cancer colorectal
SAR446597
Thérapie génique VAA BbxC1s
Atrophie géographique dans la dégénérescence maculaire liée à l’âge
SP0287
Fluzone HD+Nuvaxovid
Grippe+COVID-19
SAR448851
Agoniste de TREM2
Maladie d’Alzheimer
SP0287
Flublok+Nuvaxovid
Grippe+COVID-19
SP0291
Vaccin à ARNm
Infections à VRS+hMPV +PIV3 (adultes âgés)
SP0269
Vaccin à ARNm
Infections à Chlamydia
SP0340
Vaccin sous-unitaire
Infections à VRS+hMPV (adultes âgés)
SP0341
Vaccin sous-unitaire
Infections à VRS+hMPV +PIV3 (adultes âgés)
SP0342
Vaccin sous-unitaire adjuvanté
Zona
Neurologie
Vaccins
Maladies rares SAR446268
Thérapie génique VAA DMPK
Dystrophie myotonique de type 1
(1) Également connu sous le nom de MAB212, provenant de MAB Discover. Collaborations : (a) ImmuNext - (b) Pfizer Abréviations : AAT: Alpha-1 antitrypsine - AcM : anticorps monoclonal - ARNm: ARN messager - BTK : tyrosine kinase de Bruton - CD : cluster de différenciation - C1s : composant 1 du complément - CEACAM5: Carcinoembryonic antigen cell adhesion molecule 5 - DMPK: dystrophia myotonica protein kinase 1 - GPRC5D: Gprotein-coupled receptor class 5 member D - H5: hémagglutinine 5 - hMPV: metapneumovirus humain - IL: Interleukine - IL1R3: récepteur 3 à l’interleukine-1
- JAK: Janus kinase - KRAS: V-Ki-ras2 Kirsten rat sarcoma viral oncogene homolog - PD1: Programmed death protein 1 - PIV3: virus parainfluenza de type 3
- RSV: virus respiratoire syncytial - sFLT01, soluble fms-like tyrosine kinase-1 - TNFa: facteur de nécrose tumorale alpha - TNFR1: récepteur 1 au facteur de nécrose tumorale - Topo1: Topoisomérase 1 - TREM2: triggering receptor expressed on myeloid cells 2 - TSLP: Thymic stromal lymphopoietin - VAA: virus adéno-associé
62
SANOFI
RAPPORT FINANCIER SEMESTRIEL 2026
Rapport financier semestriel 2026 Rapport des commissaires aux comptes sur l'information financière semestrielle
-
Rapport des commissaires aux comptes sur l'information financière semestrielle Période du 1er janvier au 30 juin 2026 Aux Actionnaires, En exécution de la mission qui nous a été confiée par votre assemblée générale, et en application de l'article L. 451-1-2 III du code monétaire et financier, nous avons procédé à : • l'examen limité des comptes semestriels consolidés condensés de la société Sanofi, relatifs à la période du 1ᵉʳ janvier 2026 au 30 juin 2026, tels qu'ils sont joints au présent rapport ; • la vérification des informations données dans le rapport semestriel d'activité. Ces comptes semestriels consolidés condensés ont été établis sous la responsabilité du conseil d'administration. Il nous appartient, sur la base de notre examen limité, d'exprimer notre conclusion sur ces comptes.
-
Conclusion sur les comptes Nous avons effectué notre examen limité selon les normes d'exercice professionnel applicables en France. Un examen limité consiste essentiellement à s'entretenir avec les membres de la direction en charge des aspects comptables et financiers et à mettre en œuvre des procédures analytiques. Ces travaux sont moins étendus que ceux requis pour un audit effectué selon les normes d'exercice professionnel applicables en France. En conséquence, l'assurance que les comptes, pris dans leur ensemble, ne comportent pas d'anomalies significatives obtenue dans le cadre d'un examen limité est une assurance modérée, moins élevée que celle obtenue dans le cadre d'un audit. Sur la base de notre examen limité, nous n'avons pas relevé d'anomalies significatives de nature à remettre en cause la conformité des comptes semestriels consolidés condensés avec la norme IAS 34, norme du référentiel IFRS tel qu’adopté dans l’Union européenne relative à l’information financière intermédiaire.
-
Vérification spécifique Nous avons également procédé à la vérification des informations données dans le rapport semestriel d'activité commentant les comptes semestriels consolidés condensés sur lesquels a porté notre examen limité. Nous n'avons pas d'observation à formuler sur leur sincérité et leur concordance avec les comptes semestriels consolidés condensés. Fait à Neuilly-sur-Seine et Levallois-Perret, le 30 juillet 2026
Les Commissaires aux Comptes PricewaterhouseCoopers Audit Anne-Claire Ferrié
Amélie Graffan
Forvis Mazars SA Loïc Wallaert
SANOFI
Ariane Mignon
RAPPORT FINANCIER SEMESTRIEL 2026
63
Rapport financier semestriel 2026 Attestation du responsable du rapport financier semestriel
- Attestation du responsable du rapport financier semestriel « J’atteste, à ma connaissance, que les comptes consolidés condensés pour le semestre écoulé sont établis conformément aux normes comptables applicables et donnent une image fidèle et honnête du patrimoine, de la situation financière et du résultat de la société et de l’ensemble des entreprises comprises dans la consolidation, et que le rapport semestriel d'activité figurant en page 36 présente un tableau fidèle des événements importants survenus pendant les six premiers mois de l'exercice, de leur incidence sur les comptes semestriels, des principales transactions entre parties liées ainsi qu'une description des principaux risques et des principales incertitudes pour les six mois restants de l'exercice. » Paris, le 30 juillet 2026 Belén Garijo Directrice Générale
64
SANOFI
RAPPORT FINANCIER SEMESTRIEL 2026
0
Photo credits: Shuan Ji, Principal Scientist, Cambridge, Sanofi US - @Zoe Savitz
Exhibit 99.1
Exhibit 99.1
TABLE OF CONTENTS
- Condensed half-year consolidated financial statements
2
Consolidated balance sheets - assets
2
Consolidated balance sheets - equity and liabilities
3
Consolidated income statements
4
Consolidated statements of comprehensive income
5
Consolidated statements of changes in equity
6
Consolidated statement of cash flows
8
Notes to the condensed half-year consolidated financial statements as of June 30, 2026
10
Introduction
10
A/ Basis of preparation of the half-year financial statements and accounting policies
10
B/ Significant information for the first half of 2026
13
SANOFI
HALF-YEAR FINANCIAL REPORT 2026
1
Exhibit 99.1
-
Condensed half-year consolidated financial statements
-
Condensed half-year consolidated financial statements Consolidated balance sheets - assets (Unaudited(1)) (€ million)
Note
June 30, 2026
December 31, 2025
Property, plant and equipment owned
B.2.
10,364
10,052
Right-of-use assets
1,590
1,459
B.3.
41,954
41,300
Other intangible assets
B.3.
26,359
26,261
Investments accounted for using the equity method
B.5.
3,207
3,259
Other non-current assets
B.6.
4,732
4,364
Goodwill
Non-current income tax assets
569
550
Deferred tax assets
8,763
8,608
Non-current assets
97,538
95,853
11,127
10,214
Inventories Accounts receivable
B.7.
Other current assets Current income tax assets Cash and cash equivalents Assets held for sale
B.9.
8,714
8,410
4,282
4,066
492
397
6,350
7,657
557
208
Current assets
31,522
30,952
Total assets
129,060
126,805
The accompanying notes on pages 10 to 33 are an integral part of the condensed half-year consolidated financial statements.
(1)
2
These unaudited condensed half-year consolidated financial statements as of June 30, 2026 should be read in conjunction with Sanofi’s audited fullyear consolidated financial statements as of December 31, 2025.
SANOFI
HALF-YEAR FINANCIAL REPORT 2026
Exhibit 99.1
- Condensed half-year consolidated financial statements
Consolidated balance sheets - equity and liabilities (Unaudited(1)) June 30, 2026
December 31, 2025
Equity attributable to equity holders of Sanofi
(€ million)
Note
69,207
71,376
Equity attributable to non-controlling interests
360
334
Total equity
B.8.
69,567
71,710
Long-term debt
B.9.
14,646
14,248
1,677
1,467
Non-current lease liabilities Non-current liabilities related to business combinations and to non-controlling interests
B.11.
652
585
Non-current provisions and other non-current liabilities
B.12.
6,848
6,703
2,187
2,081
Non-current income tax liabilities Deferred tax liabilities
1,553
1,666
Non-current liabilities
27,563
26,750
7,150
7,361
Accounts payable Current liabilities related to business combinations and to non-controlling interests
B.11.
Current provisions and other current liabilities Current income tax liabilities Current lease liabilities Short-term debt and current portion of long-term debt
B.9.
Liabilities related to assets held for sale Current liabilities Total equity and liabilities
—
—
16,446
15,565
884
751
227
272
7,026
4,342
197
54
31,930
28,345
129,060
126,805
The accompanying notes on pages 10 to 33 are an integral part of the condensed half-year consolidated financial statements.
(1)
These unaudited condensed half-year consolidated financial statements as of June 30, 2026 should be read in conjunction with Sanofi’s audited fullyear consolidated financial statements as of December 31, 2025.
SANOFI
HALF-YEAR FINANCIAL REPORT 2026
3
Exhibit 99.1
- Condensed half-year consolidated financial statements
Consolidated income statements (Unaudited(1))
(€ million)
Note
June 30, 2026 (6 months)
June 30, 2025 (6 months)
Net sales
B.20.
22,106
19,889
Other revenues
B.20.
1,438
1,452
Cost of sales
(6,155)
(5,881)
Gross profit
17,389
15,460
Research and development expenses
(3,980)
(3,717)
Selling and general expenses
(4,792)
(4,506)
Other operating income
B.15.
800
533
Other operating expenses
B.15.
(3,436)
(2,476)
Amortization of intangible assets
B.3.
(1,087)
(777)
Impairment of intangible assets
B.4.
(1,031)
(210)
Fair value remeasurement of contingent consideration
B.6. B.11.
(37)
(61)
Restructuring costs and similar items
B.16.
(563)
(430)
Other gains and losses, and litigation
B.17.
(95)
(57)
Operating income
3,168
3,759
Financial expenses
B.18.
(465)
(361)
Financial income
B.18.
137
184
2,840
3,582
(871)
(711)
Income before tax and investments accounted for using the equity method Income tax expense
B.19.
Share of profit/(loss) from investments accounted for using the equity method Net income from continuing operations Net income from discontinued operations
B.22.
Net income
2
85
1,971
2,956
26
2,881
1,997
5,837
Net income attributable to non-controlling interests
40
25
Net income attributable to equity holders of Sanofi
1,957
5,812 2.40
•
Basic earnings per share from continuing operations (€)
1.61
•
Basic earnings per share from discontinued operations (€)
0.02
2.34
1.63
4.74
Basic earnings per share (€)
B.8.7.
•
Diluted earnings per share from continuing operations (€)
1.60
2.39
•
Diluted earnings per share from discontinued operations (€)
0.02
2.33
1.62
4.72
Diluted earnings per share (€)
B.8.7.
The accompanying notes on pages 10 to 33 are an integral part of the condensed half-year consolidated financial statements.
(1)
4
These unaudited condensed half-year consolidated financial statements as of June 30, 2026 should be read in conjunction with Sanofi’s audited fullyear consolidated financial statements as of December 31, 2025.
SANOFI
HALF-YEAR FINANCIAL REPORT 2026
Exhibit 99.1
- Condensed half-year consolidated financial statements
Consolidated statements of comprehensive income (Unaudited(1)) June 30, 2026 (6 months)
June 30, 2025 (6 months)
Net income
1,997
5,837
Attributable to equity holders of Sanofi
1,957
5,812
Attributable to non-controlling interests
40
25
(€ million)
Note
Other comprehensive income: •
Actuarial gains/(losses)
B.8.8.
158
111
•
Change in fair value of equity instruments included in financial assets and financial liabilities
B.8.8.
175
222
•
Tax effects
B.8.8.
Subtotal: items not subsequently reclassifiable to profit or loss from continuing operations (A)
(43)
(92)
290
241
•
Change in fair value of debt instruments included in financial assets
B.8.8.
5
3
•
Change in fair value of cash flow hedges
B.8.8.
14
(23)
•
Change in currency translation differences
B.8.8.
1,313
(5,203)
•
Tax effects
B.8.8.
(5)
(95)
Subtotal: items subsequently reclassifiable to profit or loss from continuing operations (B)
1,327
(5,318)
Other comprehensive income/(loss) from continuing operations for the period, net of taxes (A+B)
1,617
(5,077)
Other comprehensive income/(loss) for the period from discontinued operations, net of taxes (C)
—
303
Comprehensive income
3,614
1,063
Attributable to equity holders of Sanofi
3,562
1,076
•
Continuing operations
3,536
(2,097)
•
Discontinued operations
26
3,173
52
(13)
Attributable to non-controlling interests
The accompanying notes on pages 10 to 33 are an integral part of the condensed half-year consolidated financial statements.
(1)
These unaudited condensed half-year consolidated financial statements as of June 30, 2026 should be read in conjunction with Sanofi’s audited fullyear consolidated financial statements as of December 31, 2025.
SANOFI
HALF-YEAR FINANCIAL REPORT 2026
5
Exhibit 99.1
- Condensed half-year consolidated financial statements
Consolidated statements of changes in equity (Unaudited(1))
Treasury shares
Reserves and retained earnings
Stock options and other sharebased payments
Other comprehensive income
Attributable to equity holders of Sanofi
Attributable to noncontrolling interests
Total equity
(€ million)
Share capital
Additional paid-in capital
Balance at January 1, 2025
2,526
—
(840)
68,185
5,260
2,376
77,507
350
77,857
Other comprehensive income for the period
—
—
—
243
—
(4,979)
(4,736)
(38)
(4,774)
Net income for the period
—
—
—
5,812
—
—
5,812
25
5,837
Comprehensive income for the period
—
—
—
6,055
—
(4,979)
1,076
(13)
1,063
Dividend paid out of 2024 earnings (€3.92 per share)
—
—
—
(4,772)
—
—
(4,772)
—
(4,772)
—
—
—
—
—
—
—
(32)
(32) (3,988)
Payment of dividends to noncontrolling interests
—
—
(3,988)
—
—
—
(3,988)
—
Reduction in share capital
(74)
—
3,868
(3,794)
—
—
—
—
—
Tax on share cancellations (b)
—
—
(15)
—
—
—
(15)
—
(15)
Share repurchase program
(a)
Share-based payment plans: •
Exercise of stock options
1
14
—
—
—
—
15
—
15
•
Issuance of restricted shares and vesting of existing restricted shares
3
(3)
—
—
—
—
—
—
—
•
Value of services obtained from employees
—
—
—
—
177
—
177
—
177
•
Tax effects of share-based payments
—
—
—
—
(7)
—
(7)
—
(7)
Other changes arising from issuance of restricted shares (c)
—
—
—
15
—
—
15
—
15
Changes in non-controlling interests (d)
—
—
—
—
—
—
—
(34)
(34)
Balance at June 30, 2025
2,456
11
(975)
65,689
5,430
(2,603)
70,008
271
70,279
Other comprehensive income for the period
—
—
—
(71)
—
160
89
(5)
84
Net income for the period
—
—
—
2,001
—
—
2,001
13
2,014
Comprehensive income for the period
—
—
—
1,930
—
160
2,090
8
2,098
Payment of dividends to noncontrolling interests
—
—
—
—
—
—
—
(12)
(12)
Share repurchase program (a)
—
—
(1,027)
—
—
—
(1,027)
—
(1,027)
Reduction in share capital
(22)
(170)
934
(742)
—
—
—
—
—
Tax on share cancellations (b)
—
—
(4)
—
—
—
(4)
—
(4)
Share-based payment plans: •
Exercise of stock options
—
—
—
—
—
—
—
—
—
•
Issuance of restricted shares and vesting of existing restricted shares
—
—
—
—
—
—
—
—
—
•
Employee share ownership plan
5
160
—
—
—
—
165
—
165
•
Value of services obtained from employees
—
—
—
—
142
—
142
—
142
•
Tax effects of share-based payments
—
—
—
—
—
—
—
—
—
—
—
—
—
—
—
—
68
68
2,439
1
(1,072)
66,877
5,572
(2,441)
71,376
334
71,710
Changes in non-controlling interests (d) Balance at December 31, 2025
(1)
6
These unaudited condensed half-year consolidated financial statements as of June 30, 2026 should be read in conjunction with Sanofi’s audited fullyear consolidated financial statements as of December 31, 2025.
SANOFI
HALF-YEAR FINANCIAL REPORT 2026
Exhibit 99.1
- Condensed half-year consolidated financial statements
(€ million)
Share capital
Additional paid-in capital
Balance at January 1, 2026
Treasury shares
Reserves and retained earnings
Stock options and other sharebased payments
Other comprehensive income
Attributable to equity holders of Sanofi
Attributable to noncontrolling interests
Total equity
2,439
1
(1,072)
66,877
5,572
(2,441)
71,376
334
71,710
Other comprehensive income for the period
—
—
—
290
—
1,315
1,605
12
1,617
Net income for the period
—
—
—
1,957
—
—
1,957
40
1,997
Comprehensive income for the period
—
—
—
2,247
—
1,315
3,562
52
3,614
Dividend paid out of 2025 earnings (€4.12 per share)
—
—
—
(4,923)
—
—
(4,923)
—
(4,923)
Payment of dividends to noncontrolling interests
—
—
—
—
—
—
—
(26)
(26)
Share repurchase program (a)
—
—
(1,003)
—
—
—
(1,003)
—
(1,003)
Reduction in share capital
(a)
(15)
—
596
(581)
—
—
—
—
—
Tax on share cancellations (b)
—
—
(3)
—
—
—
(3)
—
(3)
Share-based payment plans: •
Exercise of stock options
—
3
—
—
—
—
3
—
3
•
Issuance of restricted shares and vesting of existing restricted shares (a)
4
(4)
102
(102)
—
—
—
—
—
•
Value of services obtained from employees
—
—
—
—
184
—
184
—
184
•
Tax effects of share-based payments
—
—
—
—
1
—
1
—
1
Other changes arising from issuance of restricted shares (c)
—
—
—
10
—
—
10
—
10
2,428
—
(1,380)
63,528
5,757
(1,126)
69,207
360
69,567
Balance at June 30, 2026
(a) See Note B.8.2 and B.8.3. (for amounts relating to 2025, see Note D.15.4. to the consolidated financial statements for the year ended December 31, 2025). (b) Reflects new regulations implemented on the taxation of share cancellations in Article 95 of the French Finance Bill for 2025. (c) This line comprises the impact of the issuance of restricted shares to former employees of Opella subsequent to the date on which Sanofi lost control of Opella. (d) This line mainly comprises changes in non-controlling interests arising from divestments and acquisitions.
The accompanying notes on pages 10 to 33 are an integral part of the condensed half-year consolidated financial statements.
SANOFI
HALF-YEAR FINANCIAL REPORT 2026
7
Exhibit 99.1
- Condensed half-year consolidated financial statements
Consolidated statement of cash flows (Unaudited(1)) (€ million)
Note
June 30, 2026 (6 months)
June 30, 2025 (6 months)
Net income attributable to equity holders of Sanofi
1,957
5,812
Net (income)/loss from the discontinued Opella business
(26)
(2,881)
Non-controlling interests
40
25
Share of undistributed earnings from investments accounted for using the equity method
94
(15)
2,880
1,779
Depreciation, amortization and impairment of property, plant and equipment, right-of-use assets and intangible assets Gains and losses on disposals of non-current assets, net of tax
(9)
(266)
Net change in deferred taxes
(218)
(539)
Net change in non-current provisions and other non-current liabilities (b)
195
(212)
Cost of employee benefits (stock options and other share-based payments)
184
171
Impact of the workdown of acquired inventories remeasured at fair value
210
—
Other profit or loss items with no cash effect on cash flows generated by operating activities (c)
(74)
106
Operating cash flow before changes in working capital
5,233
3,980
(Increase)/decrease in inventories
(958)
(635)
(Increase)/decrease in accounts receivable
(27)
(785)
Increase/(decrease) in accounts payable
(340)
187
Net change in other current assets and other current liabilities
735
620
Net cash provided by/(used in) continuing operating activities
4,643
3,367
(a)
—
188
4,643
3,555
B.2. - B.3.
(1,296)
(1,420)
B.1.
(1,408)
(538)
Net cash provided by/(used in) operating activities of the discontinued Opella business Net cash provided by/(used in) operating activities (d) Acquisitions of property, plant and equipment and intangible assets Acquisitions of consolidated undertakings and investments accounted for using the equity method (e) Acquisitions of other equity investments
(189)
(423)
Proceeds from disposals of property, plant and equipment, intangible assets and other noncurrent assets, net of tax (f)
424
434
Disposals of consolidated undertakings and investments accounted for using the equity method, net of tax
78
—
Net change in other non-current assets Net cash provided by/(used in) continuing investing activities Net cash provided by/(used in) investing activities of the discontinued Opella business Net cash inflow/(outflow) from the Opella transaction (g) Net cash provided by/(used in) investing activities Issuance of Sanofi shares
B.8.1.
(32)
(32)
(2,423)
(1,979)
—
(36)
(220)
10,742
(2,643)
8,727
18
29 (4,772)
Dividends paid: •
to equity holders of Sanofi
(4,923)
•
to non-controlling interests
(25)
(27)
Additional long-term debt contracted
B.9.1.
2,304
2,993
Repayments of long-term debt
B.9.1.
(1,505)
(1,859)
Repayment of lease liabilities
(147)
(124)
Net change in short-term debt and other financial instruments (h)
1,955
3,322
(1,009)
(4,003)
(3,332)
(4,441)
Acquisitions of treasury shares and related tax effect
B.8.2
Net cash provided by/(used in) continuing financing activities Net cash provided by/(used in) financing activities of the discontinued Opella business Net cash provided by/(used in) financing activities
—
(48)
(3,332)
(4,489)
Impact of exchange rates on cash and cash equivalents
19
(42)
Cash and cash equivalents reclassified to Assets held for sale as of December 31, 2024
—
167
(1,313)
7,918
Net change in cash and cash equivalents Cash and cash equivalents, beginning of period
(i)
Cash and cash equivalents, end of period (1)
8
B.9.
7,663
7,441
6,350
15,359
These unaudited condensed half-year consolidated financial statements as of June 30, 2026 should be read in conjunction with Sanofi’s audited fullyear consolidated financial statements as of December 31, 2025.
SANOFI
HALF-YEAR FINANCIAL REPORT 2026
Exhibit 99.1
- Condensed half-year consolidated financial statements
(a) Includes non-current financial assets and deferred taxes, amounting to zero as of June 30, 2026 and to €48 million as of June 30, 2025. (b) This line item includes contributions paid to pension funds (see Note B.12.). (c) This line item mainly comprises unrealized foreign exchange gains and losses arising on the remeasurement of monetary items in non-functional currencies and on instruments used to hedge such items. (d) Of which: June 30, 2026 (6 months)
June 30, 2025 (6 months)
•
Income tax paid
(925)
(1,355)
•
Interest paid
(260)
(206)
•
Interest received
111
170
•
Dividends received from non-consolidated entities
3
5
(e) This line item includes payments made in respect of contingent consideration identified and recognized as a liability in business combinations. For the six months ended June 30, 2026, this line item includes the net cash outflow arising from the acquisition of Dynavax (see Note B.1.1.). For the six months ended June 30, 2025 it includes the net cash outflow arising from the acquisition of Dren-0201. (f) For the six months ended June 30, 2026 and June 30, 2025, this line item mainly comprises proceeds from disposals of (i) assets and businesses due to portfolio rationalization, and (ii) equity and debt instruments. (g) For the six months ended June 30, 2025, this amount includes €(667) million in respect of cash and cash equivalents held by Opella as of April 30, 2025. (h) For the six months ended June 30, 2026, this line item mainly comprises (i) a commercial paper program in the United States for €2,388 million and (ii) a cash outflow of €249 million arising from the settlement of the financial liabilities of Dynavax, acquired on February 10, 2026 (see Note B.1.1.). For the six months ended June 30, 2025, this line item mainly comprises a commercial paper program in the United States for €3,353 million. (i) Includes the impact of the IFRS 9 amendment relating to the classification of financial instruments applicable from January 1, 2026.
SANOFI
HALF-YEAR FINANCIAL REPORT 2026
9
Exhibit 99.1
- Condensed half-year consolidated financial statements
Notes to the condensed half-year consolidated financial statements as of June 30, 2026 (Unaudited(1))
Introduction Sanofi, together with its subsidiaries (collectively “Sanofi”, “the Group” or “the Company”), is a global healthcare leader engaged in the research, development and marketing of therapeutic solutions focused on patient needs. Sanofi is listed in Paris (Euronext: SAN) and New York (Nasdaq: SNY). The condensed consolidated financial statements for the six months ended June 30, 2026 were reviewed by the Sanofi Board of Directors at the Board meeting on July 29, 2026.
A/ Basis of preparation of the half-year financial statements and accounting policies A.1. International financial reporting standards (IFRS) The half-year consolidated financial statements have been prepared and presented in condensed format in accordance with IAS 34 (Interim Financial Reporting). The accompanying notes therefore relate to significant events and transactions of the period, and should be read in conjunction with the consolidated financial statements for the year ended December 31, 2025. The accounting policies used in the preparation of the consolidated financial statements as of June 30, 2026 comply with international financial reporting standards (IFRS) as endorsed by the European Union and as issued by the International Accounting Standards Board (IASB). IFRS as endorsed by the European Union as of June 30, 2026 are available via the following web link: https://www.efrag.org/en/financial-reporting/endorsement-status. The accounting policies applied effective January 1, 2026 are identical to those presented in the consolidated financial statements for the year ended December 31, 2025. On May 30, 2024, the IASB issued amendments to IFRS 9 and IFRS 7 relating to the classification and measurement of financial instruments, applicable from January 1, 2026. The amendments did not have a material impact on the financial statements. On July 18, 2024, the IASB issued Volume 11 of “Annual Improvements to IFRS”, applicable from January 1, 2026. Those improvements to various standards, which are essentially in the nature of clarifications, did not have a material impact on the financial statements. On December 18, 2024, the IASB issued "Contracts referencing nature-dependent electricity", amendments to IFRS 9 and IFRS 7, applicable from January 1, 2026. The amendments could potentially result in an enhancement of the disclosures provided in the 2026 annual financial statements. As a reminder, renewable energy purchase contracts entered into by Sanofi as of December 31, 2025 are described in Note D.21. to the consolidated financial statements included in Sanofi’s Form 20-F for the year ended December 31, 2025 (the “2025 20-F”). In its 2026 half-year financial statements, Sanofi has used an average effective tax rate that takes into account the Pillar Two top-up tax applicable from January 1, 2024. As in the previous year, the effective tax rate also includes a one-off impact from the 2025 component of the exceptional surcharge in respect of French corporate income taxes (see Note B.19.).
A.2. Use of estimates and judgments The preparation of financial statements requires management to make reasonable estimates and assumptions based on information available at the date the financial statements are finalized. Those estimates and assumptions may affect the reported amounts of assets, liabilities, revenues and expenses in the financial statements, and disclosures of contingent assets and contingent liabilities as of the date of the review of the financial statements. Examples of estimates and assumptions include: • • • •
amounts deducted from sales for projected sales returns, chargeback incentives, rebates and price reductions; impairment of property, plant and equipment and intangible assets; the valuation of goodwill and the valuation and useful life of acquired intangible assets; and the amount of liabilities or provisions for restructuring, litigation, tax risks relating to corporate income taxes, and environmental risks.
Actual results could differ from these estimates. For half-year financial reporting purposes, and as allowed under IAS 34, Sanofi has determined income tax expense on the basis of an estimate of the effective tax rate for the full financial year. That rate is applied to business operating income plus financial income and minus financial expenses, and before (i) the share of profit/loss of investments accounted for using the equity
(1)
These unaudited condensed half-year consolidated financial statements as of June 30, 2026 should be read in conjunction with Sanofi’s audited fullyear consolidated financial statements as of December 31, 2025.
10
SANOFI
HALF-YEAR FINANCIAL REPORT 2026
Exhibit 99.1
- Condensed half-year consolidated financial statements
method and (ii) net income attributable to non-controlling interests. The estimated full-year effective tax rate is based on the tax rates that will be applicable to projected pre-tax profits or losses arising in the various tax jurisdictions in which Sanofi operates.
A.3. Seasonal trends Sanofi’s activities are not subject to significant seasonal fluctuations.
A.4. Consolidation and foreign currency translation of the financial statements of subsidiaries in hyperinflationary economies In 2026, Sanofi continues to account for subsidiaries based in Venezuela using the full consolidation method, on the basis that the criteria for control as specified in IFRS 10 (Consolidated Financial Statements) are still met. The contribution of the Venezuelan subsidiaries to the consolidated financial statements is immaterial. In Argentina, the cumulative rate of inflation over the last three years is in excess of 100%, based on a combination of indices used to measure inflation in that country. Consequently, Sanofi has (since July 1, 2018) treated Argentina as a hyperinflationary economy and has applied IAS 29. The impact of the resulting restatements is immaterial at Sanofi group level. In Turkey, the cumulative rate of inflation over the last three years is in excess of 100%, based on a combination of indices used to measure inflation in that country. Consequently, Sanofi has (since January 1, 2022) treated Turkey as a hyperinflationary economy and has applied IAS 29. The impact of the resulting restatements is immaterial at Sanofi group level.
A.5. Fair value of financial instruments Under IFRS 13 (Fair Value Measurement) and IFRS 7 (Financial Instruments: Disclosures), fair value measurements must be classified using a hierarchy based on the inputs used to measure the fair value of the instrument. This hierarchy has three levels: • Level 1: quoted prices in active markets for identical assets or liabilities (without modification or repackaging); • Level 2: quoted prices in active markets for similar assets or liabilities, or valuation techniques in which all important inputs are derived from observable market data; and • Level 3: valuation techniques in which not all important inputs are derived from observable market data.
SANOFI
HALF-YEAR FINANCIAL REPORT 2026
11
Exhibit 99.1
- Condensed half-year consolidated financial statements
The table below shows the disclosures required under IFRS 7 relating to the measurement principles applied to financial instruments. Method used to determine fair value
Type of financial Note instrument
Level in Measurement fair value principle hierarchy
Market data Valuation technique
Valuation model
Exchange rate
Interest rate
Volatilities
B.6.
Financial assets measured at fair value (quoted equity instruments)
Fair value
1
Market value
Quoted market price
N/A
B.6.
Financial assets measured at fair value (quoted debt instruments)
Fair value
1
Market value
Quoted market price
N/A
B.6.
Financial assets measured at fair value (unquoted equity instruments)
Fair value
3
Amortized cost/ Peer comparison (primarily)
If cost ceases to be a representative measure of fair value, an internal valuation based primarily on peer comparison is used.
B.6.
Financial assets measured at fair value (contingent consideration receivable)
Fair value
3
Revenuebased approach
The fair value of contingent consideration receivable is determined by adjusting the contingent consideration at the end of the reporting period using the method described in Note D.7.3. to the consolidated financial statements for the year ended December 31, 2025.
B.6.
Long-term loans and advances and other noncurrent receivables
Amortized cost
N/A
N/A
B.6.
Financial assets measured at fair value held to meet obligations under post-employment benefit plans
Fair value
1
Market value
Quoted market price
N/A
B.6.
Financial assets designated at fair value held to meet obligations under deferred compensation plans
Fair value
1
Market value
Quoted market price
N/A
B.9.
Investments in mutual funds
Fair value
1
Market value
Net asset value
N/A
B.9.
Negotiable debt instruments, commercial paper, instant access deposits and term deposits
Amortized cost
N/A
N/A
Because these instruments have a maturity of less than 3 months, amortized cost is regarded as an acceptable approximation of fair value as disclosed in the notes to the consolidated financial statements.
The amortized cost of long-term loans and advances and other noncurrent receivables at the end of the reporting period is not materially different from their fair value.
B.9. B.12.
Financial liabilities
Amortized cost (a)
N/A
N/A
In the case of financial liabilities with a maturity of less than 3 months, amortized cost is regarded as an acceptable approximation of fair value as reported in the notes to the consolidated financial statements. For financial liabilities with a maturity of more than 3 months, fair value as reported in the notes to the consolidated financial statements is determined either by reference to quoted market prices at the end of the reporting period (quoted instruments) or by discounting the future cash flows based on observable market data at the end of the reporting period (unquoted instruments). For financial liabilities based on variable payments such as royalties, fair value is determined on the basis of discounted cash flow projections.
B.9.
Lease liabilities
Amortized cost
N/A
N/A
Future lease payments are discounted using the incremental borrowing rate.
B.10.
Forward currency contracts
Fair value
2
Revenuebased approach
Present value of future cash flows
Mid Market Spot
< 1 year: Mid Money Market
1 year: Mid Zero Coupon
N/A
B.10.
Interest rate swaps
Fair value
2
Revenuebased approach
Present value of future cash flows
Mid Market Spot
< 1 year: Mid Money Market and Euronext interest rate futures
1 year: Mid Zero Coupon
N/A
B.10.
Cross-currency swaps
Fair value
2
Revenuebased approach
Present value of future cash flows
Mid Market Spot
< 1 year: Mid Money Market and Euronext interest rate futures
1 year: Mid Zero Coupon
N/A
B.11.
Liabilities related to business combinations and to non-controlling interests
Fair value
3
Revenuebased approach
Under IAS 32, contingent consideration payable in a business combination is a financial liability. The fair value of such liabilities is determined by adjusting the contingent consideration at the end of the reporting period using the method described in Note B.11.
(a) In the case of debt designated as a hedged item in a fair value hedging relationship, the carrying amount in the consolidated balance sheet includes changes in fair value attributable to the hedged risk(s).
12
SANOFI
HALF-YEAR FINANCIAL REPORT 2026
Exhibit 99.1
- Condensed half-year consolidated financial statements
A.6. New pronouncements issued by the IASB and applicable from 2027 On April 9, 2024, the IASB issued IFRS 18 (Presentation and Disclosure in Financial Statements), applicable from January 1, 2027. In terms of adapting Sanofi’s chart of accounts and financial information systems, the transition is continuing on schedule. In line with the information communicated in the 2025 financial statements as published, Sanofi’s IFRS 18 rollout project – which began in the fourth quarter of 2025 – is progressing, and the impact analysis has evolved in line with the schedule. The future structure of Sanofi’s consolidated income statement will present operating expenses by function, and will reflect presentational choices based on the “useful structured summary” principle established by IFRS 18. Those choices involve the classification of income statement items according to five categories (operating, investing, financing, income tax and discontinued operations), with the sub-totals limited solely to those specified in IFRS 18. The income statement structure will also reflect the fact that Sanofi as a whole operates a single principal activity. As regards the requirement to disclose alternative management performance measures (MPMs) that meet the IFRS 18 definition in the notes to the financial statements, Sanofi has identified the relevant MPMs. In accordance with the information communicated in Sanofi’s 2025 consolidated financial statements, the main MPMs are “Business gross profit”, “Business operating income” and “Business net income”, all of which are non-IFRS measures that Sanofi currently uses in its financial communication. No significant impact on these performance measures has been identified at this stage. The transition note intended for publication in Sanofi’s 2026 Annual Report on Form 20-F will include a reconciliation, for the comparative years 2026 and 2025, between (i) the amounts for each income statement line item presented in accordance with IFRS 18 as applicable from 2027 and (ii) those presented in accordance with the currently applicable standard (IAS 1). Furthermore, the presentation of the consolidated statement of cash flows will be modified such that it starts from Operating income instead of Net income attributable to equity holders of Sanofi. Finally, as mentioned in Sanofi’s 2025 year-end financial communications, Sanofi is not early adopting IFRS 18. On November 13, 2025, the IASB issued “Translation to a Hyperinflationary Presentation Currency”, an amendment to IAS 21 (The Effects of Changes in Foreign Exchange Rates), applicable from January 1, 2027 (subject to endorsement by the European Union). Sanofi does not expect any material impact and will not early adopt this amendment.
B/ Significant information for the first half of 2026 B.1. Significant transactions for the first half of 2026 B.1.1. Acquisition of Dynavax Technologies Corporation On February 10, 2026, Sanofi finalized the acquisition of Dynavax Technologies Corporation (Dynavax), a vaccines company with a marketed adult hepatitis B vaccine (HEPLISAV-B) and a differentiated shingles vaccine candidate. The acquisition augments Sanofi’s presence in adult immunization by bringing together Dynavax’s vaccines with Sanofi’s global scale, development capabilities and commercial reach. Dynavax’s adult hepatitis B vaccine HEPLISAV-B is currently marketed in the United States and is differentiated by its two-dose regimen over one month, enabling high levels of seroprotection faster than other hepatitis B vaccines (which are given in three doses over six months). The acquisition also includes Dynavax’s shingles vaccine candidate (Z-1018), which is currently in phase 1/2 clinical development, and additional vaccine pipeline projects. The transaction involved a cash tender offer by Sanofi to acquire all outstanding shares of Dynavax for $15.50 per share in cash, reflecting a total equity value on a fully diluted basis of approximately $2.2 billion, including the subsequent reimbursement of the short-term debt for $0.3 billion. The provisional purchase price allocation led to the recognition of €204 million of goodwill, determined as follows: (€ million)
Fair value at acquisition date
Other intangible assets
1,150
Other current and non-current assets and liabilities
429
Cash and cash equivalents
169
Short-term debt
(249)
Deferred taxes, net
(132)
Net assets of Dynavax
1,367
Goodwill
204
Purchase price
1,571
“Other intangible assets” mainly comprise Dynavax’s marketed vaccine HEPLISAV-B.
SANOFI
HALF-YEAR FINANCIAL REPORT 2026
13
Exhibit 99.1
- Condensed half-year consolidated financial statements
Goodwill mainly represents the effects of expected future synergies and other benefits to be derived from the integration of Dynavax into the Sanofi group. The goodwill generated on this acquisition does not give rise to any deduction for income tax purposes. Dynavax's contributions to Biopharma segment net sales and business operating income (for a definition refer to Note B.21. “Segment Information”) since the acquisition date amount to €144 million and €89 million, respectively. Over the same period, Dynavax made a negative contribution of €63 million to consolidated net income, including amortization of intangible assets of €38 million; amortization and expenses arising from the impact of acquired inventories of €44 million; and restructuring costs and similar items of €63 million. The impact of this acquisition, as reflected within the line item Acquisitions of consolidated undertakings and investments accounted for using the equity method in the consolidated statement of cash flows, is a net cash outflow of €1,403 million.
B.1.2. Proposed divestment of Medley, Sanofi’s Brazilian generics business On March 6, 2026, Sanofi and EMS Group, a major pharmaceutical conglomerate in Brazil, announced the signing of a definitive agreement for the purchase and sale of 100% of Medley, one of Brazil’s leading generic drug brands. With effect from that date, given that completion of the transaction is considered highly probable, all of the assets of Medley, and the liabilities directly associated with those assets (subsequently transferred to Medley Farmaceutica Ltda, a new legal entity formed on May 1, 2026, the equity interests in which will be divested), are presented in the consolidated balance sheet within the line items Assets held for sale and Liabilities related to assets held for sale, in accordance with IFRS 5 (Non-Current Assets Held for Sale and Discontinued Operations); they are the main component of those line items as of June 30, 2026. Sanofi’s Brazilian generics business does not meet the definition of a discontinued operation under IFRS 5 (see Note B.7. to the consolidated financial statements for the year ended December 31, 2025), as a result of which the net income from this business is not presented separately in the income statement. A net gain is expected upon closing of the transaction. Consequently, no impairment was recognized on the carrying amount of the net assets of Medley Farmaceutica Ltda as of the date of reclassification as held for sale. The transaction is expected to close no earlier than the fourth quarter of 2026 subject to the fulfilment of customary closing conditions, primarily clearance from the Brazilian Antitrust Authority (Administrative Council for Economic Defense – CADE).
B.2. Property, plant and equipment The table below sets forth acquisitions and capitalized interest by operating segment for the first half of 2026: June 30, 2026 June 30, 2025
(€ million) Acquisitions
763
702
Biopharma
763
663
594
453
Opella (discontinued operation)
—
39
Of which capitalized interest
23
22
Of which Manufacturing & Supply
Firm orders for property, plant and equipment stood at €1,336 million as of June 30, 2026.
B.3. Goodwill and other intangible assets Goodwill amounted to €41,954 million as of June 30, 2026, versus €41,300 million as of December 31, 2025. The movement during the period reflects the impact of changes in exchange rates and the recognition of the goodwill arising on the Dynavax acquisition (see note B.1.1.), partially offset by the reclassification of the goodwill relating to the Brazilian generics business to Assets held for sale as a result of the proposed divestment (see note B.1.2.). Movements in other intangible assets during the first half of 2026 were as follows:
14
SANOFI
HALF-YEAR FINANCIAL REPORT 2026
Exhibit 99.1
- Condensed half-year consolidated financial statements
(€ million)
Acquired R&D
Products, trademarks and other rights
Software
Total other intangible assets
14,951
66,746
1,888
83,585
Changes in scope of consolidation (a)
—
1,149
1
1,150
Acquisitions and other increases
321
122
88
531
Disposals and other decreases
(534)
(17)
(28)
(579)
Currency translation differences
324
1,232
12
1,568
Transfers (b)
(245)
(162)
(4)
(411)
Gross value at January 1, 2026
Gross value at June 30, 2026
14,817
69,070
1,957
85,844
Accumulated amortization and impairment at January 1, 2026
(6,220)
(49,624)
(1,480)
(57,324)
—
(1,106)
(58)
(1,164)
Impairment losses, net of reversals (c)
Amortization expense
(970)
(61)
(17)
(1,048)
Disposals and other decreases
534
17
26
577
Currency translation differences
(135)
(785)
(10)
(930)
—
400
4
404
(6,791)
(51,159)
(1,535)
(59,485)
Carrying amount at January 1, 2026
8,731
17,122
408
26,261
Carrying amount at June 30, 2026
8,026
17,911
422
26,359
Transfers (b) Accumulated amortization and impairment at June 30, 2026
(a) The “Changes in scope of consolidation” line mainly comprises the intangible assets recognized as part of the Dynavax acquisition (see Note B.1.) (b) The “Transfers” line mainly comprises (i) acquired R&D that came into commercial use during the period and (ii) reclassifications of assets to Assets held for sale. (c) See Note B.4.
“Products, trademarks and other products” mainly comprise: • marketed products, with a carrying amount of €17.1 billion as of June 30, 2026 (versus €16.2 billion as of December 31, 2025) and a weighted average amortization period of approximately 11 years; and • technological platforms brought into service, with a carrying amount of €0.8 billion as of June 30, 2026 (versus €0.9 billion as of December 31, 2025) and a weighted average amortization period of approximately 18 years.
B.4. Impairment of intangible assets The monitoring of impairment indicators for other intangible assets (excluding software) led to the recognition of impairment losses of €1,031 million in the first half of 2026, mainly comprising a €952 million impairment loss taken against the amlitelimab asset, corresponding to the entire carrying amount of this intangible asset.
B.5. Investments accounted for using the equity method Investments accounted for using the equity method consist of associates and joint ventures (see Note B.1. to the consolidated financial statements for the year ended December 31, 2025), and comprise: (€ million)
% interest
June 30, 2026
December 31, 2025
48.2
2,965
2,934
EUROAPI (b)
29.6
38
64
Infraserv GmbH & Co. Höchst KG (c)
31.2
93
112
MSP Vaccine Company (d)
50.0
52
59
—
59
90
3,207
3,259
OPAL JV Co
(a)
Other investments Total
(a) Following the loss of control of Opella in 2025, Sanofi holds 48.2% of OPAL JV Co (CD&R holds 50% and Bpifrance holds 1.8%). As of December 31, 2025 the investment included a €241 million loan to OPAL JV Co being in substance part of the investment. In 2026, following finalization of the Opella completion accounts as of April 30, 2025, this loan was converted into ordinary shares. (b) The investment in EUROAPI includes an impairment loss determined by reference to the quoted market price (€1.33 as of June 30, 2026, and €2.27 as of December 31, 2025). (c) Joint venture. (d) Joint venture. MSP Vaccine Company owns 100% of MCM Vaccine BV.
Share of profit/(loss) from investments accounted for using the equity method showed net income of €2 million for the first half of 2026 (including a net loss of €39 million for Sanofi’s share of losses from the associate OPAL JV Co), versus net income of €85 million for the first half of 2025 (including net income of €11 million for Sanofi’s share of profits from the associate OPAL JV Co for the period from May 1, 2025 through June 30, 2025).
SANOFI
HALF-YEAR FINANCIAL REPORT 2026
15
Exhibit 99.1
- Condensed half-year consolidated financial statements
The financial statements include commercial transactions between Sanofi and some equity-accounted investments that are classified as related parties. The principal transactions and balances with related parties are summarized below: (€ million)
June 30, 2026
June 30, 2025
31
29
Sales (c) Royalties and other income
142
63
548
371
(c)
Purchases of goods and services (including research expenses) (c)
June 30, 2026 December 31, 2025
(€ million) Accounts receivable and other receivables (a)
430
Other assets (b)
84
143
Other liabilities
379
710
588
(a) Includes loans to joint ventures and associates. (b) In October 2024, Sanofi raised its investment in EUROAPI by €200 million in the form of a perpetual subordinated hybrid bond. The fair value of this investment as of June 30, 2026 was €84 million, versus €143 million as of December 31, 2025. (c) For the six months ended June 30, 2025, these amounts include transactions between Sanofi and OPAL JV Co for the period from May 1, 2025 through June 30, 2025.
Key items from the unaudited half-year consolidated financial statements of OPAL JV Co as of June 30, 2026, as provided in accordance with Sanofi’s consolidation timelines, are presented below: (€ million)
June 30, 2026
June 30, 2025
2,657
887
(61)
24
Consolidated income statement Net sales and other revenues (a) Net income
(a)
Consolidated statement of comprehensive income Other comprehensive income
83
(1)
Comprehensive income
22
23
(a) With effect from May 1, 2025, OPAL JV Co is accounted for using the equity method following the loss of control of Opella by Sanofi on April 30, 2025.
(€ million)
June 30, 2026
December 31, 2025
Consolidated balance sheet Non-current assets
16,673
15,013
Current assets
2,925
2,859
Total assets
19,598
17,872
Equity attributable to equity holders of OPAL JV Co
5,958
5,380
Equity attributable to non-controlling interests
436
490
Total equity
6,394
5,870
Non-current liabilities
11,575
9,850
Current liabilities
1,629
2,152
Total liabilities
13,204
12,002
Total equity and liabilities
19,598
17,872
June 30, 2026
December 31, 2025
2,435
2,200
B.6. Other non-current assets Other non-current assets comprise: (€ million) Equity instruments at fair value through other comprehensive income Debt instruments at fair value through other comprehensive income
363
389
Other financial assets at fair value through profit or loss
1,099
1,004 194
Pre-funded pension obligations
203
Long-term prepaid expenses
185
175
Long-term loans and advances and other non-current receivables
421
393
Derivative financial instruments
26
9
4,732
4,364
Total
16
SANOFI
HALF-YEAR FINANCIAL REPORT 2026
Exhibit 99.1
- Condensed half-year consolidated financial statements
B.7. Accounts receivable Accounts receivable break down as follows: June 30, 2026
December 31, 2025
Gross value
8,818
8,510
Allowances
(104)
(100)
Carrying amount
8,714
8,410
(€ million)
The impact of allowances against accounts receivable in the first half of 2026 was a net expense of €6 million (versus a net expense of €4 million for the first half of 2025). The table below shows the ageing profile of overdue accounts receivable, based on gross value: Overdue accounts gross value
Overdue by <1 month
Overdue by 1-3 months
Overdue by 3-6 months
Overdue by 6-12 months
Overdue by
12 months
June 30, 2026
522
183
127
142
27
43
December 31, 2025
468
184
134
71
27
52
(€ million)
Amounts overdue by more than one month relate mainly to public-sector customers. Some Sanofi subsidiaries have assigned receivables to factoring companies or banks without recourse. The amount of receivables that met the conditions described in Note B.8.6. to the consolidated financial statements for the year ended December 31, 2025 and hence were derecognized was €11 million as of June 30, 2026 (versus zero as of December 31, 2025). The residual guarantees relating to those transfers were immaterial as of June 30, 2026.
B.8. Consolidated shareholders’ equity B.8.1. Share capital As of June 30, 2026, the share capital was €2,428,198,054 and consisted of 1,214,099,027 shares (the total number of shares outstanding) with a par value of €2. Treasury shares held by Sanofi are as follows: Number of shares (million)
% of share capital for the period
June 30, 2026
16.03
1.320%
December 31, 2025
11.96
0.981%
June 30, 2025
10.66
0.868%
January 1, 2025
9.53
0.755%
A total of 30,070 shares were issued in the first half of 2026 as a result of the exercise of Sanofi stock subscription options. In addition, 3,072,520 shares vested under Sanofi restricted share plans during the first half of 2026, of which 1,886,523 were fulfilled by issuance of new shares and 1,185,997 by allotment of existing shares free of charge.
B.8.2. Repurchase of Sanofi shares On April 30, 2025, the Annual General Meeting of Sanofi shareholders authorized a share repurchase program for a period of 18 months. Under that program, Sanofi repurchased 12,571,455 of its own shares during the first half of 2026 for a total amount of €1,003 million. During the meeting of the Board of Directors on January 29, 2025, the Board authorized Sanofi to repurchase the Company's shares, for an amount not exceeding €5 billion, under the terms and conditions set by the General Meeting of April 30, 2024 in its 19th resolution. As part of this authorization, Sanofi entered into a share buyback agreement with its historical shareholder L'Oréal on February 2, 2025 for the acquisition of 2.34% of Sanofi’s share capital, equivalent to 29,556,650 shares, for a total amount of approximately €3 billion, representing a price of €101.50 per share. The conclusion of that agreement was approved by the Board of Directors on the same day prior to the signing of the agreement, and in accordance with the procedure set forth in Articles L. 225-38 et seq. of the French Commercial Code. On April 29, 2026, the Annual General Meeting of Sanofi shareholders authorized a share repurchase program for a period of 18 months. Sanofi did not use that authorization during the first half of 2026.
B.8.3. Reduction in share capital During the first half of 2026, treasury shares amounting to €596 million were cancelled further to decisions taken by the Sanofi Board of Directors on March 4, 2026. Those reductions have no impact on shareholders’ equity, except for the impact of the tax on share cancellations.
SANOFI
HALF-YEAR FINANCIAL REPORT 2026
17
Exhibit 99.1
- Condensed half-year consolidated financial statements
B.8.4. Restricted share plans Restricted share plans are accounted for in accordance with the policies described in Note B.24.3. to the consolidated financial statements for the year ended December 31, 2025. The principal features of the plans awarded in 2026 are set forth below: 2026 Type of plan
Performance share plan
Date of Board meeting approving the plan
April, 29, 2026
Date of Board meeting approving the plans awarded to the Chief Executive Officer
May 1, 2026
Total number of shares subject to a 3-year service period
5,087,518
Of which with no market condition
3,367,862
Fair value per share awarded (a)
€65.86
Of which with market conditions
1,719,656
Fair value per share awarded other than to the Chief Executive Officer (1,674,656 shares in total) (b) Fair value per share awarded to the Chief Executive Officer (45,000 shares)
€57.99 €53.46
(b)
Total number of shares subject to a 5-year service period
180,000
Fair value per share awarded to the Chief Executive Officer (180,000 shares) (c)
€40.46
Fair value of plans at the date of grant (€ million)
329
(a) Quoted market price per share at the date of grant, adjusted for dividends expected during the vesting period. (b) Weighting between (i) fair value determined using the Monte Carlo model and (ii) market price of Sanofi shares at the date of grant, adjusted for dividends expected during the vesting period of 3 years. (c) Weighting between (i) fair value determined using the Monte Carlo model and (ii) market price of Sanofi shares at the date of grant, adjusted for dividends expected during the vesting period of 5 years.
The total expense recognized for all restricted share plans, and the number of restricted shares not yet fully vested, are shown in the table below: June 30, 2026 Total expense for restricted share plans (€ million) Number of shares not yet fully vested
June 30, 2025
138
146
12,995,668
11,550,347
Under 2026 plans
5,267,518
—
Under 2025 plans
3,897,342
4,020,451
Under 2024 plans
3,772,461
4,110,089
Under 2023 plans
58,347
3,313,588
Under 2022 plans
—
106,219
B.8.5. Employee stock purchase plans On January 28, 2026, the Sanofi Board of Directors approved an employee stock purchase plan, offering employees the opportunity to subscribe for new Sanofi shares at a price of €59.87 per share. The subscription period was open from June 9 through June 29, 2026. Sanofi employees subscribed for a total of 2,431,494 shares, and the resulting capital increase was supplemented by the immediate issuance of a further 104,327 shares for the employer’s contribution. The total expense recognized for this plan in the first half of 2026 was €46 million, determined in accordance with IFRS 2 (Share-Based Payment) on the basis of the discount granted to the employees. On January 29, 2025, the Sanofi Board of Directors approved an employee stock purchase plan, offering employees the opportunity to subscribe for new Sanofi shares at a price of €72.97 per share. The subscription period was open from June 10 through June 30, 2025. Sanofi employees subscribed for a total of 2,260,776 shares, and the resulting capital increase was supplemented by the immediate issuance of a further 116,794 shares for the employer’s contribution. The total expense recognized for this plan in the first half of 2025 was €31 million, determined in accordance with IFRS 2 (Share-Based Payment) on the basis of the discount granted to the employees.
B.8.6. Stock subscription option plans No stock subscription option plans were awarded in the first half of 2026 or in 2025. No further stock option plan expenses were recognized through equity in either the first half of 2026 or 2025.
18
SANOFI
HALF-YEAR FINANCIAL REPORT 2026
Exhibit 99.1
- Condensed half-year consolidated financial statements
The table below provides summary information about options outstanding and exercisable as of June 30, 2026: Outstanding
Exercisable
Number of options
Weighted average residual life (years)
Number of options
Weighted average exercise price per share (€)
From €60.00 to €70.00 per share
168,784
1.84
65.84
168,784
65.84
From €70.00 to €80.00 per share
213,400
2.84
76.71
213,400
76.71
From €80.00 to €90.00 per share
257,010
0.86
88.97
257,010
88.97
Total
639,194
Range of exercise prices per share
Weighted average exercise price per share (€)
639,194
B.8.7. Earnings per share Net income: (€ million)
June 30, 2026 (6 months)
June 30, 2025 (6 months)
Net income attributable to equity holders of Sanofi
1,957.0
5,812.0
of which net income from continuing operations
1,931.0
2,941.0
of which net income from discontinued operations
26.0
2,871.0
June 30, 2026 (6 months)
June 30, 2025 (6 months)
Number of shares: (number of shares in million) Average number of shares outstanding
1,200.4
1,225.5
Adjustment for stock options with dilutive effect
—
0.1
Adjustment for restricted shares
5.1
5.1
1,205.5
1,230.7
Average number of shares used to compute diluted earnings per share
As of June 30, 2026 and June 30, 2025, all stock options were taken into account in computing diluted earnings per share because they all had a dilutive effect. Earnings per share: Diluted earnings per share is computed using the number of shares outstanding plus stock options with dilutive effect and restricted shares. (in euros)
June 30, 2026 (6 months)
June 30, 2025 (6 months) 2.40
•
Basic earnings per share from continuing operations (€)
1.61
•
Basic earnings per share from discontinued operations (€)
0.02
2.34
Basic earnings per share (€)
1.63
4.74
•
Diluted earnings per share from continuing operations (€)
1.60
2.39
•
Diluted earnings per share from discontinued operations (€)
0.02
2.33
1.62
4.72
HALF-YEAR FINANCIAL REPORT 2026
19
Diluted earnings per share (€)
SANOFI
Exhibit 99.1
- Condensed half-year consolidated financial statements
B.8.8. Other comprehensive income Movements within other comprehensive income are shown below: (€ million)
June 30, 2026 (6 months)
June 30, 2025 (6 months)
157
105
Actuarial gains/(losses): ▪ Actuarial gains/(losses) excluding investments accounted for using the equity method ▪ Actuarial gains/(losses) of investments accounted for using the equity method, net of taxes
1
1
(20)
(25)
▪ Change in fair value (excluding investments accounted for using the equity method)
175
222
▪ Change in fair value (investments accounted for using the equity method, net of taxes)
—
—
▪ Equity risk hedging instruments designated as fair value hedges
—
—
▪ Tax effects
(23)
(60)
Items not subsequently reclassifiable to profit or loss
290
243
▪ Tax effects Equity instruments included in financial assets and financial liabilities:
Debt instruments included in financial assets: ▪ Change in fair value (excluding investments accounted for using the equity method) (a)
5
3
▪ Change in fair value (investments accounted for using the equity method, net of taxes)
—
—
▪ Tax effects
—
—
▪ Change in fair value (excluding investments accounted for using the equity method) (b)
5
(23)
▪ Change in fair value (investments accounted for using the equity method, net of taxes)
9
—
▪ Tax effects
(2)
6
1,747
(5,266)
Cash flow hedges and fair value hedges:
Change in currency translation differences: ▪ Currency translation differences on foreign subsidiaries (excluding investments accounted for using the equity method) (c) ▪ Currency translation differences (investments accounted for using the equity method) ▪ Hedges of net investments in foreign operations ▪ Tax effects Items subsequently reclassifiable to profit or loss
55
(26)
(489)
390
(3)
(101)
1,327
(5,017)
(a) Includes reclassifications to profit or loss: immaterial over all periods. (b) Includes reclassifications to profit or loss: €1 million in the first half of 2026; €2 million in the first half of 2025. (c) Currency translation differences on foreign subsidiaries are mainly due to the appreciation of the US dollar. Includes reclassifications to profit or loss: a €146 million loss in the first half of 2026 and a €459 million loss in the first half of 2025 relating to the deconsolidation of Opella.
B.9. Debt, cash and cash equivalents Changes in financial position during the period were as follows: June 30, 2026
December 31, 2025
Long-term debt
(€ million)
14,646
14,248
Short-term debt and current portion of long-term debt
7,026
4,342
Interest rate and currency derivatives used to manage debt
221
112
Total debt
21,893
18,702
Cash and cash equivalents
(6,350)
(7,657)
Interest rate and currency derivatives used to manage cash and cash equivalents Net debt (a)
(30)
(37)
15,513
11,008
(a) Net debt does not include lease liabilities, which amounted to €1,904 million as of June 30, 2026 and €1,739 million as of December 31, 2025.
“Net debt” is a non-IFRS financial measure used by management and investors to measure Sanofi’s overall net indebtedness.
20
SANOFI
HALF-YEAR FINANCIAL REPORT 2026
Exhibit 99.1
- Condensed half-year consolidated financial statements
B.9.1. Net debt at value on redemption A reconciliation of the carrying amount of net debt in the balance sheet to value on redemption as of June 30, 2026 is shown below: Value on redemption Carrying amount at June 30, 2026
(€ million)
Adjustment to debt measured at fair Amortized cost value
June 30, 2026 December 31, 2025
Long-term debt
14,646
44
61
14,751
14,360
Short-term debt and current portion of long-term debt
7,026
1
—
7,027
4,344
221
—
(131)
90
12
Total debt
21,893
45
(70)
21,868
18,716
Cash and cash equivalents
(6,350)
—
—
(6,350)
(7,657)
(30)
—
—
(30)
(37)
15,513
45
(70)
15,488
11,022
Interest rate and currency derivatives used to manage debt
Interest rate and currency derivatives used to manage cash and cash equivalents Net debt (a)
(a) Net debt does not include lease liabilities, which amounted to €1,904 million as of June 30, 2026 and €1,739 million as of December 31, 2025.
The table below shows an analysis of net debt by type, at value on redemption: December 31, 2025
June 30, 2026 (€ million) Bond issues
non-current
current
Total
non-current
current
Total
18,301
14,306
3,165
17,471
3,340
54
936
990
14,702
3,599
Other bank borrowings
49
3,291
Other borrowings
—
1
1
—
1
1
Bank credit balances
—
136
136
—
242
242
Interest rate and currency derivatives used to manage debt
—
90
90
—
12
12
(a)
Total debt
(b)
14,751
7,117
21,868
14,360
4,356
18,716
Cash and cash equivalents
—
(6,350)
(6,350)
—
(7,657)
(7,657)
Interest rate and currency derivatives used to manage cash and cash equivalents
—
(30)
(30)
—
(37)
(37)
14,751
737
15,488
14,360
(3,338)
11,022
Net debt
(a) These amounts include $3 billion designated as a hedge of Sanofi’s net investment in the United States. (b) As of June 30, 2026, current other bank borrowings include €3,217 million related to the US commercial paper program.
Principal financing and debt reduction transactions during the period During the period, Sanofi carried out a bond issue of €2.3 billion in three tranches: • €1,000 million of fixed-rate bonds maturing May 2029, with annual coupons and bearing interest at an annual rate of 3.000%; • €650 million of fixed-rate bonds maturing May 2033, with annual coupons and bearing interest at an annual rate of 3.375%; and • €650 million of fixed-rate bonds maturing May 2037, with annual coupons and bearing interest at an annual rate of 3.750%. One bond issue was redeemed during the period: a €1.5 billion issue from March 2018, redeemed at maturity on March 21, 2026. As of June 30, 2026, Sanofi had two syndicated credit facilities linked to social and environmental criteria in place to manage its liquidity in connection with current operations: • a syndicated credit facility of €4 billion, drawable in euros and US dollars and expiring on March 6, 2030, for which no further extension options are available; and • a syndicated credit facility of €3.85 billion, drawable in euros and US dollars and expiring on April 23, 2031, for which two one-year extension options are available. This facility became effective on April 23, 2026, and replaced an existing €4 billion facility that was cancelled on the same date and had originally been scheduled to mature on December 6, 2027. As of June 30, 2026, neither facility was drawn down.
SANOFI
HALF-YEAR FINANCIAL REPORT 2026
21
Exhibit 99.1
- Condensed half-year consolidated financial statements
Sanofi also has two short-term debt programs: • a €6 billion Negotiable European Commercial Paper program in France; and • a $10 billion Commercial Paper program in the United States. During the first half of 2026: • the average drawdown under the US Commercial Paper program was $3.0 billion; and • the average drawdown under the Negotiable European Commercial Paper program in France was €0.1 billion. The financing in place as of June 30, 2026 at the level of the holding company (which manages most of Sanofi’s financing needs centrally) is not subject to any financial covenants, and contains no clauses linking credit spreads or fees to the credit rating.
B.9.2. Market value of net debt The market value of Sanofi’s debt, net of cash and cash equivalents and derivatives and excluding accrued interest, is as follows: (€ million)
June 30, 2026
December 31, 2025
Market value
14,989
10,424
Value on redemption
15,488
11,022
B.10. Derivative financial instruments B.10.1 Currency derivatives used to manage operating risk exposures The table below shows operating currency hedging instruments in place as of June 30, 2026. The notional amount is translated into euros at the relevant closing exchange rate. Of which derivatives not eligible for hedge accounting
Of which derivatives designated as cash flow hedges
June 30, 2026 Notional amount
Fair value
Notional amount
Fair value
Of which recognized in equity
Notional amount
Fair value
Forward currency sales
6,536
(66)
221
(8)
(8)
6,315
(58)
of which US dollar
(€ million)
2,968
(38)
—
—
—
2,968
(38)
of which Singapore dollar
555
—
—
—
—
555
—
of which Chinese yuan renminbi
530
(6)
—
—
—
530
(6)
of which Brazilian real (a)
422
(9)
221
(8)
(8)
201
(1)
of which Saudi Arabian riyal
224
(3)
—
—
—
224
(3)
Forward currency purchases
5,039
33
—
—
—
5,039
33
of which US dollar
3,200
24
—
—
—
3,200
24
of which Singapore dollar
596
2
—
—
—
596
2
of which Chinese yuan renminbi
306
2
—
—
—
306
2
of which Turkish lira
120
6
—
—
—
120
6
of which United Arab Emirates dirham
120
1
—
—
—
120
1
11,575
(33)
221
(8)
(8)
11,354
(25)
Total
(a) Includes forward sales with a notional amount of BRL 1,300 million expiring in 2027, designated as a cash flow hedge on the divestment of Medley in Brazil.
The above positions mainly hedge material foreign currency cash flows arising after the end of the reporting period in relation to transactions carried out during the six months ended June 30, 2026 and recognized in the balance sheet at that date. Gains and losses on hedging instruments (forward contracts) are calculated and recognized in parallel with the recognition of gains and losses on the hedged items. Due to this hedging relationship, the commercial foreign exchange difference on those items (hedging instruments and hedged transactions) will be immaterial in the second half of 2026.
B.10.2. Currency and interest rate derivatives used to manage financial exposure The cash pooling arrangements for foreign subsidiaries outside the eurozone, and some of Sanofi’s financing activities, expose certain Sanofi entities to financial foreign exchange risk (i.e. the risk of changes in the value of loans and borrowings denominated in a currency other than the functional currency of the lender or borrower). That foreign exchange exposure is hedged using derivative instruments (currency swaps or forward contracts) that alter the currency split of Sanofi’s debt once those instruments are taken into account.
22
SANOFI
HALF-YEAR FINANCIAL REPORT 2026
Exhibit 99.1
- Condensed half-year consolidated financial statements
The table below shows financial currency hedging instruments in place as of June 30, 2026. The notional amount is translated into euros at the relevant closing exchange rate. June 30, 2026 (€ million)
Notional amount 1,523
Cross currency seller swaps of which US dollar
1,523
Forward currency sales
16,423
of which US dollar
13,361
of which Pound sterling
1,401
of which Brazilian real
204
Forward currency purchases
Maximum expiry date
Fair value (37) (37)
(a)
2032
(272) (b)
(c)
11,466
(241)
2027
(7)
2026
(9)
2027
170
of which US dollar
8,657
143
2027
of which Singapore dollar
1,299
6
2026
of which Hungarian forint
543
19
2026
29,412
(139)
Total
(d)
(a) Comprises two cross currency swaps, (i) with a notional amount of $870 million, pay 4.16% receive EUR 2.50%, expiring 2029 and (ii) with a notional amount of $870 million, pay 4.53% receive EUR 3.00%, expiring 2032, designated as a hedge of Sanofi’s net investment in the United States. As of June 30, 2026, the fair value of the swaps was a liability of €37 million, with €33 million debited to Other comprehensive income under the cost of hedging accounting treatment and €4 million debited to financial result. (b) Includes forward sales with a notional amount of $12,275 million expiring in 2026 and 2027, designated as a hedge of Sanofi’s net investment in the United States. As of June 30, 2026, the fair value of these forward contracts represented a liability of €223 million, with €222 million debited to Other comprehensive income and €1 million debited to Financial expenses. (c) Includes forward sales with a notional amount of BRL 1,200 million expiring in 2027, designated as a hedge of Sanofi’s net investment in Brazil. As of June 30, 2026, the fair value of these forward contracts represented a liability of €9 million, with €10 million debited to Other comprehensive income, and €1 million credited to Financial income. (d) Includes forward purchases with a notional amount of $1,000 million expiring in 2026, designated as a fair value hedge of the exposure of $1,000 million of bond issues to fluctuations in the EUR/USD spot rate. As of June 30, 2026, the fair value of these contracts represented a liability of €6 million, with €6 million debited to Financial expenses; the impact on Other comprehensive income is immaterial.
To optimize the cost of debt or reduce the volatility of debt, Sanofi uses derivative instruments (interest rate swaps and cross currency swaps) to alter the fixed/floating rate split of its net debt. The table below shows instruments of this type in place as of June 30, 2026: Of which designated as fair value hedges
Of which designated as cash flow hedges Of which recognized in equity
2026
2027
2028
2029
2030 and beyond
pay 2.08% / receive Euribor 3M
—
850
—
—
—
850
(2)
—
—
850
(2)
(2)
pay 3.77% / receive capitalized SOFR + 46bps
—
438
—
—
—
438
4
—
—
438
4
4
pay capitalized SOFR USD/ receive 1.03%
—
—
438
—
—
438
(25)
438
(25)
—
—
—
pay capitalized SOFR USD/ receive 1.32%
—
—
438
—
438
(22)
438
(22)
pay 3.82% / receive capitalized SOFR USD + 54 bps
—
—
438
—
—
438
7
—
—
438
7
7
pay capitalized Ester/receive 0.92%
—
—
—
650
—
650
(28)
650
(28)
—
—
—
pay capitalized Ester / receive 2.53%
—
—
—
750
—
750
2
750
2
—
—
—
pay capitalized Ester / receive 2.71%
—
—
—
—
475
475
4
475
4
—
—
—
pay capitalized Ester / receive 2.91%
—
—
—
—
475
475
7
475
7
—
—
—
Total
—
1,288
1,313
1,400
950
4,951
(52)
3,226
(62)
1,726
10
10
(€ million)
Total
Fair value
Notional amount
Fair value
Notional Fair amount value
Interest rate swaps
SANOFI
—
HALF-YEAR FINANCIAL REPORT 2026
23
Exhibit 99.1
- Condensed half-year consolidated financial statements
B.11. Liabilities related to business combinations and to non-controlling interests For a description of the nature of the liabilities reported in the line item Liabilities related to business combinations and to non-controlling interests, refer to Note B.8.4. to the consolidated financial statements for the year ended December 31, 2025. The liabilities related to business combinations and to non-controlling interests shown in the table below are level 3 instruments under the IFRS 13 and IFRS 7 fair value hierarchy (see Note A.5.). Movements in liabilities related to business combinations and to non-controlling interests in the first half of 2026 are shown below: Shire contingent CVRs issued CVRs issued consideration in connection in connection arising from with the with the acquisition of acquisition of acquisition of Translate Bio Blueprint Vigil
(€ million)
Other
Total (a)
Balance at January 1, 2026
531
48
5
1
585
Payments made
—
—
—
—
—
Fair value remeasurements through profit or loss: (gain)/loss (including unwinding of discount) (b)
38
8
3
—
49
Currency translation differences Balance at June 30, 2026
16
2
1
(1)
18
585
58
9
—
652
Of which: •
Current portion
•
Non-current portion
— 652
(a) As of January 1, 2026, this comprised a non-current portion of €585 million. (b) Amounts mainly reported within the income statement line item “Fair value remeasurement of contingent consideration”.
As of June 30, 2026, Liabilities related to business combinations and to non-controlling interests mainly comprised the contingent consideration liability towards Shire Human Genetic Therapies Inc. (Shire) arising from Sanofi's acquisition of Translate Bio in September 2021. The fair value of the Shire liability is determined by applying the contractual terms to development and sales projections that are weighted to reflect the probability of success, and discounted. The liability was measured at €585 million as of June 30, 2026, compared with €531 million as of December 31, 2025. If the discount rate were to fall by one percentage point, the fair value of the Shire liability would increase by approximately 13%.
B.12. Non-current provisions and other non-current liabilities The line item Non-current provisions and other non-current liabilities comprises the following: (€ million)
June 30, 2026
December 31, 2025
Provisions
4,592
Other non-current liabilities (a)
2,256
4,541 2,162
Total
6,848
6,703
(a) Includes €1,647 million as of June 30, 2026 relating to the liability for royalties payable to Sobi on net sales of Beyfortus in the United States (see Note C.2. to the consolidated financial statements for the year ended December 31, 2025). Given the method used to calculate royalties payable, an increase or decrease in sales forecasts would lead to a proportionate change in the amount of the liability. The nominal value of payments estimated to be due within more than one year but less than five years is €916 million; the nominal value of payments estimated to be due after more than five years is €2,150 million.
The table below shows movements in provisions:
24
SANOFI
HALF-YEAR FINANCIAL REPORT 2026
Exhibit 99.1
- Condensed half-year consolidated financial statements
(€ million)
Provisions for pensions & other post-employment benefits
Provisions for other long-term benefits
Restructuring provisions
Other provisions
Total
1,440
827
654
1,620
4,541
13
13
Balance at January 1, 2026 Changes in scope of consolidation
—
—
—
57
(a)
Increases in provisions and other liabilities Provisions utilized
110
180
126
473
(36)
(a)
(57)
(4)
(40)
(137)
Reversals of unutilized provisions
(13)
(a)
(2)
(60)
(54)
(129)
Transfers (b)
11
—
(104)
(20)
(113)
Net interest related to employee benefits, and unwinding of discount
26
1
8
14
49
Currency translation differences
15
18
2
17
52
Actuarial gains and losses on defined-benefit plans
(157)
—
—
—
(157)
Balance at June 30, 2026
1,343
897
676
1,676
4,592
(a) In the case of “Provisions for pensions and other post-employment benefits”, the “Increases in provisions and other liabilities” line corresponds to rights vesting in employees during the period, and past service cost; the “Provisions utilized” line corresponds to contributions paid into pension funds and to beneficiaries; and the “Reversals of unutilized provisions” line corresponds to plan curtailments, settlements and amendments. (b) Mainly transfers to Current provisions and other current liabilities.
Provisions for pensions and other post-employment benefits For an analysis of the sensitivity of obligations in respect of pensions and other employee benefits as of December 31, 2025, and of the assumptions used as of that date, see Note D.19.1. to the consolidated financial statements for the year ended December 31, 2025. The principal assumptions used (in particular, discount and inflation rates) and the market value of plan assets for the eurozone, the United States and the United Kingdom were reviewed as of June 30, 2026 to take into account changes during the first half of the year. Actuarial gains and losses arising on pensions and other post-employment benefits and recognized in equity are as follows (amounts reported before tax): June 30, 2025 (6 months)
June 30, 2026 (6 months)
(€ million) Actuarial gains/(losses) on plan assets
71
Actuarial gains/(losses) on benefit obligations
86
(c)
(45) (a)
152
(b)
(a) Includes the effects of (i) the change in discount rates (in a range between +0.05% and +0.50%) and (ii) the +0.15% change in the inflation rate in the United Kingdom in the first half of 2026. (b) Includes the effects of (i) the change in discount rates (in a range between 0.00% and +0.30%) and (ii) the -0.30% change in the inflation rate in the United Kingdom in the first half of 2025. (c) Includes actuarial gains/ (losses) related to Opella of €(4) million for the first half of 2025..
B.13. Off balance sheet commitments Off balance sheet commitments to third parties as of December 31, 2025 are presented in Note D.21.1. to the consolidated financial statements for the year ended December 31, 2025. The principal commitments entered into the period are described below: • In March 2026, Sanofi entered into an exclusive license agreement to develop, manufacture, and commercialize rovadicitinib worldwide from CTTQ, a Sino Biopharmaceutical Limited subsidiary. Rovadicitinib is a global first-in-class oral small molecule dual-target JAK/ ROCK inhibitor which received its first approval in China in February 2026 as a first-line treatment for MF (myelofibrosis) indication. Under the terms of the agreement, CTTQ received an upfront payment of $135 million and is entitled to receive up to $1.4 billion in development, regulatory and sales milestones, and up to double-digit tiered royalties on product sales. • In March 2026, Sanofi entered into a worldwide exclusive license agreement with Kali Therapeutics for a next-generation trispecific T-cell engager for autoimmune diseases, under which Sanofi will obtain exclusive worldwide rights to KT501, a novel tri-specific antibody utilizing Kali Therapeutics’ proprietary discovery and research platform. Under the terms of the agreement, Kali Therapeutics is entitled to receive up to $1.2 billion including upfront payments (of which $0.1 billion has already been paid) plus development and sales milestones, and tiered royalties ranging from high-single to double digits on product sales. As of June 30, 2026, Sanofi has not entered into any material new long-term renewable energy contract agreements as part of its sustainability strategy. The main existing agreements are presented in Note D.21.1. to the consolidated financial statements in the 2025 Form 20-F.
SANOFI
HALF-YEAR FINANCIAL REPORT 2026
25
Exhibit 99.1
- Condensed half-year consolidated financial statements
B.14. Litigation and arbitration proceedings Sanofi and its affiliates are involved in litigation, arbitration and other legal proceedings. These proceedings typically are related to product liability claims, intellectual property rights (particularly claims against generic companies seeking to limit the patent protection of Sanofi products), competition law and trade practices, commercial claims, employment and wrongful discharge claims, tax assessment claims, waste disposal and pollution claims, and claims under warranties or indemnification arrangements relating to business divestitures. The matters discussed below constitute the most significant developments since publication of the financial statements for the year ended December 31, 2025.
B.14.1. Products Zantac product litigation in the US In the Multi-District Litigation (MDL) where Federal court cases were coordinated, the Eleventh Circuit held oral argument for the appeal in the fourth quarter of 2025 and a decision is expected in the second half of 2026. In those cases pending in Delaware (State court) where the issue is to rule on defendants’ Daubert motions to exclude plaintiffs’ experts, in the second quarter of 2026, the Delaware Superior Court granted summary judgment and dismissed all the cases pending against Sanofi. The plaintiffs are appealing this ruling to the Delaware Supreme Court and Sanofi does not expect a decision on the appeal until the fourth quarter of 2027. It is not possible, at this stage, to assess with certainty the outcome of these lawsuits.
Talc product litigation in the US As of June 30, 2026, Sanofi was named as a defendant in approximately 1,430 ongoing product liability actions. To date, no cases have proceeded to trial. It is not possible, at this stage, to assess with certainty the outcome of these lawsuits.
Dupixent product litigation in the US Approximately 30 product liability cases have been filed in Federal courts around the country alleging that Dupixent (dupilumab) causes or exacerbates T-Cell lymphoma. In June 2026, those cases were consolidated into a Multi-District Litigation (MDL) in New Jersey Federal court. In addition, eight cases have been filed in New Jersey State court. It is not possible, at this stage, to assess reliably the outcome of these ongoing cases.
B.14.2. Patents Praluent (alirocumab)-related Amgen patent litigation in Europe On March 6, 2026, Sanofi, Regeneron and Amgen entered into a settlement agreement resolving these disputes. The terms of the settlement are confidential. These cases are now closed.
B.14.3. Other litigation Plavix (clopidogrel) - Attorney General Action in Texas In the action filed by Sanofi and Bristol Myers Squibb (BMS) against the Texas Attorney General (Texas AG) in Travis County, on April 28, 2026 the Travis County court granted the Texas AG’s motion to abate the companies’ suit against it; and on June 4, 2026 the companies filed a mandamus petition with the Texas Court of Appeals seeking to vacate that ruling.
340B drug pricing program in the US The US Health Resources and Services Administration (HRSA) withdrew its 340B Rebate Model Pilot Program in February 2026 but is expected to announce a new 340B Rebate Model Pilot Program later in 2026. ADR Proceedings in the US In the 340B Administrative Dispute Resolution (ADR) proceedings against Sanofi, one filed by University of Washington/ Harborview Medical Center in 2023 and one filed by Hudson Headwaters Health Network in 2024 (both alleging that Sanofi’s 340B Integrity Initiative caused “overcharges” under Section 340B), on March 9, 2026 the ADR Panel determined that there was no overcharge violation by Sanofi in the proceeding involving University of Washington Medical Center/Harborview Medical Center; and on May 27, 2026 the ADR Panel determined that there was no overcharge violation by Sanofi in the proceeding involving Hudson Headwaters Network, which has requested reconsideration of the ADR Panel’s decision. Mosaic Health in the US Since the case was remanded by the Court of Appeal to the District Court in August 2025 following the second amended complaint filed by plaintiffs, defendants (Sanofi and three other manufacturers) filed a motion to dismiss certain state law claims. Defendants also filed a petition for a writ of certiorari with the Supreme Court of the United States challenging two aspects of the Second Circuit’s decision. In July 2026, certain state law claims and plaintiffs’ unjust enrichment claims were dismissed. The District Court set a case schedule with fact discovery closing in November 2027.
26
SANOFI
HALF-YEAR FINANCIAL REPORT 2026
Exhibit 99.1
- Condensed half-year consolidated financial statements
Adventist Health System/West in the US In the appeal filed by Adventist Health System/West following the dismissal granted by the court in March 2024 in favor of the drug manufacturers including Sanofi, the Ninth Circuit Court of Appeals reversed and ordered the case to be remanded to the District Court on March 17, 2026.
B.15. Other operating income and expenses Other operating income amounted to €800 million in the first half of 2026 (versus €533 million in the first half of 2025), and Other operating expenses to €3,436 million (versus € 2,476 million in the first half of 2025), as shown in the table below. June 30, 2026 (6 months)
June 30, 2025 (6 months)
Net gains / (losses) on disposals of operating assets or businesses
241
344
Amvuttra licensing income
398
120
Other
161
69
800
533
(3,486)
(2,475)
(€ million)
Total other operating income Regeneron alliance: (i) (Profit)/loss sharing (ii) Additional profit share for development cost from Regeneron
594
494
(iii) Selling expense reimbursements to Regeneron
(336)
(346)
Other Total other operating expenses
(208)
(149)
(3,436)
(2,476)
June 30, 2026 (6 months)
B.16. Restructuring costs and similar items Restructuring costs and similar items comprise the following:
Employee-related expenses
284
June 30, 2025 (6 months) 201
Charges, gains or losses on assets (a)
179
109
Costs of transformation programs
10
80
Other (b)
90
40
Total
563
430
(€ million)
(a) This line consists of impairment losses and accelerated depreciation charges related to closed or divested sites (including leased sites), and gains or losses on divestments of assets arising from reorganization decisions made by Sanofi. (b) This line includes transaction, integration and separation costs in connection with material acquisitions or divestitures amounting to €73 million for the first half of 2026, mainly related to the Dynavax acquisition (see note B.1.).
B.17. Other gains and losses, and litigation For the first half of 2026, Other gains and losses, and litigation represents a charge of €95 million mainly related to major litigation, compared with a charge of €57 million in the first half of 2025.
B.18. Financial expenses and income An analysis of financial expenses and income is set forth below: June 30, 2026 (6 months) (253)
June 30, 2025 (6 months) (219)
Interest income (b)
118
162
Cost of net debt
(135)
(57)
(€ million) Cost of debt (a)
Non-operating foreign exchange gains/(losses)
(3)
1
Unwinding of discounting of provisions (c)
(21)
(22)
Net interest cost related to employee benefits
(27)
(37)
Impairment losses on financial assets, net of reversals Net interest expense on lease liabilities
(1)
—
(26)
(22)
Other (d)
(115)
(40)
Net financial income/(expenses)
(328)
(177)
comprising: Financial expenses
(465)
(361)
137
184
Financial income
SANOFI
HALF-YEAR FINANCIAL REPORT 2026
27
Exhibit 99.1
- Condensed half-year consolidated financial statements
(a) Includes net gain/(loss) on interest rate and currency derivatives used to manage debt: €12 million in the first half of 2026 and €(25) million in the first half of 2025. (b) Includes net gain/(loss) on interest rate and currency derivatives used to manage cash and cash equivalents: €6 million in the first half of 2026 and €(4) million in the first half of 2025. (c) Primarily on provisions for environmental risks, restructuring provisions, and provisions for product-related risks (see Note B.12.). (d) Includes a financial expense of €146 million for the six months ended June 30, 2026 and €50 million for the six months ended June 30, 2025 for the remeasurement of the liability recorded in the balance sheet for estimated future royalties on Beyfortus sales in the United States.
The impact of the ineffective portion of hedging relationships was not material in either 2026 or 2025.
B.19. Income tax expense Sanofi has elected for tax consolidations in a number of countries, principally France, Germany, the United Kingdom and the United States. The table below shows the allocation of income tax expense between current and deferred taxes: (€ million) Current taxes
June 30, 2026 (6 months)
June 30, 2025 (6 months)
(1,089)
(1,202)
Deferred taxes
218
491
Total
(871)
(711)
2,840
3,582
Income before tax and investments accounted for using the equity method
The difference between the effective tax rate (on income before tax and investments accounted for using the equity method) and the standard corporate income tax rate applicable in France is explained as follows: (as a percentage)
June 30, 2026 (6 months) (a)
June 30, 2025 (6 months)(a)
Standard tax rate applicable in France
25.8
25.8
Difference between the standard French tax rate and the rates applicable to Sanofi (b)
(17.9)
(7.3)
Tax effect related to amlitelimab
19.3
—
1.8
2.3
(c)
Revisions to tax exposures and settlements of tax disputes Other (d) Effective tax rate
1.5
(1.0)
30.6
19.8
(a) Rate calculated on the basis of the estimated effective tax rate for the full financial year (see Note A.2.). (b) This line reflects the fact that Sanofi has operations in many countries, most of which have lower tax rates than France, and the impact of patentfavorable tax regimes. The 2025 component of the temporary exceptional corporate income tax surcharge, introduced under the 2026 French Finance Act, is included in the tax charge but excluded from the calculation of the annual average effective tax rate in accordance with IAS 34. (c) This relates to the non-deductibility of the impairment loss on the amlitelimab intangible asset (see Note B.4.), and associated effects on deferred tax assets. (d) For the six months ended June 30, 2026, this line includes a tax expense of €57 million representing the estimated impact of Pillar Two based on Sanofi’s current understanding of Pillar Two rules, compared with €17 million for the six months ended June 30, 2025.
28
SANOFI
HALF-YEAR FINANCIAL REPORT 2026
Exhibit 99.1
- Condensed half-year consolidated financial statements
B.20. Revenue from contracts with customers B.20.1. Analysis of net sales The table below sets forth net sales for the six months ended June 30, 2026 and June 30, 2025
(€ million)
Europe
United States
Other countries
June 30, 2026
Europe
United States
Other countries
June 30, 2025
Total Group
4,304
11,633
6,169
22,106
4,144
9,535
6,210
19,889
1,146
6,922
1,256
9,324
944
5,283
1,085
7,312
ALTUVIIIO
—
576
98
674
—
456
86
542 525
Immunology of which
Dupixent
Rare diseases of which
Fabrazyme
138
256
129
523
134
261
130
Nexviazyme/Nexviadyme
152
211
63
426
132
195
60
387
Cerezyme
126
86
140
352
119
91
153
363
Ayvakit
44
322
1
367
—
—
—
—
Sarclisa
108
132
114
354
83
119
74
276
Lantus
146
344
323
813
149
395
332
876
Toujeo
259
134
336
729
248
126
318
692
Oncology of which
Other medicines of which
Plavix
40
2
398
440
44
3
426
473
Lovenox
202
5
157
364
247
9
191
447
Rezurock
36
218
42
296
23
220
20
263
181
7
2
190
241
1
9
251
Polio/pertussis/Hib primary vaccines and boosters, incl. Heplisav-B
206
487
671
1,364
223
320
818
1,361
RSV vaccines (Beyfortus)
87
65
240
392
85
68
203
356
Meningitis, travel and endemics vaccines
118
268
179
565
96
319
194
609
Industrial sales Vaccines of which
COVID-19 and Influenza vaccines Of which total launches
33
16
72
121
52
54
108
214
546
1,891
610
3,047
423
1,204
473
2,100
B.20.2. Other revenues June 30, 2026 (6 months)
June 30, 2025 (6 months)
VaxServe sales of non-Sanofi products
746
842
Sales to Opella (a)
60
61
Royalties
91
68
(€ million)
Other(b) Total Biopharma Other revenues Sales / Revenues from Opella products(c) Total Other revenues
271
275
1,168
1,246
270
206
1,438
1,452
(a) Revenues generated from the manufacture of Consumer Healthcare products on behalf of Opella entities. Until April 30, 2025, Opella entities were within the scope of discontinued operations (see Note B.1). With effect from May 1, 2025, Opella entities are treated as related parties in accordance with IAS24 (see Note B.5.). (b) This line mainly comprises revenues received under agreements for Sanofi to provide manufacturing services to third parties. (c) Consumer Healthcare activities not transferred on the effective date of loss of control of Opella. These are primarily (i) hospital sales of Opella products in China, the transfer of which will be finalized no earlier than 2028; (ii) sales made by the dedicated entity Opella Russie, of which Sanofi continues to hold the capital (Sanofi is continuing to distribute Opella products in Russian territory under a distribution agreement signed in connection with the separation, the parties reserving the right to discuss the transfer of that entity during the term of the distribution agreement); and (iii) sales of the Gold Bond product range, which are continuing in the United States through the retained subsidiary Gold Bond LLC (holder of the associated worldwide property rights).
SANOFI
HALF-YEAR FINANCIAL REPORT 2026
29
Exhibit 99.1
- Condensed half-year consolidated financial statements
B.21. Segment information The segment information presented by Sanofi consists of a single operating segment: Biopharma. The Biopharma operating segment comprises commercial operations and research, development and production activities relating to the Specialty Care, General Medicines, and Vaccines franchises, plus support and corporate functions, for all geographical territories. It also includes revenues generated from the manufacture of Consumer Healthcare products invoiced to Opella Healthcare SAS (Opella), which constitutes a related party with effect from April 30, 2025, the deconsolidation date, corresponding to the closing of Sanofi's sale of a controlling stake of approximately 50% in Opella to Clayton, Dubilier & Rice (CD&R). Those revenues, which before the deconsolidation date represented intragroup transactions classified within continuing operations, are presented within Other revenues in the income statement. The Biopharma operating segment also includes the purchase price of Biopharma products manufactured by Opella. The “Other” category comprises primarily, but not exclusively, Consumer Healthcare activities not transferred on the effective date of loss of control of Opella. These are primarily (i) hospital sales of Opella products in China, the transfer of which will be finalized no earlier than 2028; (ii) sales made by the dedicated entity Opella Russie, of which Sanofi continues to hold the capital (Sanofi is continuing to distribute Opella products in Russian territory under a distribution agreement signed in connection with the separation, the parties reserving the right to discuss the transfer of that entity during the term of the distribution agreement); and (iii) sales of the Gold Bond product range, which are continuing in the United States through the retained subsidiary Gold Bond LLC (holder of the associated worldwide property rights).
B.21.1. Segment results Sanofi reports segment results on the basis of “Business operating income”. This indicator is used internally by Sanofi’s chief operating decision maker to measure the performance of the operating segment and to allocate resources. “Business operating income” is derived from Operating income, adjusted as follows: • amortization and impairment losses charged against intangible assets (other than software and other rights of an industrial or operational nature) are eliminated; • fair value remeasurements of contingent consideration relating to business combinations (IFRS 3) or business divestments, and presented within the line item Fair value remeasurement of contingent consideration, are eliminated; • expenses arising from the remeasurement of inventories following business combinations (IFRS 3) or acquisitions of groups of assets that do not constitute a business within the meaning of paragraph 2b of IFRS 3, are eliminated; • amounts reported within the line items Restructuring costs and similar items are eliminated; • other gains and losses (including gains and losses on major divestments), presented within the line item Other gains and losses, and litigation, are eliminated; • other costs and provisions related to litigation, presented within the line item Other gains and losses, and litigation, are eliminated; • the share of profits/losses from investments accounted for using the equity method is added, to the extent that this relates (i) to joint ventures or (ii) to associates with which Sanofi has entered into R&D agreements and/or whose operations are managed as an integral part of Sanofi’s business activities, and; • net income attributable to non-controlling interests related to continuing operations, and excluding the effects of the above reconciling items, is deducted.
30
SANOFI
HALF-YEAR FINANCIAL REPORT 2026
Exhibit 99.1
- Condensed half-year consolidated financial statements
Segment results are shown in the table below: June 30, 2026 (6 months) (€ million)
Net sales
Biopharma
Other
June 30, 2026
Change vs. June 30, 2025 on a reported basis (IFRS)
Change vs. June 30, 2025 at constant exchange rates (nonIFRS)
Total
June 30, 2026
Change vs. June 30, 2025 on a reported basis (IFRS)
Change vs. June 30, 2025 at constant exchange rates (nonIFRS)
June 30, 2026
Change vs. June 30, 2025 on a reported basis (IFRS)
Change vs. June 30, 2025 at constant exchange rates (nonIFRS)
+15.7%
22,106
+11.1%
+15.7%
22,106
+11.1%
Other revenues
1,168
-6.3%
-2.0%
270
+31.1%
+31.1%
1,438
-1.0%
+2.7%
Cost of sales
(5,812)
+1.0%
+3.8%
(133)
+3.9%
+3.1%
(5,945)
+1.1%
+3.8%
Research and development expenses
(3,979)
+7.1%
+9.9%
(1)
—%
—%
(3,980)
+7.1%
+9.9%
Selling and general expenses
(4,690)
+5.5%
+9.4%
(102)
+72.9%
+76.3%
(4,792)
+6.3%
+10.3%
+16.7%
+22.3%
(6)
(2,636)
Other operating income and expenses
(2,630)
Share of profit/(loss) from investments accounted for using the equity method
74
74
Net income attributable to non-controlling interests
(7)
(7)
Business operating income As % of net sales
6,230
+16.5%
+22.2%
28
+75.0%
28.2%
+68.8%
6,258 28.3%
June 30, 2025 (6 months) (€ million)
Biopharma
Net sales
19,889
Other
Total 19,889
Other revenues
1,246
206
1,452
Cost of sales
(5,753)
(128)
(5,881)
Research and development expenses
(3,716)
(1)
(3,717)
Selling and general expenses
(4,447)
(59)
(4,506)
Other operating income and expenses
(1,941)
(2)
(1,943)
Share of profit/(loss) from investments accounted for using the equity method
77
—
77
Net income attributable to non-controlling interests
(8)
—
(8)
5,347
16
5,363
Business operating income
The table below, presented in compliance with IFRS 8, shows a reconciliation between “Business operating income” and Income before tax and investments accounted for using the equity method: (€ million) Business operating income Share of profit/(loss) from investments accounted for using the equity method
(a)
Net income attributable to non-controlling interests(b)
June 30, 2026 (6 months)
June 30, 2025 (6 months)
6,258
5,363
(74)
(77)
7
8
Amortization of intangible assets
(1,087)
(777)
Impairment of intangible assets(c)
(1,031)
(210)
Fair value remeasurement of contingent consideration
(37)
(61)
Expense arising from the impact of acquisitions on inventories(d)
(210)
—
Restructuring costs and similar items(e)
(563)
(430)
Other gains and losses, and litigation(f)
(95)
(57)
Operating income
3,168
3,759
Financial expenses
(465)
(361)
Financial income
137
184
2,840
3,582
Income before tax and investments accounted for using the equity method
(a) Mainly joint ventures. (b) Excludes (i) restructuring costs and (ii) other adjustments attributable to non-controlling interests. (c) The monitoring of impairment indicators for other intangible assets led to the recognition of impairment losses of €1,031 million in the first half of 2026 mainly comprising a €952 million impairment loss taken against the amlitelimab asset. For the six months ended June 30, 2025, this line mainly comprises impairment losses of €210 million linked to research and development projects. (d) This line records the impact of the workdown of acquired inventories remeasured at fair value at the acquisition date, which in the first half of 2026 relate to the Blueprint Medicines and Dynavax acquisitions. (e) See Note B.16. (f) See Note B.17.
SANOFI
HALF-YEAR FINANCIAL REPORT 2026
31
Exhibit 99.1
- Condensed half-year consolidated financial statements
B.21.2. Other segment information The tables below show the split by operating segment of (i) the carrying amount of investments accounted for using the equity method related (a) to joint ventures or (b) to associates with which Sanofi has entered into R&D agreements and/or whose operations are managed as an integral part of Sanofi’s business activities; (ii) acquisitions of property, plant and equipment; and (iii) acquisitions of intangible assets. Investments accounted for using the equity method mainly comprise MSP Vaccine Company and Infraserv GmbH & Co. Höchst KG (see Note B.5.). Acquisitions of intangible assets and property, plant and equipment correspond to acquisitions paid for during the period. Biopharma (€ million)
June 30, 2026
June 30, 2025
Investments accounted for using the equity method
204
483
Acquisitions of property, plant and equipment
882
845
Acquisitions of other intangible assets
414
575
(a)
(a) Carrying amount at the end of the reporting period.
B.21.3. Information by geographical region The geographical information on net sales provided below is based on the geographical location of the customer. Net sales (€ million)
June 30, 2026
June 30, 2025
4,304
4,144
Europe of which France
725
835
United States
11,633
9,535
Rest of the World
6,169
6,210
of which China
1,325
1,388
22,106
19,889
Total
In accordance with IFRS 8, the non-current assets reported below exclude financial instruments, deferred tax assets, pre-funded pension obligations, and right-of-use assets as determined under IFRS 16. June 30, 2026
December 31, 2025
Property, plant and equipment
Other intangible assets
Property, plant and equipment
Other intangible assets
5,998
3,951
5,760
5,094
3,161
—
3,123
—
United States
2,270
21,972
2,229
20,694
Rest of the World
2,096
436
2,063
473
(€ million) Europe of which France
of which China Total
167
—
122
—
10,364
26,359
10,052
26,261
As stated in Note D.5. to the consolidated financial statements for the year ended December 31, 2025, goodwill is not allocated by geographical region.
B.21.4. Disclosures about major customers Sales generated by Sanofi with its biggest customers, in particular certain wholesalers in the United States, represented 42% of net sales in the first half of 2026. Sanofi’s three largest customers respectively accounted for approximately 22%, 14% and 6% of consolidated net sales in the first half of 2026 (versus approximately 18%, 12% and 5% in the first half of 2025).
32
SANOFI
HALF-YEAR FINANCIAL REPORT 2026
Exhibit 99.1
- Condensed half-year consolidated financial statements
B.22. Information related to Opella, presented within discontinued operations On April 30, 2025, the Opella transaction was closed triggering loss of control, and resulting in the derecognition of all assets and liabilities of Opella subsidiaries. The table below shows the main items presented within Net income from discontinued operations: June 30, 2026
June 30, 2025
Net sales and other revenues (a)
—
1,736
Operating income (a)
—
266
Gain on disposal of Opella before tax
18
2,781
Income before tax and investments accounted for using the equity method, including gain on disposal of Opella before tax
22
3,039
Income tax expense (b)
4
(158)
Net income from discontinued operations (Opella)
26
2,881
(€ million)
(a) For the first half of 2025, these lines include the net sales and operating income of Opella until the date of loss of control. (b) In 2025, this line includes an expense of €88 million related to the tax impact on the gain arising on the loss of control of Opella.
SANOFI
HALF-YEAR FINANCIAL REPORT 2026
33
Exhibit 99.2 TABLE OF CONTENTS
- Half-year management report
35
A/ Significant events of the first half of 2026
35
B/ Progress on implementation of the sustainability strategy
40
C/ Events subsequent to June 30, 2026
41
D/ Consolidated financial statements for the first half of 2026
42
E/ Risk factors and related party transactions
56
F/ Outlook
57
G/ Appendix - research and development pipeline
59
- Statutory auditors’ review report on the half-yearly financial information
61
- Responsibility statement of the certifying officer: half-year financial report
62
SANOFI
HALF-YEAR FINANCIAL REPORT 2026
34
Exhibit 99.2 2. Half-year management report
- Half-year management report A/ Significant events of the first half of 2026 A.1. First-half overview During the first half of 2026, Sanofi continued to implement its growth and innovation strategy, focused on launching major innovations, reallocating resources and developing cutting-edge innovative R&D. Significant events connected with the implementation of this strategy are described below (for additional information on developments related to Research and Development see also section "A.2. Research and Development"). On January 29, 2026, Sanofi announced its intention to execute a €1 billion share buyback program in 2026, and on February 2, 2026, it entered into a mandate with an investment services provider for this program. Under the terms of this mandate, Sanofi was to repurchase its own shares for a maximum amount of €1 billion. The program ended at the end of April 2026. On February 10, 2026, Sanofi announced that it had completed the acquisition of Dynavax Technologies Corporation (Dynavax). The acquisition includes Dynavax’s adult hepatitis B vaccine, HEPLISAV-B, currently marketed in the United States, which is distinguished by its two-dose, one-monthly vaccination schedule. It also includes Dynavax’s shingles vaccine candidate (Z-1018), currently in phase 1/2 clinical trials, as well as other vaccine projects in development. On April 24, 2026, Sanofi announced the successful placement of a €2.3 billion bond issue under the Euro Medium Term Note program. Sanofi will allocate the net proceeds from the issuance of these bonds to general corporate purposes. Net sales for the first half of 2026 amounted to €22,106 million, 11.1% higher than in the first half of 2025. At constant exchange rates (CER)(1), net sales rose by 15.7%, driven mainly by strong performances for Dupixent, Ayvakit and ALTUVIIIO. Net income attributable to equity holders of Sanofi amounted to €1,957 million in the first half of 2026, versus €5,812 million in the first half of 2025. Earnings per share was €1.63 for the first half of 2026, versus €4.74 for the first half of 2025. Business net income(2) was €4,765 million, up 14.8% versus the first half of 2025, while business earnings per share (business EPS(2)) was €3.97, 17.1% up versus the first half of 2025.
A.2. Research and development Sanofi’s research and development (R&D) is focused on developing and delivering life-changing medicines and vaccines that change the lives of patients for many of the world’s most complex diseases. Progress made in R&D during the first half of 2026 is described in detail below, and an update on the R&D pipeline is presented in Section G/ of this half-year management report.
Immunology Dupixent (dupilumab) After evaluation under priority review, the US Food and Drug Administration (FDA) approved Dupixent for the treatment of adult and pediatric patients aged 6 years and older with allergic fungal rhinosinusitis (AFRS) who have a history of sino-nasal surgery. This approval expands the coverage of sino-nasal diseases with Dupixent to now include AFRS, alongside chronic rhinosinusitis with nasal polyps (CRSwNP). The FDA and the European Commission (EC) approved Dupixent for the treatment of children aged two to 11 years with chronic spontaneous urticaria (CSU) who remain symptomatic despite histamine-1 antihistamine (H1AH) treatment. These approvals expand the previous authorizations for Dupixent in adults and adolescents aged 12 years and older with CSU. The Ministry of Health, Labour and Welfare (MHLW) in Japan granted marketing and manufacturing authorization for Dupixent for the treatment of adults with moderate-to-severe bullous pemphigoid (BP). When publishing its first-quarter 2025 results, Sanofi announced that the European Medicines Agency (EMA) had accepted its Marketing Authorisation Application for Dupixent in the treatment of BP. Following comments from the EMA during its ongoing review of Dupixent for this indication, Sanofi has decided to withdraw the application. The two phase 3 studies of Dupixent in the LIBERTY-LSC clinical program (STYLE 1 and STYLE 2; clinical study identifiers: NCT06687967 and NCT06687980, respectively) in lichen simplex chronicus (LSC) did not meet their primary endpoints of itch reduction compared to placebo. The safety data from these studies were generally consistent with the known safety profile of Dupixent. As a result of this outcome, Sanofi and Regeneron will conduct a thorough analysis of the data and plan to present them at a forthcoming medical meeting.
(1) (2)
Non-IFRS financial measure: see definition in D.3., “Net sales”. Non-IFRS financial measure: see definition in D.2., “Business net income”.
SANOFI
HALF-YEAR FINANCIAL REPORT 2026
35
Exhibit 99.2 2. Half-year management report
Rezurock (belumosudil) The EC granted a conditional marketing authorization for Rezurock for the treatment of chronic graft-versus-host disease (cGVHD) in adults and children aged 12 years and older with a body weight of at least 40 kg. The medicine is to be used when other treatment options provide limited clinical benefit, are not suitable, or have been exhausted. This conditional marketing authorization followed the positive opinion issued by the EMA’s Committee for Medicinal Products for Human Use (CHMP) in January, and is contingent on completion of a confirmatory, randomised, controlled study.
Tzield/Teizeild (teplizumab) In April, the FDA approved the supplemental biologic license application for Tzield, expanding the indication to patients as young as one year old, compared to a minimum of eight years previously, to delay the onset of stage 3 type 1 diabetes (T1D) in patients diagnosed with stage 2 T1D. In June, the FDA approved Tzield to delay the decline in endogenous insulin production in children aged eight to 17 years recently diagnosed with stage 3 T1D. Both approvals were granted under a priority review process. In the EU, teplizumab was approved (under the name Teizeild) to delay the onset of stage 3 T1D in adults and pediatric patients aged eight years and older diagnosed with stage 2 T1D.
amlitelimab (OX40L monoclonal antibody) On July 24, 2026, a decision was made as part of the ongoing strategic assessment of the pipeline that amlitelimab would not progress to regulatory submission. Sanofi determined that the totality of efficacy and safety evidence generated to date does not support further development of amlitelimab in atopic dermatitis (AD). While the ESTUARY phase 3 long-term extension study (clinical study identifier: NCT06407934) showed long-term maintenance of clinical response without relapse in patients aged 12 years and older with moderate-to-severe AD and an emerging safety profile that builds on previous data (including phase 3 studies COAST 1, SHORE and COAST 2; clinical study identifiers: NCT06130566, NCT06224348 and NCT06181435, respectively), amlitelimab would not represent a meaningful improvement to the standard of care for patients with AD.
itepekimab (IL33 monoclonal antibody) After complete assessment of the results from AERIFY 1 (clinical study identifier: NCT04701983) and AERIFY 2 (clinical study identifier: NCT04751487), the two phase 3 studies in chronic obstructive pulmonary disease (COPD) that read out in May 2025, and after considering the competitive landscape, Sanofi and its collaboration partner Regeneron have decided not to proceed with development of itepekimab in COPD. As a result, the development programme will be discontinued, including all studies in chronic rhinosinusitis.
duvakitug (TL1A monoclonal antibody) Positive results from the RELIEVE UCCD long-term extension (LTE) study of duvakitug (clinical study identifier: NCT05668013) showed durable clinical and endoscopic efficacy maintained over 44 weeks in patients with ulcerative colitis (UC) and Crohn’s disease (CD) that initially responded to the induction phase. RELIEVE UCCD LTE is a double-blind randomised study evaluating the long-term efficacy, safety, and tolerability of duvakitug in UC and CD. The efficacy data from the LTE study and from the previous RELIEVE UCCD phase 2b induction study (clinical study identifier: NCT05499130) reinforce the therapeutic potential of duvakitug in UC and CD, which is under evaluation in phase 3 clinical studies.
lunsekimig (IL13xTSLP Nanobody® VHH) Phase 2 studies of lunsekimig in two chronic respiratory diseases, moderate-to-severe asthma (AIRCULES phase 2b study; clinical study identifier: NCT06102005) and CRSwNP (DUET phase 2a proof-of-concept study; clinical study identifier: NCT06454240), met their primary and key secondary endpoints compared to placebo. The exploratory VELVET phase 2b study (clinical study identifier: NCT06790121) did not meet its primary endpoint in moderate-to-severe atopic dermatitis. In all studies, lunsekimig was well tolerated.
frexalimab (CD40L monoclonal antibody) The FREXERA phase 2/3 study of frexalimab in kidney transplantation (clinical study identifier: NCT07412470) commenced dosing the first patient in March 2026. The study is testing whether frexalimab dosed subcutaneously (after an initial intravenous dose) combined with standard-of-care treatment can reduce the risk of rejection of the new kidney, help it last longer, and improve kidney function.
Rare diseases Nexviazyme (avalglucosidase alfa) Nexviazyme met its primary endpoint (participants alive and free of invasive ventilation) in treatment-naive infants aged zero to six months in the Baby-COMET phase 3 study (clinical study identifier: NCT04910776). In addition, the study met all secondary endpoints. Sanofi intends to submit the data to support a regulatory application in the US for the treatment of infantile-onset Pompe disease.
Wayrilz (rilzabrutinib) In June, the MHLW in Japan granted marketing and manufacturing authorization to Wayrilz for the treatment of persistent or chronic immune thrombocytopenia (ITP) in patients who do not respond sufficiently to other treatments or in whom tolerability is 36
SANOFI
HALF-YEAR FINANCIAL REPORT 2026
Exhibit 99.2 2. Half-year management report
problematic. The approval is based on the LUNA 3 phase 3 study (clinical study identifier: NCT04562766) in which Wayrilz met the primary and secondary endpoints, showing a positive impact on sustained platelet counts and other symptoms.
Myqorzo (aficamten) In May, Cytokinetics, Sanofi’s licensor of Myqorzo in China, announced positive topline results from the ACACIA-HCM phase 3 study of Myqorzo in patients with symptomatic non-obstructive hypertrophic cardiomyopathy. In the study, all primary endpoints were met, statistically significant improvements in key secondary endpoints were obtained, and no new safety signals were identified. The results are expected to form the basis for a regulatory submission in China in 2027.
Redemplo (plozasiran) In China, Redemplo was granted a breakthrough designation in severe hypertriglyceridemia. Redemplo will be marketed in Greater China by Sanofi under an agreement with Arrowhead. In 2025, Sanofi purchased those rights from Visirna, a majority owned subsidiary of Arrowhead created to develop and commercialize four of Arrowhead’s cardiometabolic pipeline medicines in Greater China. Sanofi plans to initiate launch of Redemplo in the near future for the reduction of triglyceride levels in adult patients with familial chylomicronaemia syndrome (FCS), a severe and rare disease leading to a substantially higher risk of developing acute, recurrent, and potentially fatal pancreatitis.
venglustat (oral glucosylceramide synthase inhibitor) In May, the FDA granted priority review to the new drug application (NDA) for venglustat for the treatment of type 3 Gaucher disease (GD3), a rare lysosomal storage disorder. If approved, venglustat would become the first treatment available in the US to address the progressive neurological manifestations associated with GD3 and expand Sanofi’s portfolio of treatment options for patients living with lysosomal storage diseases. The target action date for the FDA decision is November 25, 2026. In Fabry disease, venglustat did not meet the primary endpoint in the PERIDOT and CARAT phase 3 studies (clinical study identifiers: NCT05206773 and NCT05280548, respectively). The long-term extensions of the PERIDOT and CARAT studies are both continuing.
efdoralprin alfa (alpha-1 antitrypsin fusion protein) Data from the global ElevAATe phase 2 study (clinical study identifier: NCT05856331) demonstrated superiority of efdoralprin alfa over standard-of-care therapy in achieving and maintaining normalized functional alpha-1 antitrypsin levels in adult patients with alpha-1 antitrypsin deficiency (AATD)-related emphysema. Additional long-term safety and efficacy outcomes are being evaluated in the ElevAATe OLE phase 2 study (clinical study identifier: NCT05897424). Efdoralprin alfa is a recombinant protein distinct from plasma-derived therapy, which has been the standard-of-care for nearly 40 years. It has been granted fast track designation and orphan drug designation in the US and orphan designation in the EU. A first regulatory submission in the US is expected in the second half of 2026, depending on final regulatory feedback.
Neurology Cenrifki (tolebrutinib) In June, the EC approved Cenrifki for the treatment of secondary progressive multiple sclerosis (SPMS) without relapses in the last two years. This approval followed the positive opinion by the EMA's CHMP and was based on the HERCULES phase 3 study (clinical study identifier: NCT04411641) in non-relapsing SPMS (nrSPMS), with supporting data from GEMINI 1 and GEMINI 2 phase 3 studies in relapsing multiple sclerosis (clinical study identifiers: NCT04410978 and NCT04410991, respectively). The HERCULES study demonstrated that Cenrifki significantly delayed the onset of disability progression in nrSPMS.
riliprubart (C1s monoclonal antibody) In June, Sanofi announced discontinuation of the MOBILIZE phase 3 study (clinical study identifier: NCT06290128) of riliprubart in patients with chronic inflammatory demyelinating polyneuropathy (CIDP) refractory to standard-of-care treatment. This decision followed an interim analysis by an independent data monitoring committee, which determined that the MOBILIZE study was unlikely to provide sufficient efficacy. No safety signals related to riliprubart were identified as part of this interim analysis. The continuation of other ongoing studies with riliprubart, including the VITALIZE phase 3 study (clinical study identifier: NCT06290141) in IVIg-treated patients with CIDP, has been evaluated accordingly. The VITALIZE study continues as planned.
Oncology Sarclisa (isatuximab) The EC (in June) and the FDA (in July) approved subcutaneous (SC) Sarclisa / Sarclisa Escena (the US product name) in combination with standard-of-care regimens for the treatment of patients with multiple myeloma (MM) across all existing indications for Sarclisa intravenous (IV) formulation. Sarclisa/ Sarclisa Escena is the first anticancer therapy to be administered through an on-body injector (OBI) and the first MM treatment available by both SC OBI and manual administration in the EU and the US, thereby providing flexibility of administration at patients’ homes and in an outpatient setting. Sarclisa / Sarclisa Escena can be used in conjunction with Enable Injections’ CirCLIQ OBI, enabling it to be delivered subcutaneously with the push of a button using a shorter, thinner retractable needle. Sarclisa SC formulation in combination with approved standard-of-care regimens for the treatment of MM was also approved by the MHLW in Japan. A regulatory submission for Enable Injections’
SANOFI
HALF-YEAR FINANCIAL REPORT 2026
37
Exhibit 99.2 2. Half-year management report
CirCLIQ OBI is under review in Japan. An application for Sarclisa SC administered via manual injection is currently under review in China.
Vaccines Nuvaxovid (COVID-19) Sanofi's protein-based non-mRNA COVID-19 vaccine Nuvaxovid (NVX-CoV2705) demonstrated statistically significant lower systemic reactogenicity (the expected side effects that might occur following vaccination) compared to mNEXSPIKE (mRNA-1283), Moderna's latest mRNA COVID-19 vaccine, across all pre-specified endpoints in the COMPARE study (clinical study identifier: NCT07051031), which enrolled 1,000 adults in the US.
Fluzone HD/Efluelda (influenza) The FDA and EMA accepted for review the regulatory submission of Fluzone high dose (HD)/Efluelda for use in adults aged 50 years and above to prevent influenza. The regulatory submission follows positive results in the QHD00042 phase 3 study (clinical study identifier: NCT06641180) reported in October 2025.
A.3. Other significant events A.3.1 Corporate governance The Combined General Shareholders’ Meeting of Sanofi was held on April 29, 2026 at the Palais des Congrès in Paris, and was chaired by Frédéric Oudéa. All resolutions submitted to the vote were adopted by the shareholders. Decisions taken by the General Meeting included approving the individual company and consolidated financial statements for the year ended December 31, 2025, and distributing an ordinary annual dividend of €4.12 per share.
Board of Directors Sanofi’s Board of Directors met on February 11, 2026, and decided not to renew Paul Hudson’s term of office as a director. Consequently, on February 18, 2026, Paul Hudson resigned from his position as a director, with immediate effect. The Combined General Shareholders’ Meeting of Sanofi held on April 29, 2026 approved the reappointments of Jean-Paul Kress as an independent director and Christophe Babule as a director, and the appointments of Belén Garijo as a director and Christel Heydemann as an independent director. Following the expiry of Patrick Kron’s term of office at the close of the Annual General Meeting of April 29, 2026, the Board of Directors now comprises 16 members, of whom eight are women and two are directors representing employees. The Board of Directors retains a large majority of independent directors. Following the departure of Paul Hudson and Patrick Kron from the board of directors, and on the proposal of the Appointments, Governance and CSR Committee, the Board of Directors appointed Frédéric Oudéa as Chairman of the Appointments, Governance and CSR Committee; Belén Garijo as a member of the Strategy Committee; and Christel Heydemann as a member of the Appointments, Governance and CSR Committee and the Compensation Committee.
Chief Executive Officer The Board of Directors relieved Paul Hudson of his duties as Chief Executive Officer effective end-of-day on February 17, 2026. Olivier Charmeil (Executive Vice-President, General Medicine), served as Interim Chief Executive Officer from February 18 until April 30, 2026. The Board meeting held on April 29, 2026 confirmed the appointment of Belén Garijo as Chief Executive Officer of Sanofi with effect from May 1, 2026.
Executive Committee In the first half of 2026, the Executive Committee's composition changed with: • the departure of Paul Hudson as Chief Executive Officer effective end-of-day on February 17, 2026, and the appointment of Belén Garijo to succeed him, effective May 1, 2026; • the appointment of Manuela Buxo as Executive Vice President, Specialty Care, effective March 1, 2026. Manuela Buxo succeeded Brian Foard, who decided to leave the company as of February 28, 2026, having accepted an external leadership opportunity; and • the departure of Natalie Bickford from her position as Executive Vice President, Chief People Officer on May 31, 2026. Véronique Jaillet is currently serving as interim Chief People Officer with effect from June 1, 2026. On July 21, 2026 Sanofi announced an evolution of its Executive Committee, which effective September 1, 2026 will comprise: • François Roger, Executive Vice President, Finance;
38
SANOFI
HALF-YEAR FINANCIAL REPORT 2026
Exhibit 99.2 2. Half-year management report
• • • • • • •
Paulo Fontoura, Executive Vice President, Head of Research & Development; Manuela Buxo, Executive Vice President, Specialty Care; Thomas Triomphe, Executive Vice President, Vaccines; Thomas Grenier, Executive Vice President, General Medicines; Brendan O’Callaghan, Executive Vice President, Manufacturing & Supply; Jamie Haney, Executive Vice President, General Counsel; and Véronique Jaillet, Executive Vice President, Interim Chief People Officer.
A.3.2. Legal and arbitration proceedings For a description of the most significant developments in legal and arbitration proceedings since publication of the financial statements for the year ended December 31, 2025, refer to Note B.14. to our condensed half-year consolidated financial statements.
Government Investigations and Related Litigation In the insulin-related antitrust suit brought on behalf of direct purchasers in Massachusetts Federal Court, trial is scheduled to begin in January 2027. In the complaint filed in 2024 by the Texas state court alleging violations of the Texas Medicaid Fraud Prevention Act (TMFPA), on February 13, 2026, the State of Texas filed its Petition in Intervention asserting a false certification theory of liability. Sanofi moved to disqualify one of relator's law firms with a hearing expected in August 2026. Discovery closes on January 15, 2027; trial is scheduled for July 19, 2027 — both dates are subject to continuance pending the court's ruling on the disqualification motion.
A.3.3. Other events On June 4, 2026, Sanofi announced the launch of Action 2026, a global employee share ownership plan open to around 75,000 employees in 52 countries. Now in its twelfth year, the program demonstrates the ongoing commitment of Sanofi and its Board of Directors to ensuring that employees benefit from the company’s growth and success. The shares were offered at a subscription price of €59.87, representing a 20% discount to the average of the 20 opening prices of Sanofi shares from May 6 to June 2, 2026. For every five shares subscribed, employees were entitled to receive one free share (up to a maximum of four free shares per employee). Every eligible employee was able to purchase up to 1,500 Sanofi shares, subject to the maximum legal limit set at 25% of their gross annual salary, minus any voluntary deductions already made under employee savings schemes such as the Company Savings Plan and/or Group Savings Plan and/or Group Retirement Savings Plan (PERCO) during 2026; the above limit does not apply to voluntary contributions to the “PERCOL” retirement savings plan.
SANOFI
HALF-YEAR FINANCIAL REPORT 2026
39
Exhibit 99.2 2. Half-year management report
B/ Progress on implementation of the sustainability strategy Acoziborole positive opinion marks major step forward in sleeping sickness elimination The CHMP granted a positive opinion on acoziborole, a single-dose oral medicine administered as three tablets, positioning it as a significant advance in supporting the WHO goal of eliminating the disease by 2030. Sanofi’s commitment – alongside its long-term partner Drugs for Neglected Diseases initiative, the WHO, and other global health players – has resulted in a 98% reduction in sleeping sickness cases since 2001. Sanofi will donate acoziborole to the WHO through its philanthropic arm, Sanofi Foundation, ensuring patients receive the treatment at no cost.
Sanofi-supported study quantifies environmental and socio-economic factors exacerbating respiratory diseases Sanofi’s sustainability strategy is built on the ambition to tackle the link between environmental challenges, health, and healthcare. A study supported by Sanofi, in partnership with Regeneron, analysed health data from over 710,000 asthma and COPD patients(1) in France between 2018 and 2022, incorporating environmental and socio-economic indicators to identify risk and protective factors associated with respiratory disease exacerbation. The study results show that the setting and living conditions directly influence the severity of respiratory diseases. Urban living increases the risk of exacerbations by 40% in people with asthma, by 53% in asthmatic children, and by 8% in people with COPD. Conversely, certain natural environments, such as proximity to a forest or other green areas or bodies of water, reduce risk by 5% and 20%, respectively. The study also confirmed the central role of air pollution in the worsening of respiratory diseases. Other factors, such as tobacco use and extreme temperatures (increasingly frequent in the context of climate change), also increase the risk of exacerbations. Additionally, socio-economic inequalities compound environmental risks, with patients in high-poverty areas facing up to 36% higher exacerbation risk.
GHU progress on access and healthcare system strengthening Sanofi’s Global Health Unit (GHU) aims to provide access to a broad portfolio of medicines in countries with the highest unmet medical needs. To that end, the GHU offers Impact: a not-for-profit brand of WHO-essential, standard-of-care medicines produced by Sanofi. The Impact medicines portfolio is now available in 30 countries(2) and marks a significant step in expanding access to quality medicines in underserved regions globally. This milestone reflects the GHU's operational progress and supports the trajectory toward reaching two million patients with non-communicable diseases (NCDs) treatments by 2030. The GHU is also strengthening healthcare systems across 40 underserved countries through strategic partnerships, reaching 6.6 million beneficiaries – of whom 6.5 million were screened for NCDs, 1.1 million diagnosed, and nearly 500,000 linked to care (medical treatment, monitoring, support services, etc.). In parallel, over 40,000 healthcare professionals and community health workers have been trained, and more than 1,000 pharmacies, distributors, and clinics supported to improve supply chain efficiency.
AccesS diabetes programme expands to South Africa and India Sanofi's AccesS Diabetes programme addresses potential barriers to diabetes care by providing patient support initiatives, capacity and capability building, and high-quality analogue insulin through partnerships with governments and stakeholders tailored to country-specific needs. Sanofi signed two new memoranda of understanding in South Africa and India (State of Madhya Pradesh), marking a significant expansion of its diabetes access initiatives in regions with substantial unmet medical needs. In Madhya Pradesh, the program also aims to strengthen the infrastructure for diagnosis and treatment of rare diseases. The AccesS Diabetes program has now been rolled out in Ghana, Nigeria (States of Delta and Kano), South Africa and India (State of Madhya Pradesh).
The Democratic Republic of the Congo approves acoziborole: the first single-dose treatment for sleeping sickness Building on the positive EMA opinion in the first quarter of 2026, the Democratic Republic of the Congo has approved acoziborole, a breakthrough single-dose oral treatment. Following successful clinical studies in the DRC and Guinea, this registration marks an important step forward in the fight against gambiense human African trypanosomiasis.
Sustainability dashboard for the second quarter of 2026 Please refer to the sustainability dashboard provided as an appendix to the Sanofi second-quarter 2026 results press release.
(1) (2)
Study conducted using data from the National Health Data System, specifically hospital data. Through registration or import licenses.
40
SANOFI
HALF-YEAR FINANCIAL REPORT 2026
Exhibit 99.2 2. Half-year management report
C/ Events subsequent to June 30, 2026 The main events related to research and development that occurred between the end of the reporting period and the date on which the condensed consolidated financial statements were reviewed by the Board of Directors are described in section 'A.2. Research and Development'. No other significant events occurred during this period.
SANOFI
HALF-YEAR FINANCIAL REPORT 2026
41
Exhibit 99.2 2. Half-year management report
D/ Consolidated financial statements for the first half of 2026 Unless otherwise indicated, all financial data in this report are presented in accordance with international financial reporting standards (IFRS), including international accounting standards and interpretations (see Note A.1. to our condensed half-year consolidated financial statements).
Consolidated income statements for the six months ended June 30, 2025 and June 30, 2026 (€ million)
June 30, 2026 (6 months)
as % of net sales
June 30, 2025 (6 months)
as % of net sales
Net sales
22,106
100.0%
19,889
100.0%
Other revenues
1,438
6.5%
1,452
7.3%
Cost of sales
(6,155)
-27.8 %
(5,881)
-29.6 %
Gross profit
17,389
78.7%
15,460
77.7%
Research and development expenses
(3,980)
-18.0 %
(3,717)
-18.7 %
Selling and general expenses
(4,792)
-21.7 %
(4,506)
-22.7 %
Other operating income
800
533
Other operating expenses
(3,436)
(2,476)
Amortization of intangible assets
(1,087)
(777)
Impairment of intangible assets
(1,031)
(210)
Fair value remeasurement of contingent consideration
(37)
(61)
Restructuring costs and similar items
(563)
(430)
Other gains and losses, and litigation
(57)
(95) 3,168
Financial expenses
(465)
(361)
Financial income
137
184
Income before tax and investments accounted for using the equity method Income tax expense Share of profit/(loss) from investments accounted for using the equity method
2,840
14.3%
3,759
Operating income
12.8%
3,582
(871)
(711)
2
85
18.9%
18.0%
Net income from continuing operations
1,971
8.9%
2,956
14.9%
Net income from discontinued operations
26
0.1%
2,881
14.5%
1,997
9.0%
5,837
29.3%
Net income Net income attributable to non-controlling interests Net income attributable to equity holders of Sanofi
40 1,957
25 8.9%
5,812
Average number of shares outstanding (million)
1,200.4
1,225.5
Average number of shares after dilution (million)
1,205.5
1,230.7 2.40
•
Basic earnings per share from continuing operations (€)
1.61
•
Basic earnings per share from discontinued operations (€)
0.02
2.34
1.63
4.74
Basic earnings per share (in euros) •
Diluted earnings per share from continuing operations (€)
1.60
2.39
•
Diluted earnings per share from discontinued operations (€)
0.02
2.33
1.62
4.72
Diluted earnings per share (in euros)
42
SANOFI
HALF-YEAR FINANCIAL REPORT 2026
29.2%
Exhibit 99.2 2. Half-year management report
D.1. Segment information D.1.1. Operating segments In accordance with IFRS 8 (Operating Segments), the segment information reported by Sanofi is prepared on the basis of internal management data provided to our Chief Executive Officer, who is the chief operating decision maker of Sanofi. The performance of the single operating segment is monitored individually using internal reports and common indicators. The operating segment disclosures required under IFRS 8 are provided in Note B.21. to our condensed half-year consolidated financial statements. The segment information presented by Sanofi consists of a single operating segment: Biopharma. The Biopharma operating segment comprises commercial operations and research, development and production activities relating to the Specialty Care, General Medicines, and Vaccines franchises, plus support and corporate functions, for all geographical territories. It also includes revenues generated from the manufacture of Consumer Healthcare products invoiced to Opella Healthcare SAS (Opella), which constitutes a related party with effect from April 30, 2025, the deconsolidation date, corresponding to the closing of Sanofi's sale of a controlling stake of approximately 50% in Opella to Clayton, Dubilier & Rice (CD&R). Those revenues, which before the deconsolidation date represented intragroup transactions classified within continuing operations, are presented within Other revenues in the income statement. The Biopharma operating segment also includes the purchase price of Biopharma products manufactured by Opella. The “Other” category comprises primarily, but not exclusively, Consumer Healthcare activities not transferred on the effective date of loss of control of Opella. These are primarily (i) hospital sales of Opella products in China, the transfer of which will be finalized no earlier than 2028; (ii) sales made by the dedicated entity Opella Russie, of which Sanofi continues to hold the capital (Sanofi is continuing to distribute Opella products in Russian territory under a distribution agreement signed in connection with the separation, the parties reserving the right to discuss the transfer of that entity during the term of the distribution agreement); and (iii) sales of the Gold Bond product range, which are continuing in the United States through the retained subsidiary Gold Bond LLC (holder of the associated worldwide property rights).
D.1.2. Business operating income We report segment results on the basis of “Business operating income”. This indicator is used internally by Sanofi’s chief operating decision maker to measure the performance of the operating segment and to allocate resources. For a definition of “Business operating income” refer to Note B.21.1. to our condensed half-year consolidated financial statements. “Business operating income” is a non-IFRS financial measure and is reconciled with IFRS Operating income. In the first half of 2026, Operating income amounted to €3,168 million, versus €3,759 million in the first half of 2025, and our “Business operating income” amounted to €6,258 million, versus €5,363 million in the first half of 2025. The reconciliation between these two measures is presented in the table below. Because our “Business operating income” is not a standardized measure, it may not be directly comparable with the non-IFRS financial measures of other companies using the same or similar non-IFRS financial measures. Although management uses this non-IFRS measure to set goals and measure performance, it has no standardized meaning prescribed by IFRS. This non-IFRS measure is presented solely to permit investors to more fully understand how Sanofi’s management assesses underlying performance. This non-IFRS measure is not, and should not be viewed as, a substitute for IFRS measures, and should be viewed in conjunction with IFRS measures of our performance and financial position. Consequently, there may be limitations on the usefulness of this measure to investors. June 30, 2026 (6 months)
June 30, 2025 (6 months)
Operating income
3,168
3,759
Other gains and losses, and litigation (a)
(95)
(57)
Restructuring costs and similar items (b)
(563)
(430)
Expenses resulting from acquisition-related impacts on inventories (c)
(210)
0
Fair value remeasurement of contingent consideration
(37)
(61)
(€ million)
Impairment of intangible assets (d)
(1,031)
(210)
Amortization of intangible assets
(1,087)
(777)
Net income attributable to non-controlling interests (e) Share of profit/(loss) from investments accounted for using the equity method (f) Business operating income
7
8
(74)
(77)
6,258
5,363
(a) See Note B.17. (“Other gains and losses, and litigation”) to the condensed half-year consolidated financial statements. (b) See Note B.16. (“Restructuring costs and similar items”) to the condensed half-year consolidated financial statements. (c) This line records the impact of the workdown of acquired inventories remeasured at fair value at the acquisition date, which in the first half of 2026 relate to the Blueprint Medicines and Dynavax acquisitions. (d) The monitoring of impairment indicators for other intangible assets led to the recognition of impairment losses of €1,031 million in the first half of 2026 mainly comprising a €952 million impairment loss taken against the amlitelimab asset. For the six months ended June 30, 2025, this line mainly comprises impairment losses of €210 million linked to research and development projects. (e) Excluding restructuring costs and other adjusted items attributable to non-controlling interests. (f) Primarily joint ventures.
SANOFI
HALF-YEAR FINANCIAL REPORT 2026
43
Exhibit 99.2 2. Half-year management report
D.2. Business net income (non-IFRS financial measure) Sanofi also presents “Business net income”, a non-IFRS financial measure which is not defined by accounting standards and is not included in the primary financial statements. The IFRS measure most directly comparable to “Business net income” is Net income attributable to equity holders of Sanofi, which amounted to €1,957 million in the first half of 2026, versus €5,812 million in the first half of 2025, representing a decrease of 66.3%. “Business net income” amounted to €4,765 million in the first half of 2026, versus €4,152 million in the first half of 2025, representing an increase of 14.8%. “Business net income” in the first half of 2026 represents 21.6% of our net sales, compared with 20.9% of our net sales in the first half of 2025. We also report “Business earnings per share” (business EPS), a non-IFRS financial measure which we define as business net income divided by the weighted average number of shares outstanding. Business EPS was €3.97 for the first half of 2026 (up 17.1%) compared with the 2025 first-half figure of €3.39, based on an average number of shares outstanding of €1,200 million for the first half of 2026 and €1,225 million for the first half of 2025. We define “Business net income” as Net income attributable to equity holders of Sanofi determined under IFRS, excluding the following items: • net income from discontinued operations, including Opella; • amortization and impairment losses charged against intangible assets (other than software and other rights of an industrial or operational nature); • fair value remeasurements of contingent consideration relating to business combinations (IFRS 3), or to divestments of operations meeting the definition of a business; • expenses arising from the remeasurement of inventories following business combinations (IFRS 3) or acquisitions of groups of assets that do not constitute a business within the meaning of paragraph 2b of IFRS 3; • restructuring costs and similar items (presented within the line item Restructuring costs and similar items); • other gains and losses (including gains and losses on major divestments), presented within the line item Other gains and losses, and litigation; • other costs and provisions related to litigation (presented within the line item Other gains and losses, and litigation); • (income)/expenses related to financial liabilities accounted for at amortized cost and subject to periodic remeasurement in accordance with paragraph B5.4.6 of IFRS 9 (Financial Instruments); • the share of profits/losses from investments accounted for using the equity method, except to the extent that this relates (i) to joint ventures or (ii) to associates with which Sanofi has entered into R&D agreements and/or whose operations are managed as an integral part of Sanofi’s business activities; and • the portion attributable to non-controlling interests of the items listed above. The table below reconciles Net income attributable to equity holders of Sanofi to our “Business net income” :
44
SANOFI
HALF-YEAR FINANCIAL REPORT 2026
Exhibit 99.2 2. Half-year management report
June 30, 2026 (6 months)
(€ million)
June 30, 2025 (6 months)
Net income attributable to equity holders of Sanofi (IFRS)
1,957
5,812
Net (income)/loss from the discontinued Opella business (a)
(26)
(2,881)
Amortization of intangible assets
1,087
777
Impairment of intangible assets
1,031
210
Fair value remeasurement of contingent consideration
70
68
Expenses arising from the impact of acquisitions on inventories
210
—
Restructuring costs and similar items
563
430
Other gains and losses, and litigation(c)
95
57
Financial (income)/expenses relating to financial liabilities accounted for at amortized cost and subject to periodic remeasurement(d)
146
50
Tax effects of the items listed above:
(423)
(384)
•
amortization and impairment of intangible assets
(198)
(173)
•
fair value remeasurement of contingent consideration
(6)
(14)
•
expenses arising from the impact of acquisitions on inventories
(47)
—
•
tax effects of restructuring costs and similar items
(89)
(113)
•
(b)
other items
(83)
(84)
Other tax effects
(17)
11
Other items (e)
72
2
Business net income (non-IFRS)
4,765
4,152
Average number of shares outstanding (million)
1,200.4
1,225.5
Basic earnings per share (IFRS) (in euros)
1.63
4.74
Reconciling items per share (in euros) (f)
2.34
(1.35)
Business earnings per share (non-IFRS) (in euros)
3.97
3.39
(a) In 2026, this line mainly comprises the impact of the finalization of the Opella completion accounts as of April 30, 2025. In 2025, this line item includes €2,693 million related to the net gain resulting from the sale of Opella at the date of loss of control (see Note B.1. to the 2025 consolidated financial statements as presented in Sanofi’s 2025 Half year report). (b) The monitoring of impairment indicators for other intangible assets led to the recognition of impairment losses of €1,031 million in the first half of 2026 mainly comprising a €952 million impairment loss taken against the amlitelimab asset..For the six months ended June 30, 2025, this line mainly comprises impairment losses of €210 million linked to research and development projects. (c) For the first half of 2026, Other gains and losses, and litigation represents a charge of €95 million mainly related to major litigation, compared with a charge of €57 million in the first half of 2025. (d) This line item represents the financial expense arising from remeasurement of the liability recognized in the balance sheet for estimated future royalties payable on Beyfortus sales in the United States. (e) Other items include Sanofi’s share of losses from the associates EUROAPI and OPAL JV Co (Opella). (f) Represents the reconciliation between basic earnings per share (IFRS) and business earnings per share (non-IFRS): total reconciling items divided by the weighted average number of shares outstanding.
The most significant reconciling items between “Business net income” and Net income attributable to equity holders of Sanofi relate to (i) the purchase accounting effects of our acquisitions of groups of assets and business combinations, particularly the amortization and impairment of intangible assets (other than software and other rights of an industrial or operational nature); (ii) the impacts of restructuring actions or transactions regarded as non-recurring, where the amounts involved are particularly significant; (iii) the remeasurements recognized through profit or loss in respect of (a) amounts receivable in respect of business divestments and accounted for at fair value, (b) liabilities arising from business combinations (IFRS 3) and accounted for at fair value, (c) liabilities accounted for at amortized cost and subject to periodic remeasurement under IFRS 9; and (iv) the net income from discontinued operations, including Opella. We believe that excluding those impacts enhances an investor’s understanding of our underlying economic performance, because it gives a better representation of our recurring operating performance. We believe that eliminating charges related to purchase accounting effects (particularly amortization and impairment of some intangible assets) enhances comparability of our ongoing operating performance relative to our peers. Those intangible assets (principally rights relating to research and development, technology platforms and commercialization of products) are accounted for in accordance with IAS 38 (Intangible Assets) and IFRS 3 (Business Combinations). We also believe that eliminating the other effects of business combinations (such as the incremental cost of sales arising from the workdown of acquired inventories remeasured at fair value in business combinations) gives a better understanding of our recurring operating performance. Eliminating restructuring costs and similar items enhances comparability with our peers because those costs are incurred in connection with reorganization and transformation Company’s programs, integration or separation as part of material deals. We believe that eliminating the effects of transactions that we regard as non-recurring and that involve particularly significant amounts (such as major gains and losses on disposals, and costs and provisions associated with major litigation and other major non-recurring items) improves comparability from one period to the next.
SANOFI
HALF-YEAR FINANCIAL REPORT 2026
45
Exhibit 99.2 2. Half-year management report
Finally, remeasurements recognized in profit or loss during the period in respect of (i) assets or liabilities accounted for at fair value and recognized in the balance sheet in connection with business acquisitions or divestments or (ii) liabilities accounted for at amortized cost and subject to periodic remeasurement, generally determined on the basis of revised sales forecasts, are not reflective of our operating performance. In addition, “Business net income” excludes net income from the Opella discontinued operation, the results of which have been presented separately in the consolidated income statement since October 2024. Under IFRS 5 (Non-Current Assets Held for Sale and Discontinued Operations), a discontinued operation is defined as a component of an entity that has been disposed of or is classified as held for sale, and represents a separate major line of business. With effect from October 2024, “Business net income” from continuing operations is used by management to measure Sanofi’s financial performance on an ongoing basis. We believe that providing a performance measure aligned with our management approach is useful for investors and analysts. We remind investors, however, that “Business net income” should not be considered in isolation from, or as a substitute for, Net income attributable to equity holders of Sanofi reported in accordance with IFRS. In addition, we strongly encourage investors and potential investors not to rely on any single financial measure but to review our financial statements, including the notes thereto, carefully and in their entirety. We compensate for the material limitations described above by using “Business net income” only to supplement our IFRS financial reporting and by ensuring that our disclosures provide sufficient information for a full understanding of all adjustments included in “Business net income.” Because our “Business net income” and “Business EPS” are not standardized measures, they may not be directly comparable with the non-IFRS financial measures of other companies using the same or similar non-IFRS financial measures.
D.3. Net sales Net sales for the first half of 2026 amounted to €22,106 million, 11.1% higher at published exchange rates than in the first half of 2025. Exchange rate fluctuations had a negative effect of 4.6 percentage points overall, due mainly to adverse trends in the euro exchange rate against the US dollar. At constant exchange rates (CER, see definition below), net sales rose by 15.7%, driven mainly by strong performances for Dupixent, Ayvakit and ALTUVIIIO. Divestments and medicines/portfolio streamlining had a negative impact of 0.4 percentage points on sales growth.
Reconciliation of net sales (IFRS) to net sales at constant exchange rates (non-IFRS) (€ million)
June 30, 2026 (6 months)
June 30, 2025 (6 months)
Change
Net sales
22,106
19,889
+11.1%
19,889
+15.7%
(905)
Effect of exchange rates
23,011
Net sales at constant exchange rates
When we refer to changes in our net sales at constant exchange rates (CER), that means we have excluded the effect of exchange rates by recalculating net sales for the relevant period using the exchange rates that were used for the previous period, with the exception of countries treated as hyperinflationary economies under IAS 29 (i.e. Argentina and Turkey, see Note A.4 to our condensed half-year consolidated financial statements).
D.3.1. Net sales by segment Our net sales comprise the net sales generated by our Biopharma segment. June 30, 2026 (6 months)
June 30, 2025 (6 months)
Change on a reported basis
Change at constant exchange rates
Biopharma segment
22,106
19,889
+11.1%
+15.7%
Total net sales
22,106
19,889
+11.1%
+15.7%
(€ million)
46
SANOFI
HALF-YEAR FINANCIAL REPORT 2026
Exhibit 99.2 2. Half-year management report
D.3.2. Net sales by medicine, vaccine and geography Net sales by main product and geographical region break down as follows: (€ million)
Change Total sales (reported)
Change (CER)
United States
Change (CER)
Europe
Change Rest of (CER) the world
Change (CER)
Immunology Dupixent
9,324
+27.5%
+34.4%
6,922
+39.5%
1,146
+20.9%
1,256
+20.8%
Kevzara
301
+22.9%
+28.6%
207
+45.7%
73
+10.8%
21
-20.7%
ALTUVIIIO (*)
674
+24.4 %
+32.3 %
576
+34.4 %
—
—%
98
+20.9 %
Fabrazyme
523
-0.4 %
+4.0 %
256
+4.6 %
138
+2.2 %
129
+4.6 %
Nexviazyme/Nexviadyme (*)
426
+10.1 %
+14.5 %
211
+15.4 %
152
+15.2 %
63
+10.0 %
Rare diseases
Ayvakit (*)
367
—%
—%
322
—%
44
—%
1
—%
Cerezyme
352
-3.0 %
-1.7 %
86
+1.1 %
126
+5.0 %
140
-8.5 %
Alprolix
282
-7.5 %
-1.6 %
215
-4.2 %
—
—%
67
+7.7 %
Myozyme
220
-20.0 %
-18.2 %
77
-9.9 %
62
-36.1 %
81
-6.9 %
Cerdelga
183
+10.2 %
+14.5 %
101
+21.3 %
74
+7.4 %
8
—%
Cablivi (*)
153
+12.5 %
+16.2 %
87
+29.6 %
58
+5.5 %
8
-20.0 %
Aldurazyme
147
-9.8 %
-7.4 %
36
+8.3 %
44
+2.3 %
67
-19.0 %
Eloctate
142
+5.2 %
+12.6 %
77
-14.4 %
—
—%
65
+81.6 %
Xenpozyme (*)
127
+15.5 %
+18.2 %
47
+6.4 %
44
—%
36
+89.5 %
Wayrilz (*)
27
—%
—%
27
—%
—
—%
—
—%
Qfitlia (*)
12
+1100.0 %
+1200.0 %
12
+1200.0 %
—
—%
—
—%
Myqorzo (*)
3
—%
—%
—
—%
—
—%
3
—%
Sarclisa (*)
354
+28.3 %
+33.0 %
132
+17.6 %
108
+30.1 %
114
+60.8 %
Jevtana
136
-3.5 %
+4.3 %
94
-6.5 %
1
-50.0 %
41
+45.2 %
-0.9 %
Oncology
Other medicines Lantus
813
-7.2 %
-3.8 %
344
-6.6 %
146
-2.7 %
323
Toujeo
729
+5.3 %
+7.5 %
134
+14.3 %
259
+3.6 %
336
+7.9 %
Plavix
440
-7.0 %
-4.4 %
2
—%
40
-9.1 %
398
-4.0 %
Lovenox
364
-18.6 %
-19.2 %
5
-44.4 %
202
-19.4 %
157
-17.8 %
Praluent
317
+18.7 %
+18.4 %
—
—%
265
+25.8 %
52
-8.6 %
Rezurock (*)
296
+12.5 %
+18.3 %
218
+5.5 %
36
+60.9 %
42
+110.0 %
Thymoglobulin
257
+3.6 %
+8.5 %
157
+7.8 %
20
-4.8 %
80
+13.7 %
Aprovel
218
+2.8 %
+4.2 %
1
-66.7 %
33
-5.7 %
184
+7.5 %
Soliqua/iGlarLixi
165
+21.3 %
+24.3 %
53
+27.3 %
24
-3.8 %
88
+33.3 %
Multaq
151
-5.6 %
+0.6 %
137
+1.4 %
5
—%
9
-10.0 %
Apidra
140
—%
+1.4 %
2
-60.0 %
51
-3.8 %
87
+8.4 %
Synvisc
93
-18.4 %
-16.7 %
59
-7.4 %
9
—%
25
-37.8 %
Tzield (*)
37
+27.6 %
+34.5 %
32
+25.9 %
4
+300.0 %
1
—%
Other
1,700
-13.2 %
-11.8 %
162
-29.4 %
514
-13.5 %
1,024
-7.3 %
190
-24.3 %
-21.9 %
7
+700.0 %
181
-22.4 %
2
-88.9 %
Polio/pertussis/Hib primary vaccines and boosters, incl. Heplisav-B (*)
1,364
+0.2 %
+2.8 %
487
+61.3 %
206
-7.6 %
671
-17.2 %
Meningitis, travel, and endemic vaccines
565
-7.2 %
-3.9 %
268
-11.0 %
118
+22.9 %
179
-5.7 %
RSV vaccines (Beyfortus) (*)
392
+10.1 %
+13.2 %
65
+2.9 %
87
+2.4 %
240
+21.2 % -34.3 %
Industrial sales
Vaccines
Influenza, COVID-19 vaccines (*)
121
-43.5 %
-42.1 %
16
-64.8 %
33
-34.6 %
72
Biopharma
22,106
+11.1%
+15.7%
11,633
+29.9%
4,304
+3.6%
6,169
+1.9%
Of which launches (*)
3,047
45.1 %
51.8 %
1,891
+66.9 %
546
+29.6 %
610
+33.2 %
SANOFI
HALF-YEAR FINANCIAL REPORT 2026
47
Exhibit 99.2 2. Half-year management report
D.3.3. Biopharma segment In the first half of 2026, revenue from the Biopharma business (see “Chapter D.1. Segment Information” for detailed segment information) was €22,106 million, up 11.1% on a reported basis and 15.7% at constant exchange rates (CER), driven by Dupixent and new launches. Comments on the performances of our major Biopharma segment products are provided below.
Immunology Dupixent (atopic dermatitis (AD), asthma, chronic rhinosinusitis with nasal polyposis (CRcNP), eosinophilic esophagitis, nodular prurigo (NP), chronic spontaneous urticaria (CSU), chronic obstructive pulmonary disease (COPD), bullous pemphigoid and allergic fungal rhinosinusitis (AFRS)) generated net sales of €9,324 million in the first half of 2026, up 27.5% on a reported basis and 34.4% CER. This growth was driven by strong volume increases across all approved indications, with Dupixent maintaining a leading market position in all its therapeutic indications. In the United States, sales of Dupixent reached €6,922 million in the first half of 2026, up 39.5% CER, driven primarily by strong demand as well as operational improvements and a favorable change in estimated gross-to-net deductions. In Europe, the product’s net sales for the first half of 2026 totaled €1,146 million, up 20.9% CER, reflecting continued momentum in all approved indications and consistent performances in the larger markets, including Germany. In the Rest of the World region, Dupixent posted net sales of €1,256 million (+20.8% CER), mainly supported by Brazil and Canada. Sales of Kevzara (rheumatoid arthritis, other rheumatological indications) amounted to €301 million, representing an increase of 28.6% CER. The majority of sales (€207 million) was generated in the United States (+45.7% CER), mainly due to increased use in the treatment of polymyalgia rheumatica, an indication approved in 2024.
Rare diseases ALTUVIIIO (hemophilia A) generated sales of €674 million in the first half of 2026, with 85.5% of those sales coming from the United States. This performance reflects the transition of patients away from conventional short-acting factor replacement therapies, and to a lesser extent from other non-factor medicines. Sales in the Rest of the World region totaled €98 million, benefiting from launches in Japan and Taiwan. Sales of the factor replacement drug franchise for the treatment of hemophilia A (ALTUVIIIO and Eloctate combined) reached €816 million (+28.4% CER compared with the first half of 2025), driven primarily by the sustained commercial performance of ALTUVIIIO and geographical launches. Eloctate generated €142 million in revenue in the first half of 2026, up 12.6% CER, reflecting the transition of patients to ALTUVIIIO. Sales of the Fabry disease treatment Fabrazyme reached €523 million in the first half of 2026 (+4.0% CER), mainly from increased patient use and price increases in the United States. Nexviazyme/Nexviadyme (Pompe disease) generated revenue of €426 million, up 14.5% CER, driven by 15.2% CER growth in Europe, where the transition of patients from Myozyme/Lumizyme continues. In the United States, growth reached 15.4% CER, with most patients having already made this transition. Sales of the Pompe disease franchise (Nexviazyme/Nexviadyme and Myozyme/Lumizyme) totaled €646 million, up 0.9% CER, with Nexviazyme/Nexviadyme now representing 65.9% of the franchise's revenue. Sales of Ayvakit (systemic mastocytosis) totaled €367 million. These sales were mainly distributed across the United States (€322 million) and Europe (€44 million), with continued growth in the number of patients treated and their duration of treatment. The integration of Blueprint into Sanofi resulted in increased rebates granted to public authorities in the United States, negatively impacting sales. Without these increased rebates in the United States, revenue growth would have been approximately nine percentage points higher. Royalties on sales by CStone Pharmaceuticals in China are recorded in Other revenues. Sales of Cerezyme decreased by 1.7% CER to €352 million. Growth in Europe (+5.0% CER) and the United States (+1.1% CER) was offset by lower sales in the Rest of the World region (-8.5% CER). Sales for the Gaucher disease franchise (Cerezyme and Cerdelga combined) amounted to €535 million. In the first half of 2026, sales of Alprolix amounted to €282 million, down 1.6% CER, driven by a decline in the United States (-4.2%) offset by higher sales in the Rest of the World region (which includes sales of supplies to Sanofi’s collaboration partner Sobi). Sales of Myozyme/Lumizyme decreased by 18.2% CER in the first half of 2026 to €220 million, due to the ongoing shift to Nexviazyme/Nexviadyme as mentioned above. Sales of Cablivi (acquired thrombotic thrombocytopenic purpura) reached €153 million (+16.2% CER) in the first half of the year, driven by an increase in the number of patients treated in the United States (where sales rose by 29.6% CER) and Europe (+5.5 % CER). In the Rest of the World region, sales totaled €8 million (-20.0% CER). Sales of Xenpozyme (acid sphingomyelinase deficiency) increased to €127 million in the first half, up 18.2% CER, mainly driven by the Rest of the World region (+89.5% CER). Sales of Wayrilz (immune thrombocytopenia) amounted to €27 million, exclusively in the United States, following the marketing approval obtained in August 2025. Sales of Qfitlia (hemophilia A and B) reached €12 million, exclusively in the United States, the treatment having been approved in March 2025.
48
SANOFI
HALF-YEAR FINANCIAL REPORT 2026
Exhibit 99.2 2. Half-year management report
Sales of Myqorzo (hypertrophic obstructive cardiomyopathy) amounted to €3 million, entirely in China, following the marketing authorization obtained in January 2026. rovadicitinib (myelofibrosis, no brand name in English) launched in China during the second quarter with sales anticipated to be reported from Q3 2026 results.
Other main medicines Lantus sales were €813 million (-3.8% CER) in the first half of 2026. In the United States, sales were down 6.6% CER. Revenue declined by 2.7 % CER in Europe, and by 0.9 % CER in the Rest of the World region owing to the strategy of switching to Toujeo. Toujeo sales rose by 7.5% CER to €729 million, driven by the United States (+14.3%) and Europe (+3.6%). Toujeo continues to benefit from strong volume growth and increasing market share worldwide. Plavix sales were down 4.4% CER at €440 million, reflecting a decline in the Rest of the World region, which represents the bulk of sales (€398 million, -4.0 % CER). Lovenox sales decreased by 19.2% CER to €364 million, reflecting the sustained impact of biosimilars. Sales of Sarclisa (multiple myeloma) increased to €354 million (+33.0% CER), supported by strong growth in Europe (+30.1% CER), largely fuelled by expanded use among newly diagnosed patients, and in the Rest of the World region (+60.8% CER), which benefited from reimbursement and favorable commercial contracts. In the first half of 2026, Praluent sales increased by 18.4% CER to €317 million, reflecting higher sales in Europe (+25.8% CER), partially offset by a decline in the Rest of the World region (-8.6% CER). Rezurock (chronic graft-versus-host disease, third-line) sales increased to €296 million in the first half of the year, up 18.3% CER. This growth was driven by a strong performance in the Rest of the World region (+110.0% CER, primarily in China), while the United States recorded growth of 5.5% CER and Europe 60.9% CER, benefitting from the conditional marketing authorization granted by the European Commission on March 31, 2026. Thymoglobulin sales rose by 8.5% CER to €257 million, primarily due to higher sales in the Rest of the World region, mainly in China. Aprovel sales were relatively stable at €218 million (+4.2% CER), mainly generated in the Rest of the World region (€184 million, +7.5% CER). Sales of Tzield/Teizeild (type 1 diabetes) reached €37 million (+34.5% CER), of which €32 million were generated in the United States (up 25.9% CER). Launches have begun in Europe (€4 million) and the Rest of the World region (€1 million). Over 1,000 patients have now received treatment with Tzield/Teizeild.
Vaccines In the first half of 2026, Vaccines sales were down 3.8% on a reported basis and down 1.1% CER at €2,443 million, due mainly to lower sales of influenza and meningitis, travel, and endemic vaccines. Sales of Polio/pertussis/Hib primary vaccines and boosters, including Heplisav-B rose by 2.8% CER to €1,364 million. Sales in the United States (€487 million, +61.3% CER) increased thanks to the inclusion of newly acquired Heplisav-B to the portfolio. In the Rest of the World region (€671 million), sales were down 17.2% CER, impacted by a decline in childbirths (mostly in China). Meningitis, Travel and Endemics Vaccines sales decreased by 3.9% CER to €565 million, with a decline in sales in the United States (€268 million, -11.0% CER) partially offset by the performance achieved in Europe (€118 million, +22.9% CER). Beyfortus sales reached €392 million, up 13.2% CER. The moderate increase in US sales (+2.9% CER) was due to a high comparative base resulting from increased inventory levels in the first half of 2025, as well as competitive pressure. Sales in Europe (+2.4% CER ) and the Rest of the World region (+21.2% CER) benefited from ongoing geographical expansion of infant protection, with Beyfortus now protecting infants in more than 45 countries. Sales of Influenza and COVID-19 Vaccines reached €121 million, down 42.1% CER, mainly due to one-offs from late-season immunizations in the US and Europe and lower sales in the Southern Hemisphere, with sales in the Rest of the World region down 34.3% CER at €72 million.
SANOFI
HALF-YEAR FINANCIAL REPORT 2026
49
Exhibit 99.2 2. Half-year management report
D.3.4. Net sales by geographical region (€ million)
June 30, 2026 (6 months)
June 30, 2025 (6 months)
Change on a Change at constant reported basis exchange rates
United States
11,633
9,535
+22.0%
+29.9%
Europe
4,304
4,144
+3.9%
+3.6%
Rest of the World
6,169
6,210
-0.7%
+1.9%
of which China
1,325
1,388
-4.5%
-3.5%
22,106
19,889
+11.1%
+15.7%
Total net sales
In the first half of 2026, net sales in the United States reached €11,633 million, up 22.0% on a reported basis and 29.9% at constant exchange rates, driven by strong growth for Dupixent and pharma launches. Vaccines sales also posted a substantial increase, of 16.8% CER, driven by strong growth in Polio/pertussis/Hib primary vaccines and boosters, including Heplisav-B. In Europe, 2026 first-half net sales rose by 3.9% on a reported basis and 3.6% at constant exchange rates, to €4,304 million. Growth was driven by Dupixent and launches, partially offset by lower sales of other main medicines. In the Rest of the World region, first-half net sales were down 0.7% on a reported basis but up 1.9% at constant exchange rates at €6,169 million. Sales were boosted by Dupixent, which returned to growth after a price adjustment in 2025, and by the three drugs launched in China (Rezurock, Sarclisa, and Myqorzo). This was more than offset by declining sales of established drugs (particularly Plavix) and a marked drop in sales of PPH vaccines due to the decrease in the birth rate in China.
D.4. Other income statement items D.4.1. Other revenues Other revenues decreased by 1.0% to €1,438 million in the first half of 2026 (versus €1,452 million in the first half of 2025). The Other revenues line item includes VaxServe sales of non-Sanofi vaccines, amounting to €746 million (versus €842 million in 2025). In addition, other revenues included manufacturing and other services (€271 million); sales of Opella consumer health products in certain markets (€270 million); royalties (€91 million), and sales of supplies to Opella, etc. (€60 million).
D.4.2. Gross profit Gross profit for the first half of 2026 was €17,389 million, versus €15,460 million for the first half of 2025, a rise of 12.5%. This increase includes a €210 million amortization charge arising from the remeasurement of inventories relating to the Blueprint and Dynavax acquisitions and reported within Cost of sales. This was partially offset by reversals of past provisions for pre-launch inventories amounting to over €200 million, following regulatory approval of Sarclisa SC. Gross margin (the ratio of gross profit to net sales) also increased, reaching 78.7% in the first half of 2026 (versus 77.7% in the first half of 2025). In the first half of 2026, the business gross profit was €17,599 million and increased by 13.8% from €15,460 million in the first half of 2025. Business gross profit is a non-IFRS indicator that fully excludes from gross profit under IFRS the effect of the release of the fair value step-up to inventory that is recognised upon acquisition, amounting to €210 million for the first half of 2026 and nil for the first half of 2025 (please refer to D.2. reconciling Net income attributable to equity holders of Sanofi to “Business net income”).
D.4.3. Research and development expenses Research and development expenses (R&D expenses) in the first half of 2026 totaled €3,980 million, versus €3,717 million in the first half of 2025, a year-on-year increase of 7.1%. The increase includes more than €200 million of wind-down costs from decisions made on the pipeline. R&D expenses represented 18.0% of net sales, compared with 18.7% in the first half of 2025.
D.4.4. Selling and general expenses Selling and general expenses amounted to €4,792 million in the first half of 2026 (21.7% of net sales), versus €4,506 million in the first half of 2025 (22.7% of net sales). The year-on-year increase of 6.3% was elevated by the consolidation of recent acquisitions: Blueprint (July 2025) and Dynavax (February 2026). The ratio of selling and general expenses to net sales was 1.0 percentage point lower than in the first half of 2025.
50
SANOFI
HALF-YEAR FINANCIAL REPORT 2026
Exhibit 99.2 2. Half-year management report
D.4.5. Other operating income and expenses Other operating income amounted to €800 million in the first half of 2026 (versus €533 million in the first half of 2025), and Other operating expenses to €3,436 million (versus €2,476 million in the first half of 2025). Overall, Other operating income and expenses represented a net expense of €2,636 million in the first half of 2026, compared with a net expense of €1,943 million in the first half of 2025, as shown in the table below. June 30, 2026 (6 months)
June 30, 2025 (6 months)
Net gains / (losses) on disposals of operating assets or businesses
241
344
Amvuttra licensing income
398
120
Other
161
69
800
533
(3,486)
(2,475)
(€ million)
Total other operating income Regeneron alliance: (i) (Profit)/loss sharing (ii) Additional profit share for development cost from Regeneron
594
494
(iii) Selling expense reimbursements to Regeneron
(336)
(346)
Other
(208)
(149)
(3,436)
(2,476)
Total other operating expenses
D.4.6. Amortization of intangible assets Amortization charged against intangible assets in the first half of 2026 amounted to €1,087 million, versus €777 million in the first half of 2025. The increase is mainly related to amortization of intangible assets recognized in the first half of 2026 following the Blueprint and Dynavax acquisitions.
D.4.7. Impairment of intangible assets The monitoring of impairment indicators for other intangible assets (excluding software) led to the recognition of impairment losses of €1,031 million in the first half of 2026, mainly comprising a €952 million impairment loss taken against the amlitelimab asset, corresponding to the entire carrying amount of this intangible asset.
D.4.8. Fair value remeasurement of contingent consideration Fair value remeasurements of contingent consideration assets and liabilities relating to business combinations (recognized in accordance with IFRS 3) represented a net expense of €37 million in the first half of 2026, versus a net expense of €61 million in the first half of 2025.
D.4.9. Restructuring costs and similar items Restructuring costs and similar items amounted to a charge of €563 million in the first half of 2026, compared with a charge of €430 million in the first half of 2025. The charge recognized in the first half 2026 mainly includes €284 million of employeerelated expenses (compared with an expense of €201 million for the first half of 2025) and €179 million of charges, gains or losses on assets (compared with an expense of €109 million for the first half of 2025).
D.4.10. Other gains and losses, and litigation For the first half of 2026, Other gains and losses, and litigation represents a charge of €95 million mainly related to major litigation, compared with a charge of €57 million in the first half of 2025.
D.4.11. Operating income Operating income amounted to €3,168 million in the first half of 2026, versus €3,759 million in the first half of 2025. The yearon-year change was mainly due to the increase in Other operating expenses.
D.4.12. Financial income and expenses Net financial expenses were €328 million in the first half of 2026, €151 million higher than the 2025 first-half figure of €177 million. The 2026 first-half figure includes a financial expense of €146 million (€50 million for the first half of 2025) arising from the remeasurement of the liability recorded in the balance sheet for estimated future royalties on Beyfortus sales in the United States. Our cost of net debt (see the definition in Section D.7., “Consolidated balance sheet” below) was €135 million in the first half of 2026, compared with €57 million in the first half of 2025.
SANOFI
HALF-YEAR FINANCIAL REPORT 2026
51
Exhibit 99.2 2. Half-year management report
D.4.13. Income before tax and investments accounted for using the equity method Income before tax and investments accounted for using the equity method for the first half of 2026 was €2,840 million, versus €3,582 million for the first half of 2025.
D.4.14. Income tax expense Income tax expense totaled €871 million in the first half of 2026, versus €711 million in the first half of 2025, giving an effective tax rate (based on consolidated net income) of 30.6%, versus 19.8% in the first half of 2025. The increase in the effective tax rate was mainly due to the non-deductibility of current year impairment losses taken against the amlitelimab intangible asset. The effective tax rate on our “Business net income”(1) is a non-IFRS financial measure. It is calculated on the basis of business operating income, minus net financial expenses and before (i) the share of profit/loss from investments accounted for using the equity method and (ii) net income attributable to non-controlling interests. We believe the presentation of this measure, used by our management, is also useful for investors as it provides a means of analyzing the effective tax cost of our current business activities. It should not be seen as a substitute for the effective tax rate based on consolidated net income. When calculated on business net income, our effective tax rate was 21.8% in the first half of 2026, compared with 21.0% in the first half of 2025 and 19.9% for 2025 as a whole. The main factors include (i) movements in deferred tax assets related to the amlitelimab intangible asset and (ii) the year-on-year change arising from the full effects of the 2026 portion of the temporary exceptional surcharge in France based on 2025 taxable profits.
D.4.15. Share of profit/(loss) from investments accounted for using the equity method Share of profit/(loss) from investments accounted for using the equity method showed net income of €2 million for the first half of 2026 (including a net loss of €39 million for Sanofi’s share of losses from the associate OPAL JV Co), versus net income of €85 million for the first half of 2025 (including net income of €11 million for Sanofi’s share of profits from the associate OPAL JV Co for the period from May 1, 2025 through June 30, 2025).
D.4.16. Net income from continuing operations Net income from continuing operations amounted to €1,971 million in the first half of 2026, compared with €2,956 million in the first half of 2025.
D.4.17. Net income from discontinued operations In the first half of 2026, Net income from discontinued operations amounted to €26 million, mainly comprising the impact of the finalization of the Opella completion accounts, versus €2,881 million in the first half of 2025. The 2025 first-half figure included (i) the net income of Opella until the date of loss of control and (ii) a net gain of €2,693 million resulting from the divestment of Opella as of the date of loss of control.
D.4.18. Net income Net income amounted to €1,997 million in the first half of 2026, versus €5,837 million in the first half of 2025; the 2025 first-half figure included the €2,693 million gain on the divestment of Opella.
D.4.19. Net income attributable to non-controlling interests Net income attributable to non-controlling interests for the first half of 2026 was €40 million, against €25 million for the first half of 2025.
D.4.20. Net income attributable to equity holders of Sanofi Net income attributable to equity holders of Sanofi amounted to €1,957 million in the first half of 2026, versus €5,812 million in the first half of 2025. Basic earnings per share (EPS) was €1.63, compared with €4.74 for the first half of 2025, based on an average number of shares outstanding of 1,200.4 million for the first half of 2026 and 1,225.5 million for the first half of 2025. Diluted earnings per share was €1.62, versus €4.72 for the first half of 2025, based on an average number of shares after dilution of 1,205.5 million for the first half of 2026 and 1,230.7 million for the first half of 2025.
D.5. Segment results For the Biopharma segment, business operating income (see definition and details in note B.21.1 to the condensed half-year consolidated financial statements) amounted to €6,258 million in the first half of 2026, compared with €5,363 million in the first half of 2025, an increase of 16.7%. It represents 28.3% of sales, compared with 27.0% in the first half of 2025.
(1)
See definition in section D.2., “Business net income”.
52
SANOFI
HALF-YEAR FINANCIAL REPORT 2026
Exhibit 99.2 2. Half-year management report
D.6. Consolidated statements of cash flows Summarized consolidated statements of cash flows: (€ million) (a) Net cash provided by/(used in) continuing operating activities
June 30, 2026 (6 months)
June 30, 2025 (6 months)
4,643
3,367
—
188
Net cash provided by/(used in) operating activities
4,643
3,555
Net cash provided by/(used in) continuing investing activities
(2,423)
(1,979)
—
(36)
(220)
10,742
Net cash provided by/(used in) operating activities of the discontinued Opella business
Net cash provided by/(used in) investing activities of the discontinued Opella business Net cash inflow/(outflow) from the Opella transaction
(b)
Net cash provided by/(used in) investing activities
(2,643)
8,727
Net cash provided by/(used in) continuing financing activities
(3,332)
(4,441)
—
(48)
Net cash provided by/(used in) financing activities of the discontinued Opella business Net cash provided by/(used in) financing activities
(3,332)
(4,489)
Impact of exchange rates on cash and cash equivalents
19
(42)
Cash and cash equivalents reclassified as “Assets held for sale” as of December 31, 2024
—
167
(1,313)
7,918
Net change in cash and cash equivalents Cash and cash equivalents, beginning of period (c)
7,663
7,441
Cash and cash equivalents, end of period
6,350
15,359
(a) Opella's cash flows are presented separately in accordance with IFRS 5 (Non-current Assets Held for Sale and Discontinued Operations). (b) For the six months ended June 30, 2025, this amount includes €(667) million in respect of cash and cash equivalents held by Opella as of April 30, 2025. (c) Includes the impact of the IFRS 9 amendment relating to the classification of financial instruments applicable from January 1, 2026.
Net cash provided by/(used in) continuing operating activities represented a net cash inflow of €4,643 million in the first half of 2026, against €3,367 million in the first half of 2025. This increase was mainly driven by a higher level of operating cash flow before changes in working capital (€5,233 million in the first half of 2026 versus €3,980 million in the first half of 2025). Working capital requirements decreased by €590 million in the first half of 2026, versus a decrease of €613 million in the first half of 2025. Net cash provided by/(used in) continuing investing activities represented a net cash outflow of €2,423 million in the first half of 2026. The principal cash outflow in the first half of 2026 was the €1,403 million arising from the acquisition of Dynavax (see Note B.1.1.). That compares with a net cash outflow of €1,979 million in the first half of 2025, including the impact of the acquisition of Dren-0201, Inc. for €539 million. Acquisitions of property, plant and equipment and intangible assets totaled €1,296 million, versus €1,420 million in the first half of 2025. There were €882 million of acquisitions of property, plant and equipment (versus €845 million in the first half of 2025), corresponding primarily to investments in industrial facilities. Acquisitions of intangible assets (€414 million, versus €575 million in the first half of 2025) mainly comprised contractual payments for intangible rights, primarily under license and collaboration agreements. Proceeds from disposals net of tax (excluding disposals of consolidated entities and investments accounted for using the equity method) amounted to €424 million in the first half of 2026, compared with €434 million for the first half of 2025, and related mainly to divestments of assets and operations relating to portfolio streamlining and to disposals of equity and debt instruments. Net cash provided by/(used in) continuing financing activities represented a net cash outflow of €3,332 million in the first half of 2026, compared with a net outflow of €4,441 million in the first half of 2025. The 2026 first-half figure includes (i) the dividend payout to our shareholders of €4,923 million (versus €4,772 million in the first half of 2025); (ii) €2,607 million of net external debt contracted (versus net external debt contracted of €4,332 million in the first half of 2025); and (iii) movements in Sanofi’s share capital, including purchases of treasury shares and the related tax effects of €1,009 million, versus €4,003 million in the first half of 2025. Net cash flows from the Opella transaction represented a net cash outflow of €220 million in the first half of 2026, versus a net cash inflow of €10,742 million in the first half of 2025. The net change in cash and cash equivalents in the first half of 2026 was a decrease of €1,313 million, compared with an increase of €7,918 million in the first half of 2025.
SANOFI
HALF-YEAR FINANCIAL REPORT 2026
53
Exhibit 99.2 2. Half-year management report
“Free cash flow” is a non-IFRS financial measure which is reviewed by our management, and which we believe provides useful information to measure the net cash generated from the Company’s operations that is available for strategic investments(1) (net of divestments(1)), for debt repayment, and for payments to shareholders. “Free cash flow” is determined from business net income(2) after adding back (in the case of expenses and losses) or deducting (in the case of income and gains) the following items: depreciation, amortization and impairment, share of undistributed earnings from investments accounted for using the equity method, gains & losses on disposals of non-current assets, net change in provisions (including pensions and other postemployment benefits), deferred taxes, share-based payment expense and other non-cash items. It also includes net changes in working capital, capital expenditures and other asset acquisitions(3) net of disposal proceeds(3) and payments related to restructuring and similar items. “Free cash flow” is not defined by IFRS, and is not a substitute for Net cash provided by/(used in) operating activities as reported under IFRS. Management recognizes that the term “Free cash flow” may be interpreted differently by other companies and under different circumstances. The table below sets forth a reconciliation between Net cash provided by/(used in) operating activities and “Free cash flow”: (€ million) Net cash provided by/(used in) operating activities(a) Net cash provided by/(used in) operating activities of the discontinued Opella business
June 30, 2026 (6 months)
June 30, 2025 (6 months)
4,643
3,555
—
(188)
Acquisitions of property, plant and equipment and software
(967)
(873)
Acquisitions of intangible assets, equity interests and other non-current financial assets(b)
(534)
(986)
Proceeds from disposals of property, plant and equipment, intangible assets and other non-current assets, net of tax(b)
361
434
Repayment of lease liabilities
(147)
(124)
Other items (c)
368
640
3,724
2,458
Free cash flow (non-IFRS) (d)
(a) Most directly comparable IFRS measure to free cash flow. (b) Not exceeding a cap of €500 million per transaction. (c) This line item includes cash outflows from major litigation not included in “Free cash flow”, in particular Plavix Hawaii in 2025. (d) Non-IFRS financial measure (see definition above).
D.7. Consolidated balance sheet Total assets were €129,060 million as of June 30, 2026, versus €126,805 million as of December 31, 2025, representing an increase of €2,255 million. Net debt was €15,513 million as of June 30, 2026, versus €11,008 million as of December 31, 2025. We believe the presentation of this non-IFRS financial measure, which is reviewed by our management, provides useful information to measure our overall liquidity and capital resources. We define “net debt” as (i) the sum total of short-term debt, long-term debt, and interest rate derivatives and currency derivatives used to manage debt, minus (ii) the sum total of cash and cash equivalents and interest rate derivatives and currency derivatives used to manage cash and cash equivalents. (€ million)
June 30, 2026
December 31, 2025
Long-term debt
14,646
14,248
Short-term debt and current portion of long-term debt
7,026
4,342
221
112
Total debt (IFRS)
21,893
18,702
Cash and cash equivalents
(6,350)
(7,657)
Interest rate and currency derivatives used to manage debt
Interest rate and currency derivatives used to manage cash and cash equivalents
(30)
(37)
Net debt (a) (non-IFRS)
15,513
11,008
Total equity
69,567
71,710
Gearing ratio (non-IFRS)
22.3 %
15.4 %
(a) Net debt does not include lease liabilities, which amounted to €1,904 million as of June 30, 2026 and €1,739 million as of December 31, 2025.
To assess our financing risk, we use the “gearing ratio”, another non-IFRS financial measure. This ratio (which we define as the ratio of net debt to total equity) rose from 15.4% as of December 31, 2025 to 22.3% as of June 30, 2026. Analyses of our debt as of June 30, 2026 and December 31, 2025 are provided in Note B.9. to our condensed half-year consolidated financial statements. Because our “net debt” and “gearing ratio” are not standardized measures, they may not be directly comparable with the non-IFRS financial measures of other companies using the same or similar non-IFRS financial measures. Despite the use of non(1)
Above a cap of €500 million per transaction. Non-IFRS financial measure, as defined in “Business net income” above. (3) Not exceeding a cap of €500 million per transaction. (2)
54
SANOFI
HALF-YEAR FINANCIAL REPORT 2026
Exhibit 99.2 2. Half-year management report
IFRS measures by management in setting goals and measuring performance, these measures have no standardized meaning prescribed by IFRS. We expect that the future cash flows generated by our operating activities will be sufficient to repay our debt. The financing arrangements in place as of June 30, 2026 at the Sanofi parent company level are not subject to covenants regarding financial ratios and do not contain any clauses linking credit spreads or fees to Sanofi’s credit rating. Other key movements in the balance sheet are described below. Total equity was €69,567 million as of June 30, 2026, versus €71,710 million as of December 31, 2025. The net change reflects the following principal factors: • an increase representing our net income for the first half of 2026 (€1,997 million); • an increase of €1,802 million due to currency translation differences arising on the financial statements of foreign subsidiaries, mainly due to movements in the US dollar; • a decrease representing the dividend payout to our shareholders of €4,923 million; and • the repurchase by Sanofi of 12,571,455 of its own shares during the first half of 2026 for a total amount of €1,003 million, plus €3 million of related tax payments. As of June 30, 2026 we held 16.03 million of our own shares, recorded as a deduction from equity and representing 1.320% of our share capital. Goodwill and Other intangible assets (€68,313 million in total) increased by €752 million, due mainly to the Dynavax acquisition and the impact of exchange rates (particularly the fluctuation in the US dollar), partly offset by amortization and impairment recognized on other intangible assets during the period. Investments accounted for using the equity method (€3,207 million) decreased by €52 million. Other non-current assets (€4,732 million) increased by €368 million. Net deferred tax assets were €7,210 million as of June 30, 2026, compared with €6,942 million as of December 31, 2025, an increase of €268 million. Non-current provisions and other non-current liabilities (€6,848 million) were €145 million higher than at December 31, 2025. Liabilities related to business combinations and to non-controlling interests (€652 million) increased by €67 million.
SANOFI
HALF-YEAR FINANCIAL REPORT 2026
55
Exhibit 99.2 2. Half-year management report
E/ Risk factors and related party transactions E.1. Risk factors The main risk factors to which Sanofi is exposed are described in the 2025 Form 20-F for the year ended December 31, 2025, filed with the US Securities and Exchange Commission on February 17, 2026(1). Any of those risks, and others that we may not yet have identified, could materialize during the second half of 2026 or during subsequent periods, and could cause actual results to differ materially from those described elsewhere in this report.
E.2. Related party transactions Our principal related parties are defined in Note D.33. to our consolidated financial statements included in the 2025 Form 20-F (page F-93)(1). Note B.5. to our condensed half-year consolidated financial statements provides a description of the main transactions and balances for the six months ended June 30, 2026 with equity-accounted entities that qualify as related parties. Sanofi did not enter into any transactions with key management personnel during the first half of 2026. Financial relations with the Group’s principal shareholders fall within the ordinary course of business and were immaterial in the first half of 2026.
(1)
Available on our corporate website: www.sanofi.com.
56
SANOFI
HALF-YEAR FINANCIAL REPORT 2026
Exhibit 99.2 2. Half-year management report
F/ Outlook In 2026, Sanofi net sales are now expected to grow by around 10% at constant exchange rates (1) (CER). Business earnings per share (2) (Business EPS) is expected to grow slightly faster than sales. Applying July 2026 average currency exchange rates, currency impacts are estimated at approximately -1% on sales and at approximately -2% on Business EPS. Full-year business net income(1) for 2025 was €9,555 million, resulting in Business earnings per share of €7.83. This guidance was prepared on a basis comparable with that used to prepare our historical financial information, and in accordance with Sanofi accounting policies. It was also prepared on the basis of assumptions established by Sanofi and its subsidiaries, including but not limited to: • • • • • • •
trends in the competitive environment, in terms of innovative products and launches of generics; respect for our intellectual property rights; progress on our research and development programs; the impact of, and progress on, our operating cost containment policy; trends in exchange rates and interest rates; integration of the contribution from acquisitions; and the average number of shares outstanding.
Some of the above information, estimates and assumptions are derived from or rely on, in full or in part, judgments and decisions made by Sanofi management which may change or be amended in future.
(1) (2)
Non-IFRS financial measure. For a definition, see Section D.3., “Net Sales” above. Non-IFRS financial measure. For a definition, see Section D.2., “Business net income” above.
SANOFI
HALF-YEAR FINANCIAL REPORT 2026
57
Exhibit 99.2 2. Half-year management report
Forward-looking statements This document contains forward-looking statements as defined in the US Private Securities Litigation Reform Act of 1995, as amended. Forward-looking statements are statements that are not historical facts. These statements include projections and estimates and their underlying assumptions, statements regarding plans, objectives, intentions, and expectations with respect to future financial results, events, operations, services, product development and potential, and statements regarding future performance. Words such as “believe”, “anticipate”, “can”, “contemplate”, “could”, “plan”, “expect”, “intend”, “is designed to”, “may”, “might”, “plan”, “potential”, “objective” “target”, “estimate”, “project”, “predict”, “forecast”, “ambition”, “guideline”, “should”, “will”, “estimates”, “plans” or the negative of these and similar expressions are intended to identify forward-looking statements but are not the exclusive means of identifying such statements. Forward-looking statements are generally identified by the words “expects”, “anticipates”, “may”, “is considering”, “believes”, “intends”, “envisages”, “aims”, “plans”, “is designed to”, “could”, “forecasts”, “predicts”, “potential”, “objective”, “estimates”, “projects”, “is programming”, “is likely to” and “wants” or the negative thereof, and similar expressions. Although Sanofi’s management believes that the expectations reflected in such forward-looking statements are reasonable, investors are cautioned that forward-looking information and statements are subject to various risks and uncertainties, many of which are difficult to predict and generally beyond the control of Sanofi, that could cause actual results and developments to differ materially from those expressed in, or implied or projected by, the forward-looking information and statements. These risks and uncertainties include among other things, the uncertainties inherent in research and development, future clinical data and analysis, including post marketing, decisions by regulatory authorities, such as the FDA or the EMA, regarding whether and when to approve any drug, device or biological application that may be filed for any such product candidates as well as their decisions regarding labelling and other matters that could affect the availability or commercial potential of such product candidates, the fact that product candidates if approved may not be commercially successful, the future approval and commercial success of therapeutic alternatives, Sanofi’s ability to benefit from external growth opportunities, to complete related transactions and/or obtain regulatory clearances, risks associated with intellectual property and any related pending or future litigation and the ultimate outcome of such litigation, trends in exchange rates and prevailing interest rates, volatile economic and market conditions, cost containment initiatives and subsequent changes thereto, and the impact that global crisis may have on us, our customers, suppliers, vendors, and other business partners, and the financial condition of any one of them, as well as on our employees and on the global economy as a whole. The risks and uncertainties also include the uncertainties discussed or identified in the public filings with the U.S. Securities and Exchange Commission (SEC) and the French Autorité des marchés financiers (AMF) made by Sanofi, including those listed under “Risk Factors” and “Cautionary Statement Regarding Forward-Looking Statements” in Sanofi’s Annual Report on Form 20-F for the year ended December 31, 2025. For an update on litigation, refer to Note B.14. “Legal and arbitration proceedings” to our condensed half-year consolidated financial statements for the six months ended June 30, 2026, and to section “A.3.2. Legal and arbitration proceedings”, and section “E/ Risk factors and related party transactions”, of this half-year management report. With respect to any sustainability or environmental, social and governance (ESG)-related information contained herein, in light of the significant uncertainties inherent in such statements and other related information contained herein, investors should not regard these statements as a representation or warranty by Sanofi or any other person that Sanofi will achieve its goals, objectives, aspirations, metrics, plans or targets in any specified time frame or at all, including with respect to ESG and sustainability matters, and such statements and other information are dependent on future market factors, such as customer demand, continued technological progress, policy support and timely rule-making or continuation of government incentives and funding, and are forward-looking statements. Sanofi’s ability to achieve goals, objectives, aspirations, metrics, plans or targets in any specified time frame or at all, including with respect to ESG and sustainability matters, is subject to other conditions and considerations, both within and outside Sanofi’s control, that may affect its ability to meet such goals, objectives, aspirations, metrics, plans or targets, and/or put in place the initiatives required to meet them. Such conditions and considerations include but are not limited to the risk factors described above. In addition, historical, current, and forward-looking environmental and other ESG or sustainability-related statements may be based on standards for measuring progress that are still developing, internal controls and processes that continue to evolve, and assumptions that are subject to change in the future, including future laws and rulemaking. Sanofi plans to continue to evaluate its goals, objectives, aspirations, metrics, plans and targets and its approach to them and may make adjustments as it deems necessary in light of such considerations. Other than as required by applicable law, Sanofi does not undertake any obligation to update or revise any forward-looking information or statements. All trademarks mentioned in this document are protected and are either trademarks owned by Sanofi and/or its subsidiaries, or trademarks licensed to Sanofi and/or its subsidiaries, or trademarks owned by third parties (including Regeneron and Sobi).
58
SANOFI
HALF-YEAR FINANCIAL REPORT 2026
Exhibit 99.2 2. Half-year management report
G/ Appendix - research and development pipeline R&D Pipeline Registration Name
Description
Indication
venglustat
Oral GCS inhibitor
Gaucher disease type 3 (US, EU, JP)
Sarclisa
CD38 mAb subcutaneous
Multiple myeloma (CN)
Fluzone HD
Multivalent inactivated vaccine
Influenza 50 years+ (US, EU)
SP0087
Vero cell vaccine
Rabies (EU)
Phase 3 Name
Description
Indication
Immunology
Name
Description
Indication
Rare diseases
Dupixent (a)
IL4R mAb
Chronic pruritus of unknown origin
Nexviazyme
Enzyme replacement therapy
Infantile-onset Pompe disease (US)
duvakitug (b)
TL1A mAb
Crohn’s disease Ulcerative colitis
elenestinib
D816V-mutated KIT inhibitor
Indolent/smoldering systemic mastocytosis
lunsekimig
IL13×TSLP Nanobody® VHH
Chronic obstructive pulmonary disease
fitusiran
RNAi targeting antithrombin
Hemophilia A and B (EU, JP)
Rezurock
ROCK2 inhibitor
Chronic lung allograft dysfunction
Wayrilz
BTK inhibitor
Sickle cell disease IgG4-related disease Warm autoimmune hemolytic anemia
frexalimab
CD40L mAb
Kidney transplant rejection
frexalimab (c)
CD40L mAb
Relapsing MS Non-relapsing secondary progressive MS
CD38 mAb
NDMM, TE (HD7) NDMM, TE (IsKia) Smoldering MM (ITHACA)
riliprubart
C1s mAb
IVIg-treated CIDP
Vero cell vaccine
Yellow fever
21-valent conjugate vaccine
Pneumococcal disease (children)
Neurology
Oncology Sarclisa
Vaccines SP0218 SP0202
(d)
Collaborations: (a) Regeneron; (b) Teva Pharmaceuticals; (c) ImmuNext; (d) SK bioscience. Abbreviations: BTK: Bruton’s tyrosine kinase – CD: Cluster of differentiation – C1s: Complement component 1s – CIDP: Chronic inflammatory demyelinating polyneuropathy – CN: China –EU: Europe – GCS: Glucosylceramide synthase – HD: High dose – IgG4: Immunoglobulin G4 – IL: Interleukin – IVIg: Intravenous immunoglobulin – JP: Japan – mAb: Monoclonal antibody - MM: Multiple myeloma - MS: Multiple sclerosis - NDMM: Newly diagnosed multiple myeloma - RNAi: RNA interference - ROCK2: Rho Associated coiled-coil containing protein kinase 2 – TE: Transplant eligible – TL1A: Tumor necrosis factor-like cytokine 1A – TSLP: Thymic stromal lymphopoietin
SANOFI
HALF-YEAR FINANCIAL REPORT 2026
59
Exhibit 99.2 2. Half-year management report
Phase 2 Name
Description
Indication
Description
Indication
brivekimig
TNFa×OX40L Nanobody® VHH
Crohn’s disease Hidradenitis suppurativa Ulcerative colitis Type 1 diabetes, stage 3
Wayrilz
BTK inhibitor
Graves' disease
frexalimab(a)
CD40L mAb
Type 1 diabetes, stage 3
efdoralprin alfa
AAT fusion protein
Alpha-1 antitrypsin deficiency emphysema
lunsekimig
IL13×TSLP Nanobody® VHH
Asthma Asthma, high-risk Chronic rhinosinusitis with nasal polyps
frexalimab rilzabrutinib brivekimig
CD40L mAb BTK inhibitor TNFa×OX40L Nanobody® VHH
Focal segmental glomerulosclerosis/ minimal change disease
SAR449028
Wild-type KIT inhibitor
Chronic urticaria
Immunology
SAR444336 SAR445399
(1)
Rare diseases
Non-beta IL2 Synthorin Microscopic colitis
Oncology
IL1R3 mAb
SAR445877
PD1×IL15 fusion protein
Solid tumors
Sarclisa
CD38 mAb
Relapsed/refractory multiple myeloma in combination
mRNA vaccine
RSV+hMPV (older adults)
Hidradenitis suppurativa
Neurology SAR402663
Name
Vaccines sFLT01 AAV gene therapy
Wet age-related macular degeneration
SP0256 SP0268
mRNA vaccine
Acne
SP0289
mRNA vaccine
Influenza H5 pandemic
SP0335
Inactivated adjuvanted vaccine
Influenza H5 pandemic
Name
Description
Indication
Phase 1 Name
Description
Indication
Oncology
Immunology SAR446422
CD28×OX40 bispecific Ab
Inflammatory indication
SAR445953 (b)
CEACAM5-Topo1 ADC
Colorectal cancer
SAR448501
CD20 bispecific mAb
Inflammatory indication
SAR446523
GPRC5D mAb
Relapsed/refractory multiple myeloma
SAR447971
IRAK4 degrader
Hidradenitis suppurativa
SAR449336
Pan KRAS inhibitor
Colorectal cancer
Neurology
Vaccines
SAR446597
Bb×C1s AAV gene therapy
Geographic atrophy in dry age-related macular degeneration
SP0287
Fluzone HD+Nuvaxovid
Influenza+COVID-19
SAR448851
TREM2 agonist
Alzheimer’s disease
SP0287
Flublok+Nuvaxovid
Influenza+COVID-19
SP0291
mRNA vaccine
RSV+hMPV+PIV3 (older adults)
SP0269
mRNA vaccine
Chlamydia
SP0340
Subunit vaccine
RSV+hMPV (older adults)
SP0341
Subunit vaccine
RSV+hMPV+PIV3 (older adults)
SP0342
Subunit adjuvanted vaccine
Shingles
Rare diseases SAR446268
DMPK AAV gene therapy
Myotonic dystrophy type 1
(1) Also known as MAB212, in-licensed from MAB Discovery. Collaborations: (a) ImmuNext; (b) Pfizer Abbreviations: AAT: Alpha–1 antitrypsin – AAV: Adeno-associated virus – Ab: Antibody – ADC: Antibody-drug conjugate – Bb: Factor Bb – BTK: Bruton’s tyrosine kinase – C1s: Complement component 1s – CD: Cluster of differentiation – CEACAM5: Carcinoembryonic antigen cell adhesion molecule 5 – DMPK: dystrophia myotonica protein kinase 1 – GPRC5D: G-protein-coupled receptor class 5 member D – H5: hemagglutinin 5 - hMPV: human Metapneumovirus - JAK: Janus kinase – KRAS: V-Ki-ras2 Kirsten rat sarcoma viral oncogene homolog - IL: Interleukin – IL1R3: Interleukin-1 receptor 3 – mAb: Monoclonal antibody – mRNA: messenger RNA – PD1: Programmed death protein 1 – PIV3: Parainfluenza virus type 3 – RSV: Respiratory syncytial virus – TNFa: Tumor necrosis factor alpha – TNFR1: Tumor necrosis factor receptor 1 – Topo1: Topoisomerase - TREM2: triggering receptor expressed on myeloid cells 2 – TSLP: Thymic stromal lymphopoietin
60
SANOFI
HALF-YEAR FINANCIAL REPORT 2026
Exhibit 99.2 3. Statutory auditors’ review report on the half-yearly financial information
-
Statutory auditors’ review report on the half-yearly financial information Period from January 1 to June 30, 2026 To the Shareholders, In compliance with the assignment entrusted to us by your Annual General Meetings and in accordance with the requirements of article L. 451-1-2 III of the French Monetary and Financial Code ("Code monétaire et financier"), we hereby report to you on: • the review of the accompanying (condensed) half-yearly consolidated financial statements of Sanofi, for the period from January 1, 2026 to June 30, 2026; • the verification of the information presented in the half-yearly management report. These condensed half-yearly consolidated financial statements are the responsibility of the Board of Directors. Our role is to express a conclusion on these financial statements based on our review.
-
Conclusion on the financial statements We conducted our review in accordance with professional standards applicable in France. A review of interim financial information consists of making inquiries, primarily of persons responsible for financial and accounting matters, and applying analytical and other review procedures. A review is substantially less in scope than an audit conducted in accordance with professional standards applicable in France and consequently does not enable us to obtain assurance that we would become aware of all significant matters that might be identified in an audit. Accordingly, we do not express an audit opinion. Based on our review, nothing has come to our attention that causes us to believe that the accompanying condensed half-yearly consolidated financial statements are not prepared, in all material respects, in accordance with IAS 34 – standard of the IFRSs as adopted by the European Union applicable to interim financial information.
-
Specific verification We have also verified the information presented in the half-yearly management report on the condensed half-yearly consolidated financial statements subject to our review. We have no matters to report as to its fair presentation and consistency with the condensed half-yearly consolidated financial statements. Neuilly-sur-Seine and Levallois-Perret, July 30 2026.
The statutory auditors French original signed by PricewaterhouseCoopers Audit Anne-Claire Ferrié
Amélie Graffan
Forvis Mazars SA Loïc Wallaert
Ariane Mignon
This is a free translation into English of the statutory auditors’ review report on the half-yearly financial information issued in French and is provided solely for the convenience of English-speaking users. This report includes information relating to the specific verification of information given in the Group’s half-yearly management report. This report should be read in conjunction with, and construed in accordance with, French law and professional standards applicable in France.
SANOFI
HALF-YEAR FINANCIAL REPORT 2026
61
Exhibit 99.2 4. Responsibility statement of the certifying officer: half-year financial report
- Responsibility statement of the certifying officer: half-year financial report “I hereby certify that, to the best of my knowledge, the condensed half-year consolidated financial statements have been prepared in accordance with the applicable accounting standards and give a true and fair view of the assets and liabilities, financial position and net income of the Company and the entities included in the scope of consolidation, and that the half-year management report starting on page 35 provides an accurate overview of the significant events of the first six months of the financial year with their impact on the half-year consolidated financial statements, together with the major transactions with related parties and a description of the main risks and uncertainties for the remaining six months of the financial year.” Paris, July 30, 2026 Belén Garijo Chief Executive Officer
62
SANOFI
HALF-YEAR FINANCIAL REPORT 2026
Notes ................................................................................................................................................................................................................................................................. ................................................................................................................................................................................................................................................................. ................................................................................................................................................................................................................................................................. ................................................................................................................................................................................................................................................................. ................................................................................................................................................................................................................................................................. ................................................................................................................................................................................................................................................................. ................................................................................................................................................................................................................................................................. ................................................................................................................................................................................................................................................................. ................................................................................................................................................................................................................................................................. ................................................................................................................................................................................................................................................................. ................................................................................................................................................................................................................................................................. ................................................................................................................................................................................................................................................................. ................................................................................................................................................................................................................................................................. ................................................................................................................................................................................................................................................................. ................................................................................................................................................................................................................................................................. ................................................................................................................................................................................................................................................................. ................................................................................................................................................................................................................................................................. ................................................................................................................................................................................................................................................................. ................................................................................................................................................................................................................................................................. ................................................................................................................................................................................................................................................................. ................................................................................................................................................................................................................................................................. ................................................................................................................................................................................................................................................................. ................................................................................................................................................................................................................................................................. ................................................................................................................................................................................................................................................................. ................................................................................................................................................................................................................................................................. ................................................................................................................................................................................................................................................................. ................................................................................................................................................................................................................................................................. ................................................................................................................................................................................................................................................................. ................................................................................................................................................................................................................................................................. .................................................................................................................................................................................................................................................................
SANOFI
HALF-YEAR FINANCIAL REPORT 2026
63
www.sanofi.com 46 Avenue de la Grande Armée 75017 Paris
July 1, 2026
Share
-
[](https://www.facebook.com/sharer.php?u=https://www.sanofi.com/en/media-room/press-releases/2026/2026-07-01-05-30-00-3320323&t=Press Release: Availability of the aide-mémoire for Q2 2026 results)
-
[](https://twitter.com/share?url=https://www.sanofi.com/en/media-room/press-releases/2026/2026-07-01-05-30-00-3320323&text=Press Release: Availability of the aide-mémoire for Q2 2026 results)
-
[](https://www.linkedin.com/shareArticle?mini=true&url=https://www.sanofi.com/en/media-room/press-releases/2026/2026-07-01-05-30-00-3320323&title=Press Release: Availability of the aide-mémoire for Q2 2026 results)
Availability of the aide-mémoire for Q2 2026 results
Paris, France – July 1, 2026. Sanofi announced today the availability of the aide-mémoire for Q2 2026 results on the "Investors" page of sanofi.com:
Prepared each quarter, this document is intended to support financial modelling of the quarterly results. It covers non-comparable items, foreign currency impact, and share count. Sanofi's Q2 2026 results will be published on July 30, 2026.
About Sanofi Sanofi is an R&D driven, AI-powered biopharma company committed to improving people’s lives and delivering compelling growth. We apply our deep understanding of the immune system to invent medicines and vaccines that treat and protect millions of people around the world, with an innovative pipeline that could benefit millions more. Our team is guided by one purpose: we chase the miracles of science to improve people’s lives; this inspires us to drive progress and deliver positive impact for our people and the communities we serve, by addressing the most urgent healthcare, environmental, and societal challenges of our time.
Sanofi is listed on EURONEXT: SAN and NASDAQ: SNY.
Media Relations Sandrine Guendoul | +33 6 25 09 14 25 | [email protected] Evan Berland | +1 215 432 0234 | [email protected] Timothy Gilbert | +1 516 521 2929 | [email protected] Léo Le Bourhis | +33 6 75 06 43 81 | [email protected] Victor Rouault | +33 6 70 93 71 40 | [email protected] Léa Ubaldi| +33 6 30 19 66 46 | [email protected] Ekaterina Pesheva | +1 410 926 6780 | [email protected] Laura Romby| +33 6 74 16 74 29 | [email protected]
Investor Relations Thomas Kudsk Larsen | +44 7545 513 693 | [email protected] Alizé Kaisserian | +33 6 47 04 12 11 | [email protected] Keita Browne | +1 781 249 1766 | [email protected] Nathalie Pham | +33 7 85 93 30 17 | [email protected] Nina Goworek| +1 908 569 7086 | [email protected] Thibaud Châtelet | +33 6 80 80 89 90 | [email protected] Yun Li | +33 6 84 00 90 72 | [email protected]
Forward-looking statements
This press release contains forward-looking statements within the meaning of applicable securities laws, including the Private Securities Litigation Reform Act of 1995, as amended.
Forward-looking statements are statements that are not historical facts. These statements include projections and estimates and their underlying assumptions, statements regarding plans, objectives, intentions, and expectations with respect to future financial results, events, operations, services, product development and potential, and statements regarding future events and economic performance. Words such as “expect,” “anticipate,” “believe,” “intend,” “estimate,” “plan,” “can,” “contemplate,” “could,” “is designed to,” “may,” “might,” “potential,” “objective,” "attempt," “target,” “project,” "strategy," "strive," "desire," “predict,” “forecast,” “ambition,” “guideline,” "seek," “should,” “will,” "goal," or the negative of these, and similar expressions are intended to identify forward-looking statements.
Although Sanofi’s management believes that the expectations reflected in such forward-looking statements are reasonable, investors are cautioned that forward-looking information and statements are subject to various risks and uncertainties, many of which are difficult to predict and generally beyond the control of Sanofi, that could cause actual results and developments to differ materially from those expressed in, or implied or projected by, the forward-looking information and statements. These risks and uncertainties include among other things, the uncertainties inherent in research and development, future clinical data and analysis, including post marketing, decisions by regulatory authorities, such as the U.S Food and Drug Administration or the European Medicines Agency, regarding whether and when to approve any drug, device or biological application that may be filed for any such product candidates as well as their decisions regarding labelling and other matters that could affect the availability or commercial potential of such product candidates; the fact that product candidates if approved may not be commercially successful; unexpected regulatory actions or delays, or government regulation generally; authorities’ decisions regarding whether and when to approve a product candidate; political pressure in the United States to mandate lower drug prices including “most favored nation” pricing for State Medicaid programs; the future approval and commercial success of therapeutic alternatives; Sanofi’s ability to benefit from external growth opportunities, to complete related transactions and/or obtain regulatory clearances, including future clinical data and analysis of existing clinical data relating to the product, including post marketing, unexpected safety, quality or manufacturing issues, competition in general; risks associated with intellectual property and any related pending or future litigation and the ultimate outcome of such litigation; trends in exchange rates and prevailing interest rates, volatile economic and market conditions, cost containment initiatives and subsequent changes thereto, and the impact that global crises may have on us, our customers, suppliers, vendors, and other business partners, and the financial condition of any one of them, as well as on our employees and on the global economy as a whole. The risks and uncertainties also include the uncertainties discussed or identified in the public filings with the SEC and the French Markets Authority (AMF) made by Sanofi, including those listed under “Risk Factors” and “Cautionary Statement Regarding Forward-Looking Statements” in Sanofi’s annual report on Form 20-F for the year ended December 31, 2025 or contained in our periodic reports on Form 6-K. Other than as required by applicable law, Sanofi does not undertake any obligation to update or revise any forward-looking information or statements. In light of these risks, uncertainties and assumptions, you should not place undue reliance on any forward-looking statements contained herein.
• Wayrilz is a BTK inhibitor that works through multi-immune modulation to help address the underlying causes of immune thrombocytopenia (ITP)
• Approval based on the LUNA 3 phase 3 study that demonstrated rapid and durable platelet response and improvements in other symptoms
• ITP is a rare disease of complex immune dysregulation leading to lower platelet counts, bleeding, and reduced quality of life
Paris, June 23, 2026. The Ministry of Health, Labour and Welfare in Japan has granted marketing and manufacturing authorization to Wayrilz (rilzabrutinib), a novel oral reversible Bruton’s tyrosine kinase inhibitor (BTKi), for the treatment of persistent or chronic immune thrombocytopenia (ITP) in patients who do not respond sufficiently to other treatments or in whom tolerability is considered to be problematic. Wayrilz can help address the underlying causes of the disease, through multi-immune modulation, targeting key pathways across the immune system.
The approval is based on the LUNA 3 phase 3 study (clinical study identifier: NCT04562766), in which Wayrilz met the primary and secondary endpoints, showing a positive impact on sustained platelet counts and other symptoms.
• Cenrifki represents a significant advancement for people living with SPMS by targeting disability progression
• Approval based on the HERCULES phase 3 study in nrSPMS with supporting data from the GEMINI 1 and 2 phase 3 studies in RMS
Paris, June 23, 2026. The European Commission has approved Cenrifki (tolebrutinib) for the treatment of secondary progressive multiple sclerosis (SPMS) without relapses in the last two years. This follows the positive opinion by the European Medicines Agency’s Committee for Medicinal Products for Human Use.
The approval is based on results from the HERCULES phase 3 study (clinical study identifier: NCT04411641) in non-relapsing SPMS (nrSPMS), with supporting data from the GEMINI 1 (clinical study identifier: NCT04410978) and GEMINI 2 (clinical study identifier: NCT04410991) phase 3 studies in relapsing multiple sclerosis (RMS). The HERCULES study demonstrated that Cenrifki significantly delayed the onset of disability progression in nrSPMS.
The safety profile of Cenrifki has been consistent across the clinical program. The most common adverse events were COVID-19 and upper respiratory tract infections.
Paris, June 22, 2026. Sanofi today announced the appointment of Paulo Fontoura, MD, PhD, FAAN, as Executive Vice President, Global Head of Research & Development Pharma, effective September 1, 2026. He will be a member of Sanofi’s Executive Committee, based in Paris, and will report to Chief Executive Officer Belén Garijo. As head of R&D Pharma, Paulo will lead Sanofi’s end-to-end innovation engine, spanning research, translational medicine, clinical development, and regulatory affairs, with responsibility for advancing a differentiated pipeline and accelerating the delivery of transformative medicines to patients. Paulo succeeds Dr. Houman Ashrafian, who has decided to pursue an opportunity outside the company.
With more than 25 years of experience spanning academic medicine, translational science, clinical development, and pharmaceutical innovation, Paulo joins Sanofi at an important moment as the company continues to advance its R&D transformation and progress a pipeline of new medicines across multiple therapeutic areas.
• Approval based on multiple studies, including the pivotal IRAKLIA phase 3 study which demonstrated non-inferior efficacy and pharmacokinetics compared to Sarclisa IV
• Second global approval for Sarclisa SC following the EU
Paris, June 19, 2026. The Ministry of Health, Labour and Welfare in Japan has granted approval for Sarclisa (isatuximab) subcutaneous (SC) formulation in combination with approved standard-of-care regimens for the treatment of multiple myeloma (MM). The approved indications for Sarclisa SC in Japan include in combination with pomalidomide and dexamethasone (Pd), or with carfilzomib for the treatment of relapsed or refractory MM (R/R MM) and in combination with bortezomib, lenalidomide, and dexamethasone (VRd), for the treatment of adult patients with newly diagnosed multiple myeloma (NDMM).
A regulatory submission for the CirCLIQ on-body injector (OBI), based on the enFuse platform and submitted by Enable Injections, is under review in Japan. If approved, Sarclisa SC could become the first anticancer treatment to be administered via an OBI, and the first MM medicine in Japan to offer both manual SC injection and OBI administration.
● Accelerated approval in children aged eight to 17 years old recently diagnosed with stage 3 T1D to delay the decline in endogenous insulin production
● Approval based on the PROTECT phase 3 study and additional data from the global clinical development program from over 900 patients who received Tzield
Paris, June 13, 2026. The US Food and Drug Administration (FDA) has granted accelerated approval to Tzield (teplizumab-mzwv) to delay the decline in endogenous (own) insulin production in children aged eight to 17 years recently diagnosed with stage 3 T1D. Tzield is not effective as a disease-modifying therapy in non-autoimmune dysglycemic conditions.
“We now have a novel therapy that targets the autoimmune and progressive nature of stage 3 type 1 diabetes,” said Aaron J. Kowalski, PhD, CEO of Breakthrough T1D. “Approximately 64,000 people are diagnosed with T1D every year.
Paris, June 10, 2026. Sanofi today announced that the riliprubart MOBILIZE phase 3 study (clinical study identifier: NCT06290128) in patients with chronic inflammatory demyelinating polyneuropathy (CIDP) refractory to standard-of-care treatment will be stopped. This decision follows an interim analysis by an independent data monitoring committee, which determined that the MOBILIZE study is unlikely to provide sufficient efficacy. No safety signals related to riliprubart were identified as part of this interim analysis. The continuation of other ongoing studies with riliprubart, including the VITALIZE phase 3 study (clinical study identifier: NCT06290141) in IVIg-treated patients with CIDP, will be evaluated accordingly.
Sanofi is deeply grateful to the patients, caregivers, and investigators who participated in the MOBILIZE study.
Sanofi will work closely with investigators and site teams to ensure a wind-down of the MOBILIZE study, with appropriate transition of care for all enrolled patients. Sanofi will conduct a thorough analysis of the MOBILIZE data to inform future research directions and contribute to the broader scientific understanding of CIDP.
• Sarclisa administered via the CirCLIQ® OBI offers a treatment experience designed around the needs of patients and HCPs and enables flexible administration in either home or outpatient settings
• Sarclisa is the first anticancer treatment to be administered through an OBI and the first MM treatment available by both SC OBI and manual injection in the EU
• Efficacy of Sarclisa demonstrated in SC formulation with innovative OBI across all indications and combinations currently approved for the IV formulation
Paris, June 8, 2026. The European Commission has approved Sarclisa (isatuximab) subcutaneous (SC) in combination with standard-of-care regimens for the treatment of patients with multiple myeloma (MM) across all existing indications for Sarclisa intravenous (IV) formulation. Sarclisa is the first anticancer therapy in the EU to be administered through an on-body injector (OBI) and manual SC administration and can provide the flexibility of administration at patients’ homes and in the outpatient setting.
“Multiple myeloma is a complex disease that often requires repeated and prolonged clinic visits, placing a considerable burden on patients and those who support them.
Paris, June 4, 2026. Sanofi’s global employee shareholder plan, Action 2026, opens on June 9, 2026, to around 75,000 employees in 52 countries. Now in its 12th year, the program demonstrates the ongoing commitment of Sanofi and its Board of Directors to involve employees in the company’s growth and results. In 2025 alone, more than 31,000 Sanofi employees - 44% of the total workforce, chose to invest in the company through the program. Today, nearly 90,000 current or former Sanofi employees are shareholders, and hold approximately 2.93% of its capital.
“The growing participation in our global employee share purchase plan speaks for itself: our employees believe in Sanofi’s transformation and are proud to be part of it. This trust is our greatest asset to accelerate the execution of our strategy and maintain our success in the biopharmaceutical sector.” Belén Garijo, Chief Executive Officer
From June 9-29, 2026, employees will be offered shares at a subscription price of €59.87, which is equal to a 20% discount on the average of the 20 opening prices of Sanofi shares from May 6 to June 2, 2026.
Paris, May 28, 2026. The US Food and Drug Administration (FDA) has granted priority review to the new drug application (NDA) for venglustat, a novel, investigational oral glucosylceramide synthase inhibitor (GCSi), for the treatment of type 3 Gaucher disease (GD3), a rare lysosomal storage disorder.
If approved, venglustat would become the first treatment available in the US to address the progressive neurological manifestations associated with GD3 and expand Sanofi’s portfolio of treatment options for patients living with lysosomal storage diseases. The target action date for the FDA decision is November 25, 2026.
Gaucher disease is marked by the abnormal buildup of sugar-and-fat molecules called glycosphingolipids (GSL) in the spleen, liver, bone marrow, and lungs. In patients with GD3, these molecules also accumulate in the central nervous system (CNS) where they drive neuroinflammation, which can result in neurological manifestations, including cognitive deficits and difficulty in coordination and balance (ataxia), in addition to the disease’s systemic effects. There are currently no approved targeted treatments that specifically address the neurological symptoms of GD3.
• Data from the head-to-head study show efdoralprin alfa normalized and maintained functional AAT levels in people living with alpha-1 antitrypsin deficiency
• Efdoralprin alfa is a recombinant protein distinct from plasma-derived therapy, which has been the standard-of-care for nearly 40 years
Paris, May 18, 2026. Data from the global ElevAATe phase 2 study (clinical study identifier: NCT05856331) demonstrated superiority of investigational efdoralprin alfa over standard-of-care therapy in achieving and maintaining normalized functional alpha-1 antitrypsin (fAAT) levels in adult patients with alpha-1 antitrypsin deficiency (AATD)-related emphysema. These results are being presented today at the 2026 American Thoracic Society (ATS) International Conference in Orlando, FL, US.
Efdoralprin alfa, dosed every three weeks (Q3W), achieved mean increases in fAAT trough levels more than three times greater than plasma-derived protein (pdAAT) dosed weekly (Q1W), meeting the primary endpoint (p<0.0001).
Prompts
Click prompts to add them under the company line, click again to take one out, then copy the result into your AI chat. Shared by Asian Century Stocks and Uncovered Thai Stocks. Thank you.
Company History
Name and ticker changes, and re-registrations under a new regulatory id. When a ticker stopped being used is not recorded, so former tickers are undated.
| Date | Change | Detail |
|---|---|---|
| Mar 29, 2023 | Acquired | Acquired Provention Bio, Inc. (Regulatory id 1695357). Its filings from before the deal are on its own company page, not shown here. |
| Sep 1, 2010 | Renamed | SANOFI-AVENTIS → SANOFI |
| Aug 31, 2004 | Renamed | SANOFI SYNTHELABO SA → SANOFI-AVENTIS |
ETFs Holding Sanofi
Exchange-traded funds whose newest published daily portfolio holds one of the company's listings, largest weight first.
| ETF | Weight in ETF | Shares | Market value | As of |
|---|---|---|---|---|
| BINV | 3.10% | 177,082 | $ 15.191M | Jun 30, 2026 |
| IDVZ | 3.04% | 138,907 | $ 5.984M | Jul 31, 2026 |
| PAYR | 2.91% | 38,585 | $ 1.662M | Jul 31, 2026 |
| GMOI | 2.79% | 434,143 | $ 19.259M | Aug 31, 2026 |
| DTAN | 2.25% | 5,147 | $ 490.39K | Nov 17, 2026 |
| BASV | 2.19% | 210,126 | $ 8.964M | Jun 30, 2026 |
| TINS | 2.15% | 1,468 | $ 126.012K | Jun 30, 2026 |
| DIVD | 2.15% | 12,312 | $ 590K | Nov 18, 2026 |
| BUSA | 2.07% | 144,778 | $ 6.176M | Jun 30, 2026 |
| DSTX | 1.92% | 10,559 | $ 906.375K | Jun 30, 2026 |
| CVGD | 1.92% | 61,723 | $ 2.659M | Jul 31, 2026 |
| FLV | 1.55% | 133,013 | $ 5.9M | Aug 31, 2026 |
| GENW | 1.39% | 1,651 | $ 71.125K | Jul 31, 2026 |
| BRIE | 1.30% | 91,224 | $ 6.346M | Aug 31, 2026 |
| FENI | 0.91% | 1,435,818 | $ 93.669M | Jun 30, 2026 |
| JHID | 0.91% | 1,152 | $ 98.886K | Jun 30, 2026 |
| CGIC | 0.91% | 239,565 | $ 23.266M | Nov 16, 2026 |
| TIIV | 0.90% | 6,875 | $ 296.175K | Jul 31, 2026 |
| CGGO | 0.89% | 1,069,383 | $ 103.855M | Nov 16, 2026 |
| UMMA | 0.87% | 28,654 | $ 2.557M | Aug 31, 2026 |
| VDI | 0.72% | 1,377 | $ 118.25K | Jul 31, 2026 |
| NBIE | 0.70% | 19,627 | $ 1.751M | Aug 31, 2026 |
| AIVI | 0.67% | 4,561 | $ 391.512K | Jun 30, 2026 |
| SEIE | 0.64% | 84,532 | $ 7.256M | Jun 30, 2026 |
| IVSI | 0.60% | 551 | $ 47.268K | Jun 30, 2026 |
| RINT | 0.58% | 9,400 | $ 806.392K | Jun 30, 2026 |
| TOUS | 0.56% | 103,358 | $ 8.9M | Jul 31, 2026 |
| RCGE | 0.56% | 5,832 | $ 560K | Nov 18, 2026 |
| NTSI | 0.41% | 23,998 | $ 2.06M | Jun 30, 2026 |
| APIE | 0.40% | 104,810 | $ 4.649M | Aug 31, 2026 |
| AVSD | 0.38% | 28,969 | $ 1.402M | Nov 16, 2026 |
| DFIV | 0.37% | 848,165 | $ 82.569M | Nov 12, 2026 |
| QUIZ | 0.33% | 3,454 | $ 308.24K | Aug 31, 2026 |
| DFAI | 0.31% | 585,199 | $ 56.977M | Nov 12, 2026 |
| DFSI | 0.27% | 32,997 | $ 3.213M | Nov 12, 2026 |
| AVDE | 0.26% | 1,060,595 | $ 51.322M | Nov 16, 2026 |
| RGLO | 0.21% | 8,151 | $ 699.245K | Jun 30, 2026 |
| IQSZ | 0.19% | 3,805 | $ 326.916K | Jul 31, 2026 |
| TIER | 0.17% | 700 | $ 60.278K | Jul 31, 2026 |
| GEW | 0.16% | 2,637 | $ 235.269K | Aug 31, 2026 |
| RFDI | 0.13% | 2,577 | $ 221.3K | Jul 31, 2026 |
| DFIC | 0.12% | 191,575 | $ 18.614M | Nov 12, 2026 |
| DFAX | 0.09% | 106,992 | $ 10.238M | Nov 12, 2026 |
| DXIV | 0.06% | 1,509 | $ 146.921K | Nov 12, 2026 |