Santacruz Silver Produces 3,739,019 Silver Equivalent Ounces in Q4 2025, Comprised of 1,343,607 Ounces of Silver, 23,846 Tonnes of Zinc, 3,000 Tonnes of Lead, and 287 Tonnes of Copper Vancouver, B.C. – Santacruz Silver Mining Ltd. (NASDAQ:SCZM)…
Santacruz Silver Produces 3,739,019 Silver Equivalent Ounces in Q4 2025, Comprised of
1,343,607 Ounces of Silver, 23,846 Tonnes of Zinc, 3,000 Tonnes of Lead, and 287 Tonnes of
Copper
Vancouver, B.C. – Santacruz Silver Mining Ltd. (NASDAQ:SCZM) (TSX.V:SCZ) ("Santacruz" or the “Company”)
reports its Q4 2025 production results from its Bolívar mine, Porco mine, Caballo Blanco Group of mines (“Caballo
Blanco") and the San Lucas Group which includes the Reserva Mina and the San Lucas feed sourcing business
(“San Lucas”), all located in Bolivia, and the Zimapán mine located in Mexico.
Q4 2025 Production Highlights:
Silver Equivalent Production: 3,739,019 silver equivalent ounces
Silver Production: 1,343,607 ounces
Zinc Production: 23,846 tonnes
Lead Production: 3,000 tonnes
Copper Production: 287 tonnes
Underground Development: 11,558 meters
Arturo Préstamo, Executive Chairman and CEO of Santacruz, commented, “During Q4 2025, Santacruz delivered a
solid quarter-over-quarter improvement in consolidated production, led by a meaningful recovery at the Bolívar
mine, and supported by strong performance at Caballo Blanco, Zimapán, and San Lucas, reflecting the strength
and diversification of our multi-asset operating portfolio. At Bolívar, we are beginning to see the benefits of the
recovery efforts at the high silver-grade Pomabamba and Nané veins following the May 2025 flooding event, which
resulted in higher production throughput, improved operating conditions, and a 34% increase in silver equivalent
production compared to Q3 2025.”
Mr. Préstamo continued, “In Q4 2025, the recovery plan at Bolívar remained focused on restoring access to the
affected mining areas, and continued to progress on schedule. Improvements achieved this quarter contributed
to enhanced operational stability and stronger production performance. However, access to the highest-grade
areas remained partially constrained, and recovery activities continued throughout Q4 2025. Our team at Bolívar
is making steady progress each day, and we expect their efforts to drive a sustained quarter-over-quarter increase
in silver production from these two veins this year. We continue to expect a full recovery from both areas by Q4
2026.”
2
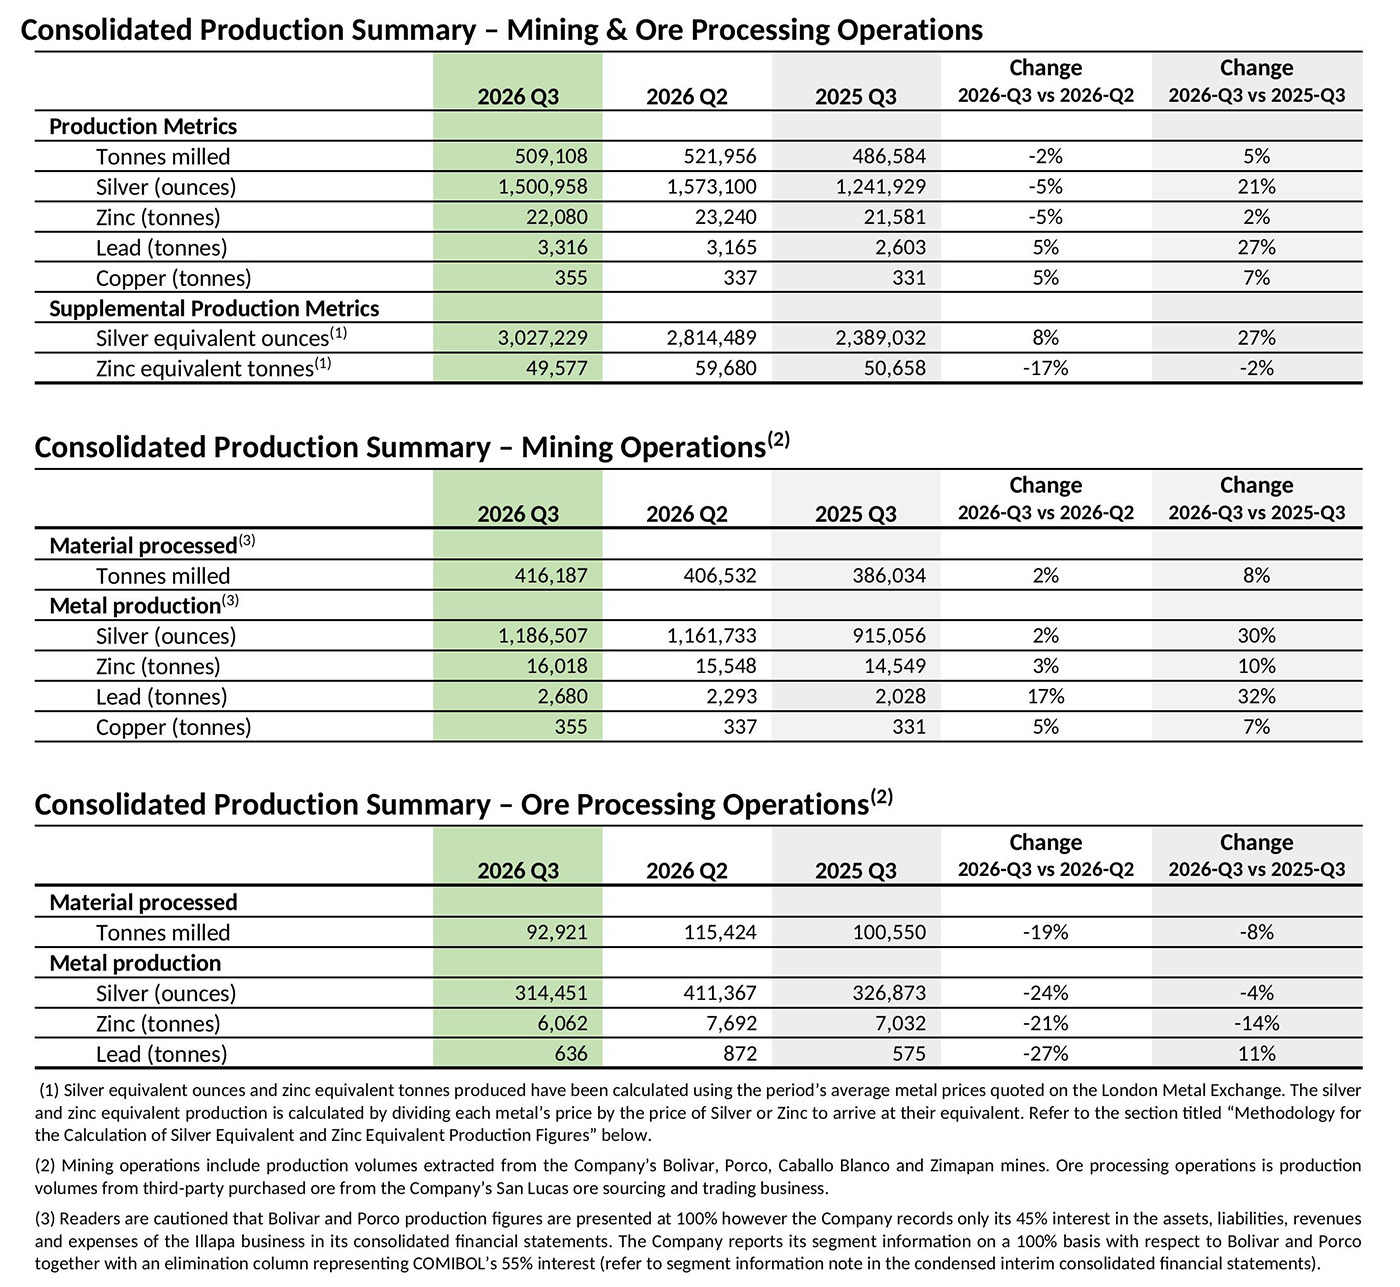
Production Summary – Total
Production Table
2025 Q4
2025 Q3
Change
Q4 vs Q3
2025 YTD
2024 YTD
Change
’25 vs ’24
Material Processed (tonnes milled) 506,040 486,585 4% 1,945,261 1,955,905 (1%)
Silver Equivalent Produced (ounces)
(1)
3,739,019 3,424,817 9% 14,399,019 16,173,293 (11%)
Production
Silver (ounces) 1,343,607 1,241,929 8% 5,598,680 6,718,380 (17%)
Zinc (tonnes) 23,846 21,581 10% 87,295 94,399 (8%)
Lead (tonnes) 3,000 2,603 15% 11,094 11,820 (6%)
Copper (tonnes) 287 331 (13%) 1,126 1,057 7%
(1) Silver Equivalent Produced (ounces) have been calculated using prices of $31.41/oz, $2,775.53/t, $2,085.90/t and $9,762.69/t for silver, zinc, lead and copper respectively
applied to the metal production divided by the silver price as stated here.
Year-over-year production (2025 vs 2024) was impacted by Bolívar’s May 2025 flooding event, which temporarily
restricted access to certain mining areas and limited throughput from Q2 2025 to Q4 2025. Remediation measures have
been implemented since the event in May 2025 and continued to advance as planned throughout Q4 2025, placing the
Bolívar’s operation on a clear path toward resolution. As access has steadily improved, silver production has begun to
recover. In addition, Santacruz experienced consistent quarter-over-quarter improvements in 2025, a trend the
Company expects to continue as conditions normalize.
3
Bolívar Mine
Bolivar Production Table
(1)
2025 Q4
2025 Q3
Change
Q4 vs Q3
2025 YTD
2024 YTD
Change
’25 vs ’24
Material Processed (tonnes milled) 63,267 52,023 22% 232,448 284,634 (18%)
Silver Equivalent Produced (ounces)
(2)
565,694 420,612 34% 2,374,121 3,630,036 (35%)
Production
Silver (ounces) 202,193 132,146 53% 1,059,846 1,828,028 (42%)
Zinc (tonnes) 3,973 3,186 25% 14,367 19,395 (26%)
Lead (tonnes) 187 104 80% 674 1,326 (49%)
Average Grade
Silver (g/t) 108 89 22% 158 218 (28%)
Zinc (%) 6.75 6.61 2% 6.73 7.48 (10%)
Lead (%) 0.40 0.31 28% 0.41 0.64 (36%)
Metal Recovery
Silver (%) 92 89 3% 89 92 (2%)
Zinc (%) 93 93 (0%) 92 91 1%
Lead (%)
74 64 16% 71 73 (3%)
(1)
Bolivar is presented at 100% whereas the Company records 45% of revenues and expenses in its consolidated financial statements.
(2)
Silver Equivalent Produced (ounces) have been calculated using prices of $31.41/oz, $2,775.53/t and $2,085.90/t for silver, zinc and lead respectively applied to the
metal production divided by the silver price as stated here.
Q4 2025 vs Q3 2025
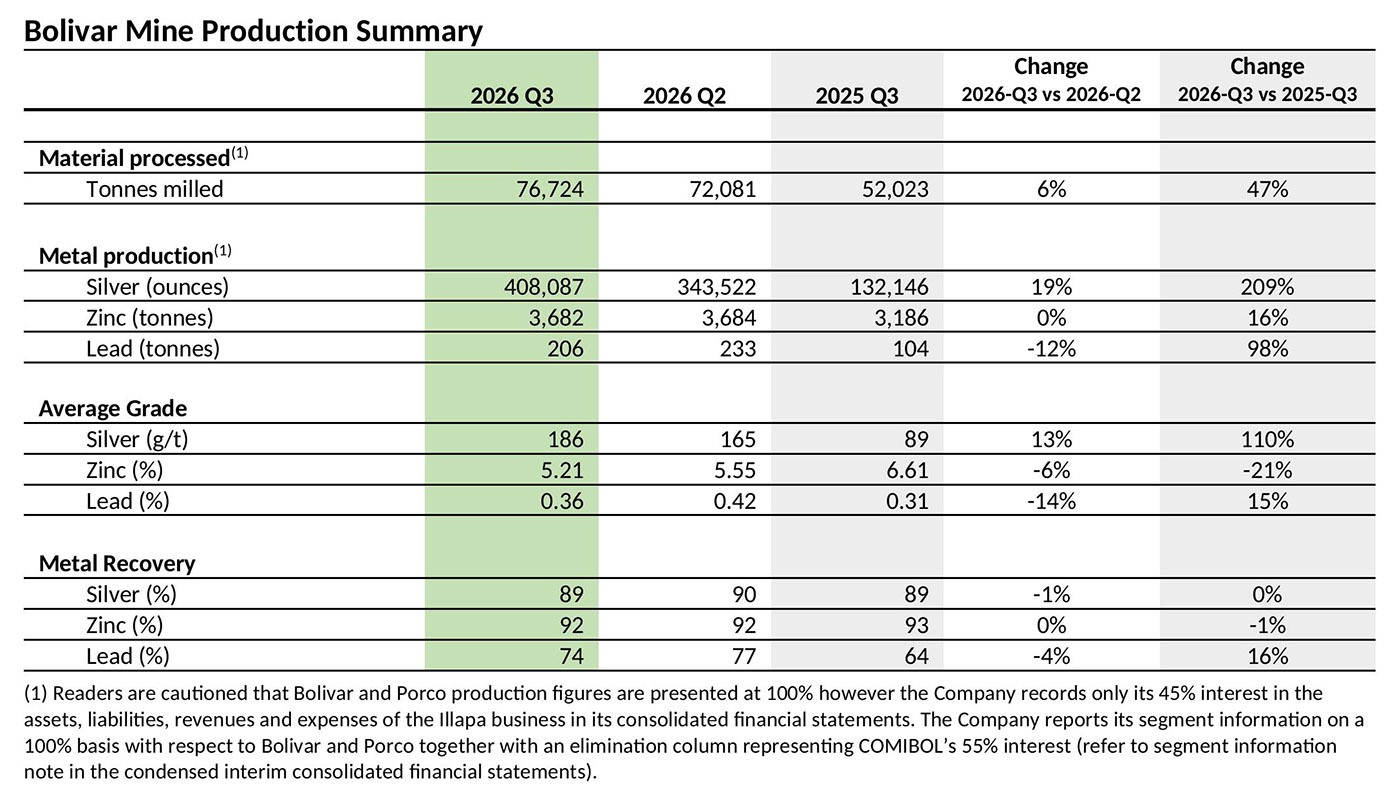
In Q4 2025, ore processed at Bolívar increased by 22% compared to Q3 2025, reflecting improved access and
operating conditions as recovery activities advanced at the Pomabamba and Nané areas. Silver equivalent
production increased by 34%, driven by higher throughput, a 22% increase in silver head grades and a 3%
improvement in silver recoveries. Silver production increased by 53% quarter over quarter, while zinc and lead
production rose by 25% and 80%, respectively, consistent with improved stope availability and the mining
sequence.
Recovery efforts at the affected mining areas continued throughout Q4 2025 and advanced in line with the
established recovery plan. While operating conditions improved materially compared to Q3 2025, access to the
highest-grade portions of the Pomabamba and Nané veins remained partially restricted during Q4 2025.
Notwithstanding these constraints, production from the Pomabamba and Nané veins increased month-over-
month during Q4 2025, reflecting improved grades and silver recoveries, as a growing proportion of ore was
sourced from these higher-silver-grade structures.
Q4 2025 vs Q4 2024
The high-grade areas at Pomabamba and Nane veins began to show solid progress toward the end of Q3 2025;
however, their contribution to silver recoveries became more meaningful only during Q4 2025, which also
affected the year-over-year comparison.
4
Porco Mine
Porco Production Table
(1)
2025 Q4 2025 Q3
Change
Q4 vs Q3
2025 YTD 2024 YTD
Change
’25 vs ’24
Material Processed (tonnes milled) 51,416 49,161 5% 197,231 204,585 (4%)
Silver Equivalent Produced (ounces)
(2)
330,176 318,694 4% 1,377,234 1,762,341 (22%)
Production
Silver (ounces) 82,047 92,001 (11%) 400,486 645,250 (38%)
Zinc (tonnes) 2,727 2,488 10% 10,675 12,044 (11%)
Lead (tonnes) 108 103 5% 504 795 (37%)
Average Grade
Silver (g/t) 61 71 (14%) 77 117 (34%)
Zinc (%) 5.66 5.43 4% 5.77 6.28 (8%)
Lead (%) 0.28 0.30 (6%) 0.36 0.51 (29%)
Metal Recovery
Silver (%) 81 82 (1%) 82 84 (2%)
Zinc (%) 94 93 1% 94 94 (0%)
Lead (%)
74 69 7% 70 76 (8%)
(1)
Porco is presented at 100% whereas the Company records 45% of revenues and expenses in its consolidated financial statements.
(2)
Silver Equivalent Produced (ounces) have been calculated using prices of $31.41/oz, $2,775.53/t and $2,085.90/t for silver, zinc and lead respectively applied to the
metal production divided by the silver price as stated here.
Q4 2025 vs Q3 2025
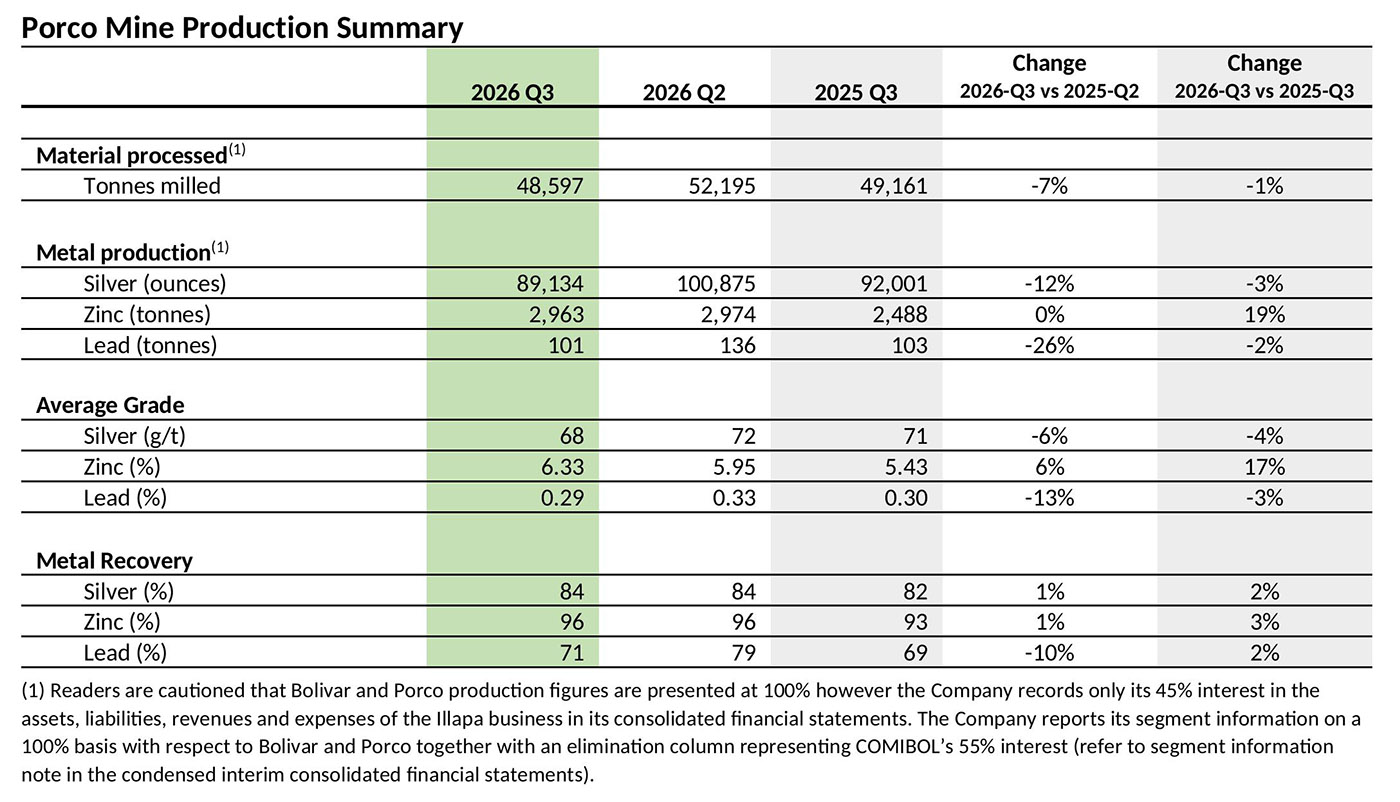
Porco reported a 10% increase in zinc production compared to the previous quarter, driven by higher head
grades and stable throughput. Zinc recoveries remained strong at 94%, reflecting consistent metallurgical
performance. Silver production declined as mining continued to focus on zinc-rich zones, consistent with the
mine plan and Porco’s role as a predominantly zinc-producing underground operation.
Q4 2025 vs Q4 2024
On a year-over-year basis, Porco recorded a modest decrease in zinc production, reflecting slightly lower zinc
grades while maintaining stable throughput and strong recoveries. The mine plan during 2025 prioritized zinc-
dominant zones with lower silver content, resulting in lower silver output compared to the prior year. Porco
continues to operate as a reliable zinc-producing asset with consistent operating performance.
5
Caballo Blanco Group
Caballo Blanco Group Production Table
(1)
2025 Q4 2025 Q3
Change
Q4 vs Q3
2025 YTD 2024 YTD
Change
’25 vs ’24
Material Processed (tonnes milled) 63,067 62,221 1% 234,709 275,273 (15%)
Silver Equivalent Produced (ounces)
(2)
730,108 707,465 3% 2,782,260 3,018,705 (8%)
Production
Silver (ounces) 289,446 294,524 (2%) 1,192,022 1,220,757 (2%)
Zinc (tonnes) 4,409 4,131 7% 16,063 18,606 (14%)
Lead (tonnes) 769 722 7% 2,573 2,316 11%
Average Grade
Silver (g/t) 156 160 (2%) 170 153 11%
Zinc (%) 7.39 7.14 4% 7.28 7.30 (0%)
Lead (%) 1.51 1.45 4% 1.34 1.11 21%
Metal Recovery
Silver (%) 91 92 (1%) 93 90 3%
Zinc (%) 95 93 2% 94 93 2%
Lead (%)
81 80 1% 82 76 7%
(3)
The Caballo Blanco Group consists of the Colquechaquita and Tres Amigos mines.
(1)
Silver Equivalent Produced (ounces) have been calculated using prices of $31.41/oz, $2,775.53/t and $2,085.90/t for silver, zinc and lead respectively applied to the metal
production divided by the silver price as stated here.
Q4 2025 vs Q3 2025
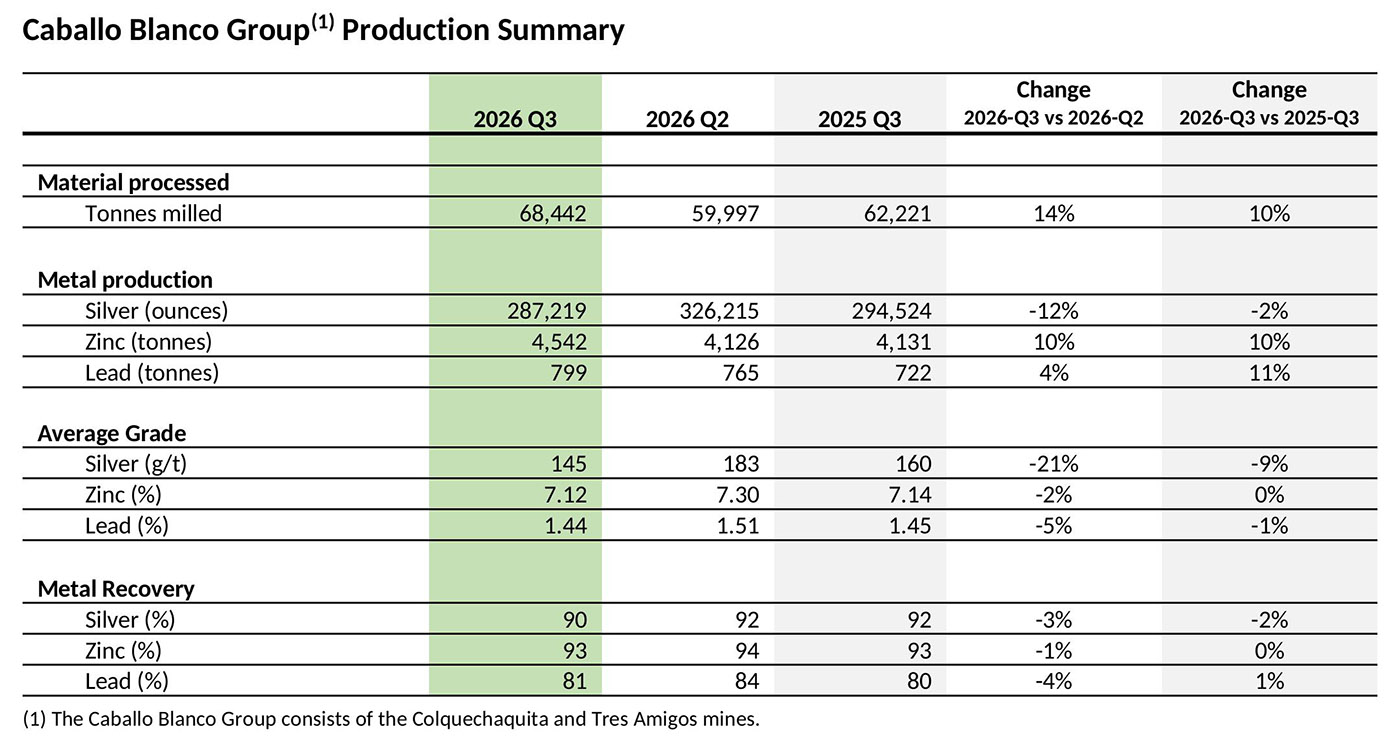
Caballo Blanco increased ore processed compared to Q3 2025, resulting in a 3% increase in silver equivalent
production. Silver production remained stable, while zinc and lead output increased by 7% each, supported by
higher head grades and strong recoveries. Results reflect solid operational performance and continued adherence
to the mine plan.
Q4 2025 vs Q4 2024
Compared with Q4 2024, Caballo Blanco’s silver equivalent production increased, supported by higher head grades
and improved recoveries. These results reflect ongoing operational optimization and continued focus on mining
higher-quality zones within the mine plan.
6
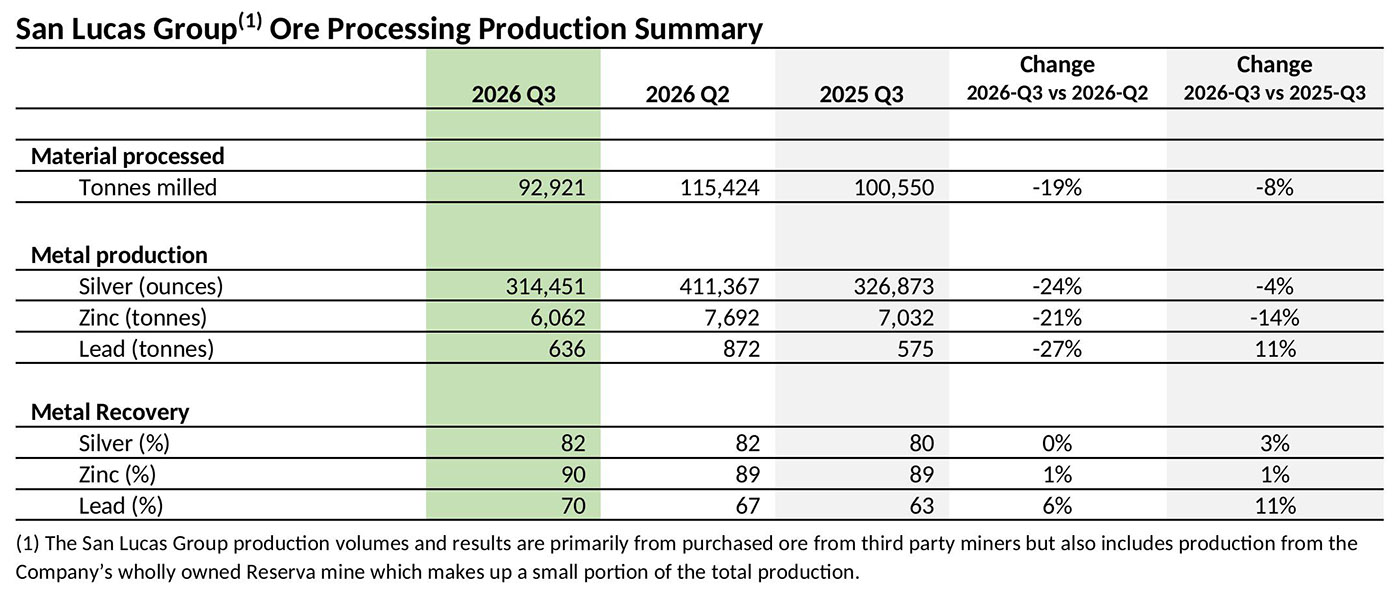
San Lucas Group
San Lucas Group Production Table
2025 Q4 2025 Q3
Change
Q4 vs Q3
2025 YTD 2024 YTD
Change
’25 vs ‘24
Material Processed (tonnes milled) 105,587 100,550 5% 387,805 341,649 14%
Silver Equivalent Produced (ounces)
(1)
1,095,945 986,403 11% 3,881,319 3,949,992 (2%)
Production
Silver (ounces) 366,600 326,873 12% 1,308,128 1,344,242 (3%)
Zinc (tonnes) 7,729 7,032 10% 27,419 28,042 (2%)
Lead (tonnes) 699 575 22% 2,264 1,924 18%
Average Grade
Silver (g/t) 135 126 7% 127 147 (13%)
Zinc (%) 8.20 7.86 4% 7.89 9.01 (12%)
Lead (%) 0.97 0.90 8% 0.91 0.88 3%
Metal Recovery
Silver (%) 80 80 (0%) 83 83 (1%)
Zinc (%) 89 89 (0%) 90 91 (2%)
Lead (%)
63 63 8% 64 64 1%
(1) Silver Equivalent Produced (ounces) have been calculated using prices of $31.41/oz, $2,775.53/t and $2,085.90/t for silver, zinc and lead respectively applied to the metal
production divided by the silver price as stated here.
Q4 2025 vs Q3 2025
San Lucas continued to play a strategic role in Q4 2025, with ore processed up 5% from the prior quarter. Silver
equivalent production increased by 11%, driven by higher throughput and improved head grades, while recoveries
remained stable. The operation’s flexible, margin-based sourcing model continued to support group-level mill
utilization.
Q4 2025 vs Q4 2024
On a year-over-year basis, San Lucas processed higher volumes, while silver equivalent production declined
modestly due to lower head grades. Operational flexibility remained a key factor in supporting overall
performance across the Bolivian operations.
7
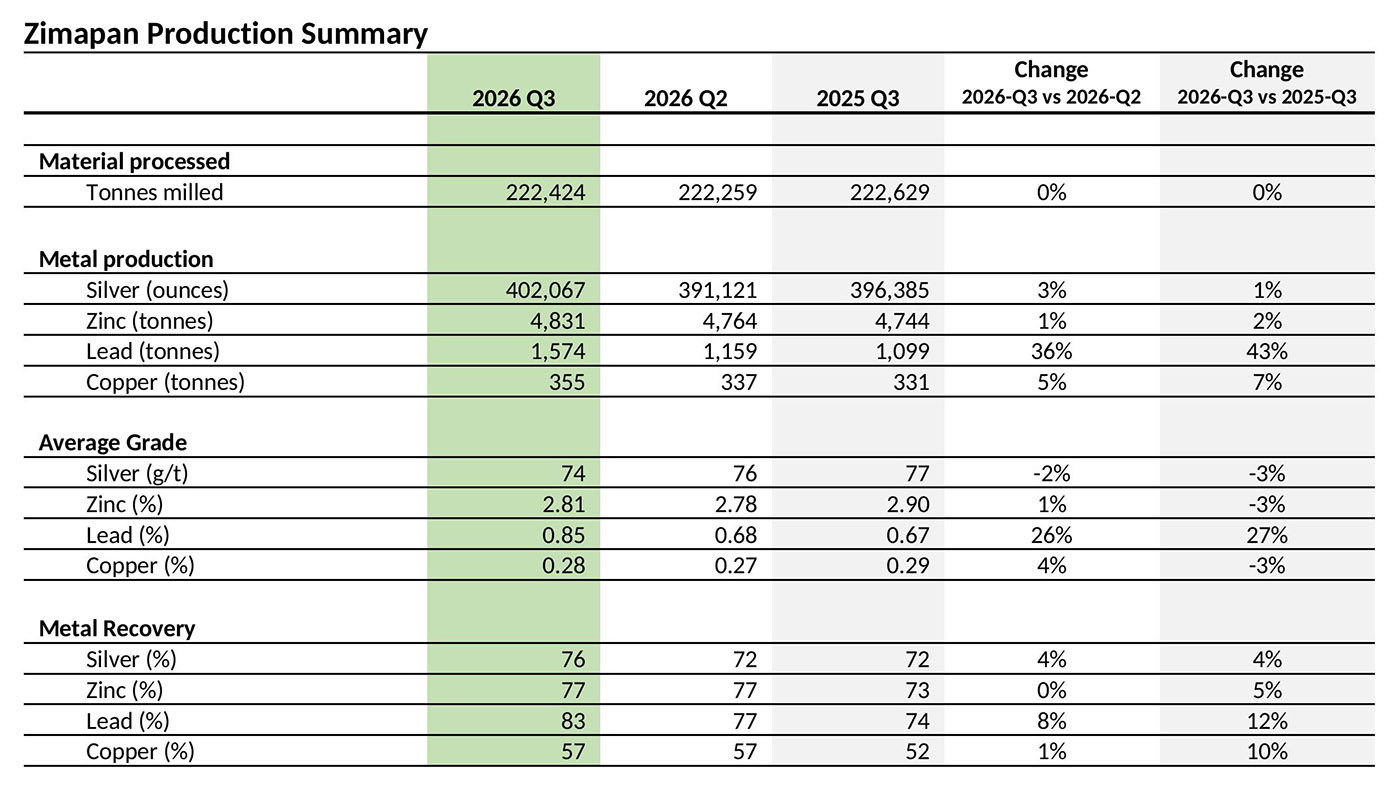
Zimapán Mine
Zimapán Production Table
2025 Q4 2025 Q3
Change
Q4 vs Q3
2025 YTD 2024 YTD
Change
’25 vs ’24
Material Processed (tonnes milled) 222,703 222,629 (0%) 893,067 849,764 5%
Silver Equivalent Produced (ounces)
(1)
1,017,096 991,643 3% 3,984,086 3,812,220 5%
Production
Silver (ounces)
403,321
396,385 2% 1,638,198 1,680,033 (2%)
Zinc (tonnes) 5,008 4,744 6% 18,771 16,311 15%
Lead (tonnes) 1,237 1,099 13% 5,080 5,458 (7%)
Copper (tonnes) 287 331 (13%) 1,126 1,057 7%
Average Grade
Silver (g/t) 80 77 4% 78 82 (4%)
Zinc (%) 2.89 2.90 (0%) 2.74 2.46 11%
Lead (%) 0.72 0.67 8% 0.73 0.75 (4%)
Copper (%) 0.26 0.29 (10%) 0.26 0.29 (11%)
Metal Recovery
Silver (%)
70 72
(3%) 73 75 (4%)
Zinc (%)
78 73 6% 77 78 (2%)
Lead (%)
78 74 5% 78 85 (8%)
Copper (%)
50 52 (3%) 49 43 14%
(1) Silver Equivalent Produced (ounces) have been calculated using prices of $31.41/oz, $2,775.53/t, $2,085.90/t and $9,762.69/t for silver, zinc, lead and copper respectively
applied to the metal production divided by the silver price as stated here.
Q4 2025 vs Q3 2025
Zimapán delivered strong results throughput in Q4 2025, with silver equivalent production increasing by 3% from
Q3 2025. Zinc production increased by 6%, supported by higher head grades and improved recoveries. Silver
production remained stable, reflecting consistent plant performance.
Q4 2025 vs Q4 2024
Year-over-year, Zimapán’s silver equivalent production declined slightly, primarily due to lower silver head grades
and recoveries. This was partially offset by higher zinc production, reflecting the execution of the mine plan and
improved feed quality from zinc-dominant stopes.