Published: August 5, 2026 - 1:00 p.m. First half results demonstrate continued operational excellence and strong financial performance Raised Potash sales volumes and lowered capital expenditures guidance ranges Increased cash returns to shareholders…
Published: August 5, 2026 - 1:00 p.m.
First half results demonstrate continued operational excellence and strong financial performance
Raised Potash sales volumes and lowered capital expenditures guidance ranges
Increased cash returns to shareholders
All amounts are in US dollars, except as otherwise noted
SASKATOON, Saskatchewan--(BUSINESS WIRE)-- Nutrien Ltd. (TSX and NYSE: NTR) announced today its second quarter 2026 results, with net earnings of $1.22 billion ($2.53 diluted net earnings per share). Second quarter 2026 adjusted EBITDA1 was $2.43 billion and adjusted net earnings per share1 was $2.61.
“In the first half of 2026, Nutrien delivered record potash sales volumes, strong growth in proprietary products margins and further enhanced the reliability and cost position of our nitrogen assets in a dynamic global operating environment,” commented Ken Seitz, Nutrien’s President and CEO. “Our focus on operational excellence, targeted growth investments and ongoing portfolio optimization initiatives is strengthening our business, supporting structural free cash flow growth and increasing cash returns to shareholders.”
Highlights2:
-
Retail adjusted EBITDA increased to $1.24 billion in the first half of 2026 due to higher proprietary products gross margins and a strong livestock market in Australia, partially offset by lower crop nutrient sales volumes and higher fuel costs.
-
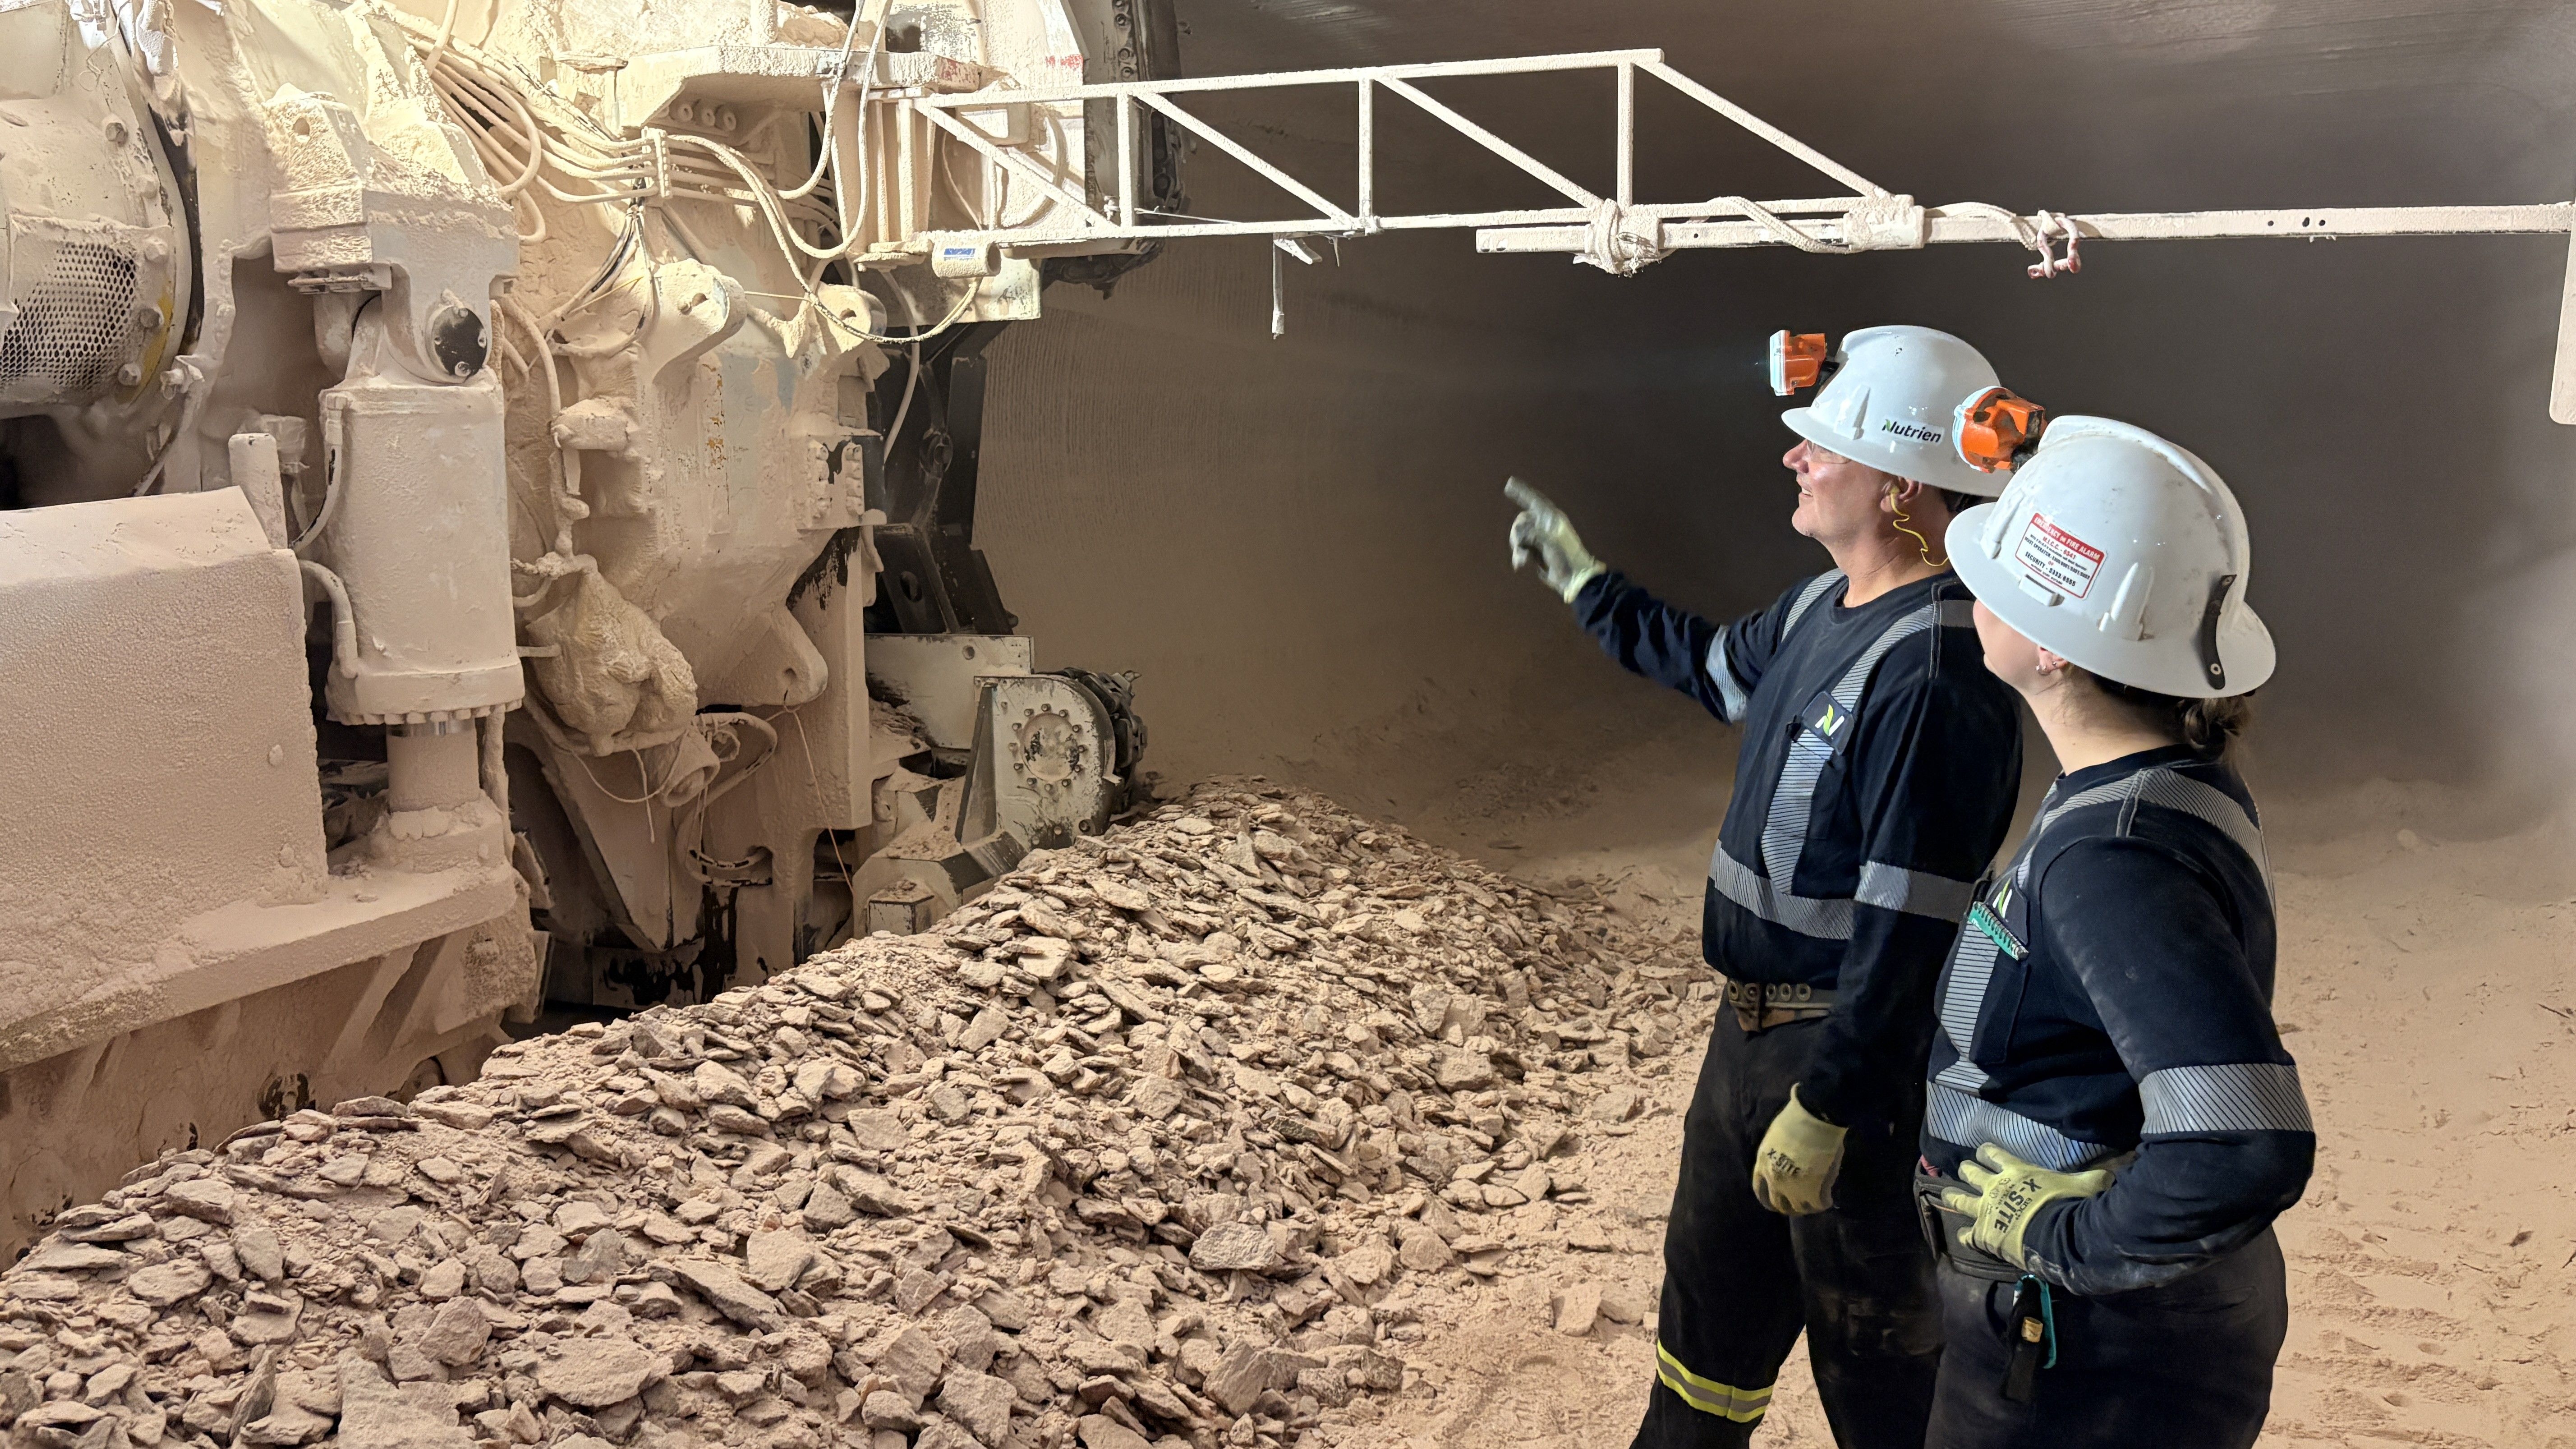
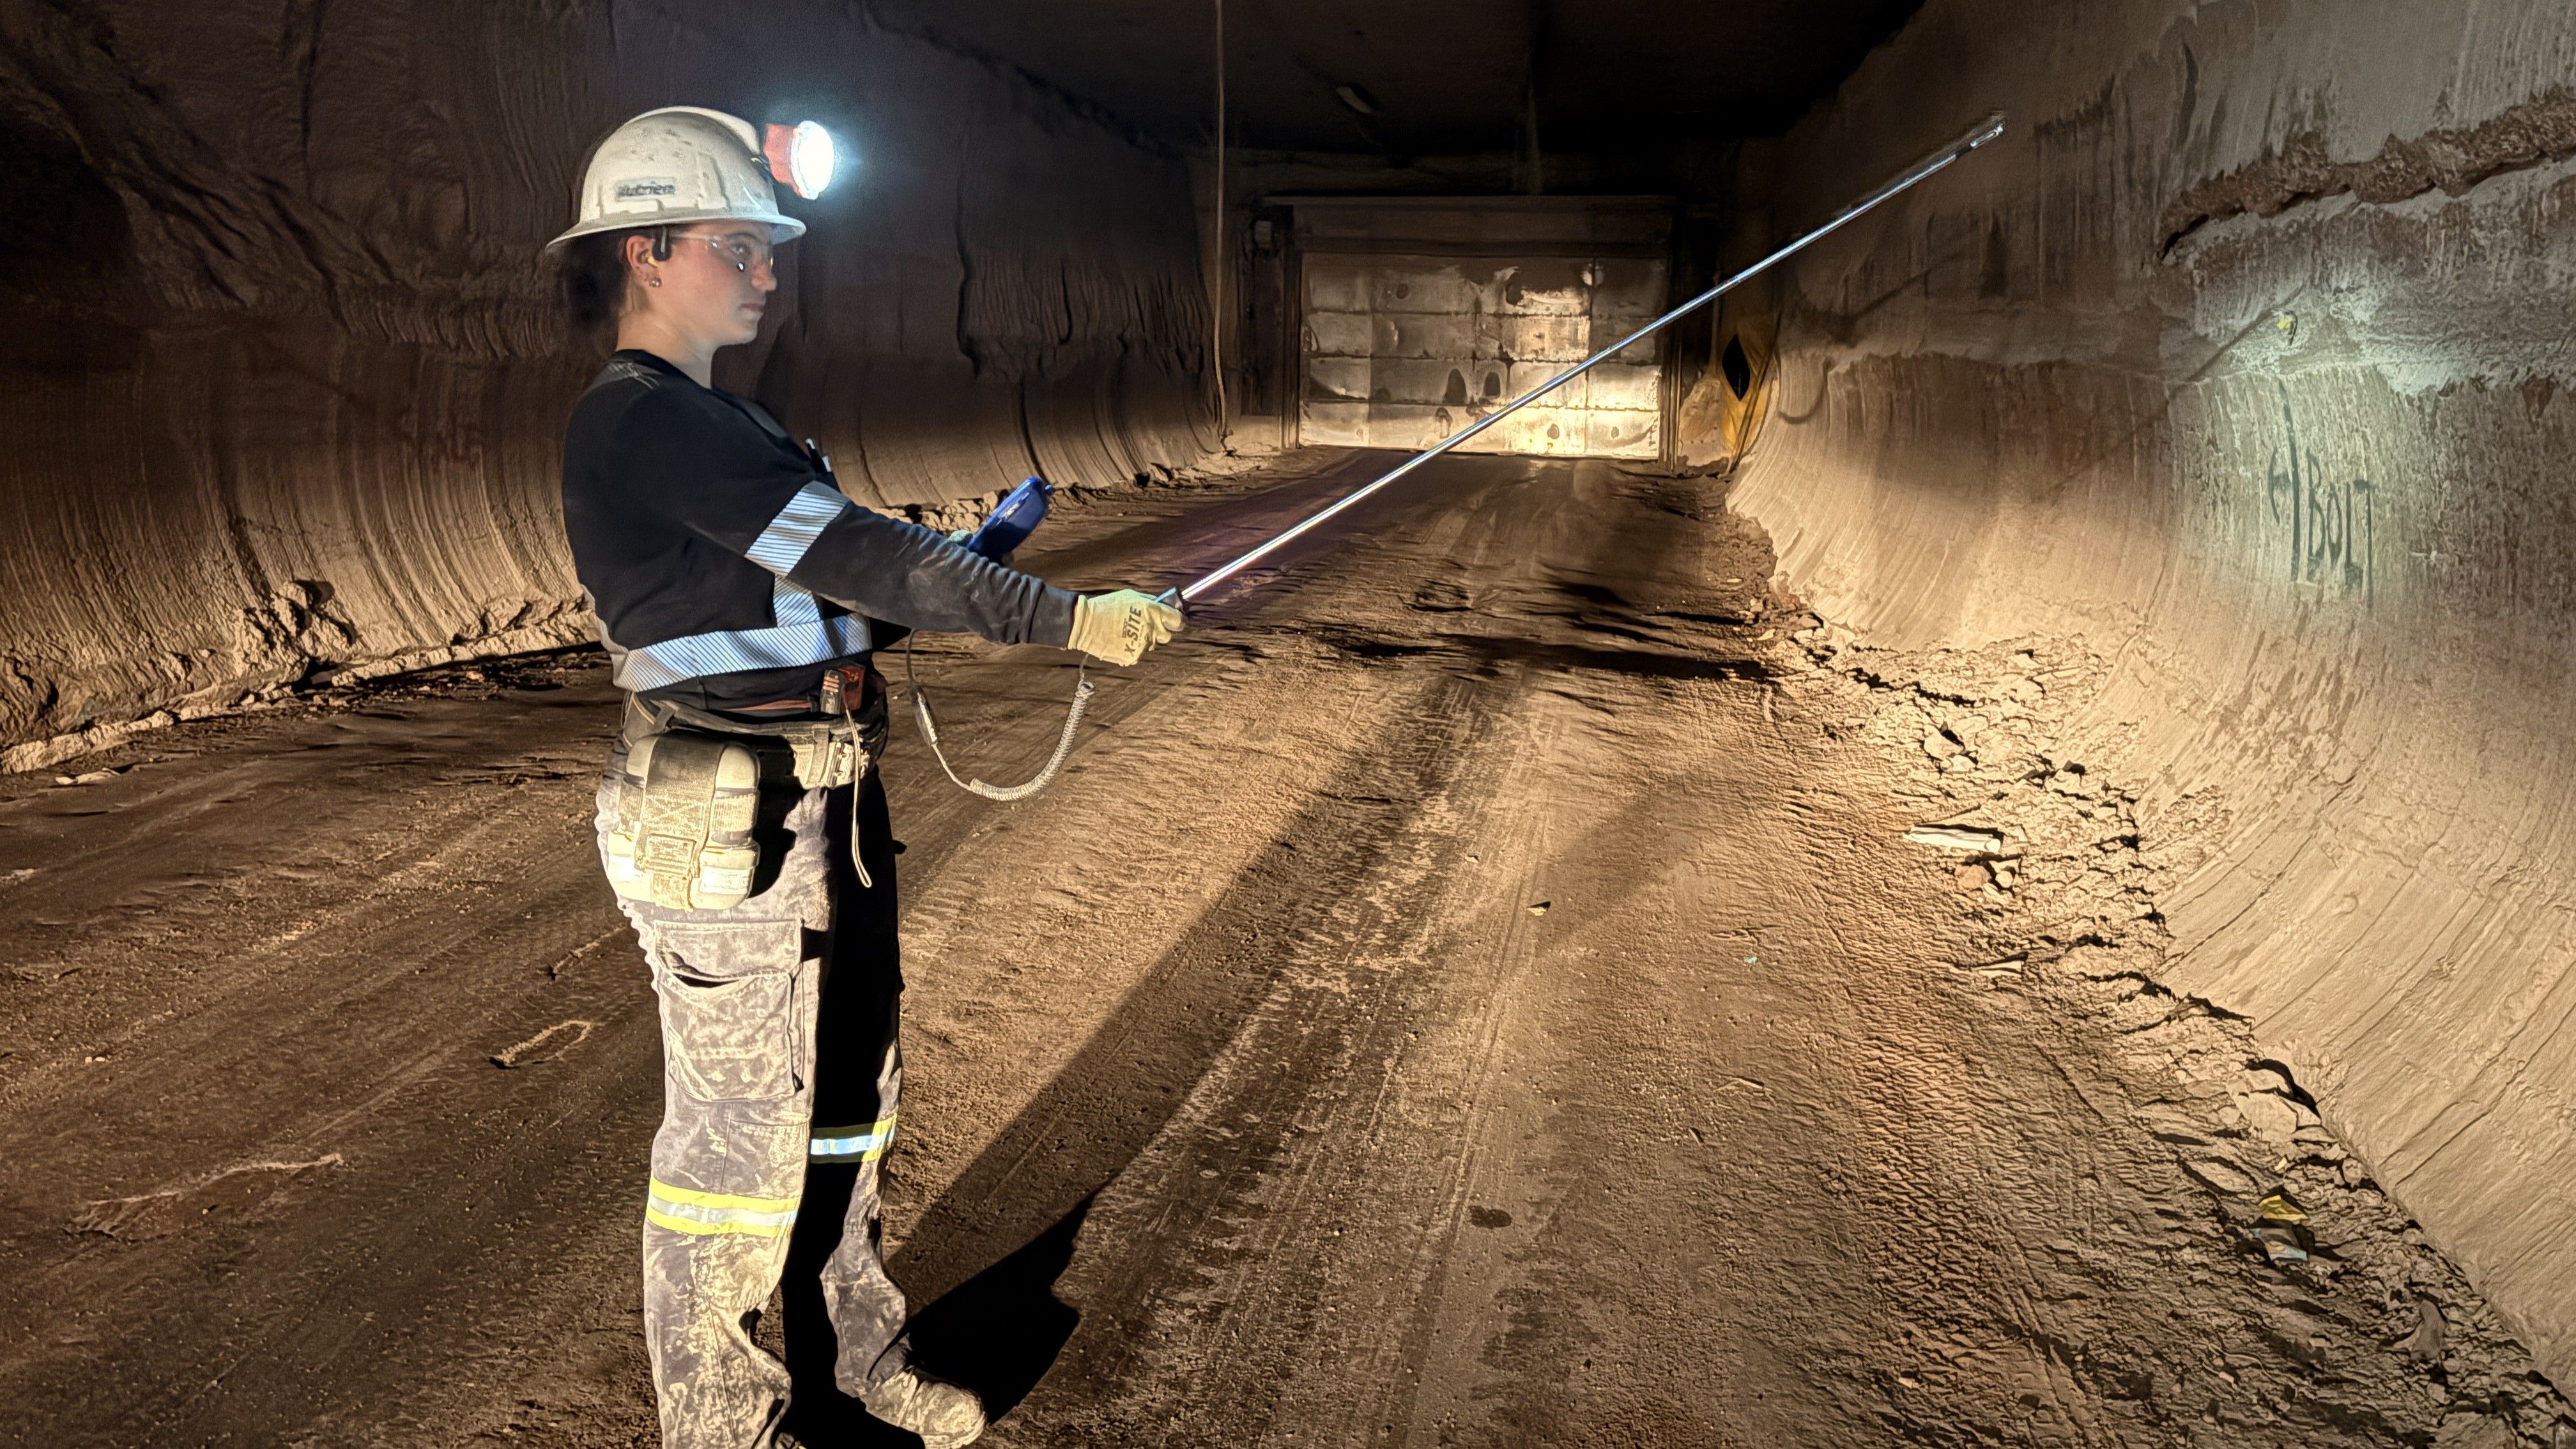
Potash adjusted EBITDA increased to $1.24 billion in the first half of 2026 due to higher global benchmarks and strong operational and supply chain execution that supported record first half sales volumes. We had record potash production and progressed mine automation, maintaining our controllable cash cost of product manufactured 1 below $60 per tonne.
-
Nitrogen adjusted EBITDA increased to $1.12 billion in the first half of 2026 due to higher global nitrogen benchmarks and lower natural gas costs. Production from our low-cost North American nitrogen plants was consistent with our plan, which included the successful execution of the largest turnaround in our Carseland facility’s history.
-
Cash provided by operating activities increased by 12 percent in the first half of 2026. We returned $848 million to shareholders in the first half of 2026 through dividends and share repurchases, including a 26 percent increase in share repurchases. We further increased the pace of share repurchases in the third quarter of 2026 and repurchased approximately $82 million of common shares in the quarter as of August 4, 2026.
-
Since June 2026, we entered into agreements to sell non-core assets for expected gross proceeds of approximately $90 million. Including these agreements, we have divested approximately $1 billion of non-core assets since the fourth quarter of 2024.
-
Remain on track to solidify the optimal path for our Phosphate business, Trinidad Nitrogen facility and Brazilian Retail business in 2026.
| 1This is a non-GAAP financial measure. See the “Non-GAAP Financial Measures” section. All references to per share amounts pertain to diluted net earnings per share, unless otherwise noted. |
| 2Our discussion of highlights set out on this page is a comparison of the results for the six months ended June 30, 2026 to the results for the six months ended June 30, 2025, unless otherwise noted. |
| |
| |
Management’s Discussion and Analysis
The following management’s discussion and analysis (“MD&A”) is the responsibility of management and is dated as of August 5, 2026. The Board of Directors (“Board”) of Nutrien carries out its responsibility for review of this disclosure principally through its Audit Committee, composed entirely of independent directors. The Audit Committee reviews and, prior to its publication, approves this disclosure pursuant to the authority delegated to it by the Board. The term “Nutrien” refers to Nutrien Ltd. and the terms “we”, “us”, “our”, “Nutrien” and “the Company” refer to Nutrien and, as applicable, Nutrien and its direct and indirect subsidiaries on a consolidated basis. Additional information relating to Nutrien (which, except as otherwise noted, is not incorporated by reference herein), including our annual report dated February 19, 2026 (“2025 Annual Report”), which includes our annual audited consolidated financial statements (“annual financial statements”) and MD&A, and our annual information form dated February 19, 2026, each for the year ended December 31, 2025, can be found on SEDAR+ at www.sedarplus.ca and on EDGAR at www.sec.gov. No update is provided to the disclosure in our 2025 annual MD&A except for material information since the date of our annual MD&A. The Company is a foreign private issuer under the rules and regulations of the US Securities and Exchange Commission (the “SEC”).
This MD&A is based on, and should be read in conjunction with, the Company’s unaudited interim condensed consolidated financial statements as at and for the three and six months ended June 30, 2026 (“interim financial statements”) based on International Financial Reporting Standards (“IFRS”) as issued by the International Accounting Standards Board and prepared in accordance with International Accounting Standard (“IAS”) 34 “Interim Financial Reporting”, unless otherwise noted. This MD&A contains certain non-GAAP financial measures and ratios and forward-looking statements, which are described in the “Non-GAAP Financial Measures” and the “Forward-Looking Statements” sections, respectively.
Market Outlook and Guidance
Agriculture and Retail Markets
-
Global agricultural markets are supported by robust grain and oilseed demand. Risks to global crop production and trade have increased due to geopolitical uncertainty and forecasts indicating El Niño conditions, which are expected to place upside pressure on crop prices.
-
In North America, firming crop prices and a focus on protecting yield potential is expected to support crop input demand in the third quarter of 2026. A faster than average pace of crop development supports the potential for an earlier start to the fall fertilizer application season.
-
In Australia, grower engagement across key cropping regions and strong livestock economics are supporting demand for retail products and services. In Brazil, soybean acreage is expected to moderately increase from the prior year and purchasing activity continues to be influenced by credit availability and affordability.
Crop Nutrient Markets
-
Global potash markets remain constructive due to favorable affordability, healthy demand in all major global markets and stable supply relative to other commodities. We have maintained our forecast for global potash shipments of 74 to 77 million tonnes in 2026 as projected shipment levels are expected to be consistent with consumption.
-
Global urea prices have strengthened in the third quarter of 2026 following a decline in the latter half of the second quarter during a seasonal low point for demand that was exacerbated this year due to evolving geopolitical developments. Global nitrogen market fundamentals are expected to remain tight in the second half of 2026, driven by ongoing trade flow disruptions, production outages, elevated energy prices and import demand from key consuming regions such as India and Brazil.
-
Global phosphate market fundamentals continue to be affected by trade flow disruptions, constrained sulfur feedstock availability and elevated costs, which have placed unsustainable pressure on phosphate producer margins and have resulted in reduced global operating rates.
Financial and Operational Guidance
-
Retail adjusted EBITDA guidance of $1.75 to $1.95 billion represents structural growth in our downstream business consistent with historical rates. The mid-point of our full-year guidance range assumes high-single digit growth in proprietary products gross margins, strong demand for crop inputs and services in Australia, increased crop nutrient margins per tonne and lower crop nutrient sales volumes compared to the prior year.
-
Potash sales volume guidance was increased to 14.2 to 14.8 million tonnes due to strong demand in key offshore markets and is consistent with our global shipment expectation.
-
Nitrogen sales volume guidance of 9.2 to 9.7 million tonnes is supported by planned reliability improvements and debottlenecking initiatives. The range reflects the completion of planned turnarounds in the third quarter of 2026 and higher ammonia operating rates in the fourth quarter compared to the prior year.
-
Phosphate sales volume guidance of 2.4 to 2.6 million tonnes reflects the benefits of reliability improvement initiatives completed in 2025.
-
Total capital expenditures guidance was lowered to $1.95 to $2.05 billion and reflects a focus on capital efficiency and structurally growing free cash flow.
All guidance expectations, including those noted above, are outlined in the table below. Refer to page 33 of our 2025 Annual Report for anticipated fertilizer pricing and natural gas price sensitivities relating to adjusted EBITDA (consolidated) and adjusted net earnings per share.
| | 2026 Guidance Ranges1 as of |
| | August 5, 2026 | | | May 6, 2026 |
| ($ billions, except as otherwise noted) | Low | | | High | | | Low | | High |
| Retail adjusted EBITDA | 1.75 | | | 1.95 | | | 1.75 | | 1.95 |
| Potash sales volumes (million tonnes)2 | 14.2 | | | 14.8 | | | 14.1 | | 14.8 |
| Nitrogen sales volumes (million tonnes)2 | 9.2 | | | 9.7 | | | 9.2 | | 9.7 |
| Phosphate sales volumes (million tonnes)2 | 2.4 | | | 2.6 | | | 2.4 | | 2.6 |
| Depreciation and amortization | 2.4 | | | 2.5 | | | 2.4 | | 2.5 |
| Finance costs | 0.65 | | | 0.75 | | | 0.65 | | 0.75 |
| Effective tax rate on adjusted net earnings (%)3 | 24.0 | | | 26.0 | | | 24.0 | | 26.0 |
| Capital expenditures4 | 1.95 | | | 2.05 | | | 2.0 | | 2.1 |
| 1 See the “Forward-Looking Statements” section. 2 Manufactured product only. 3 This is a non-GAAP financial measure. See the “Non-GAAP Financial Measures” section. 4 Comprised of sustaining capital expenditures, investing capital expenditures and mine development and pre-stripping capital expenditures, which are supplementary financial measures. See the “Other Financial Measures” section. |
| |
Consolidated Results
| | Three Months Ended June 30 | | Six Months Ended June 30 |
| | | | | | | | | | | | | | | | |
| ($ millions, except as otherwise noted) | 2026 | | | 2025 | | | % Change | | 2026 | | | 2025 | | | % Change |
| Sales | 10,812 | | | 10,438 | | | 4 | | 16,858 | | | 15,538 | | | 8 |
| Gross margin | 3,251 | | | 3,175 | | | 2 | | 4,897 | | | 4,495 | | | 9 |
| Expenses | 1,474 | | | 1,393 | | | 6 | | 2,760 | | | 2,487 | | | 11 |
| Net earnings | 1,222 | | | 1,229 | | | (1) | | 1,361 | | | 1,248 | | | 9 |
| Adjusted EBITDA1 | 2,430 | | | 2,486 | | | (2) | | 3,535 | | | 3,338 | | | 6 |
| Diluted net earnings per share (dollars)2 | 2.53 | | | 2.50 | | | 1 | | 2.80 | | | 2.52 | | | 11 |
| Adjusted net earnings per share (dollars)1, 2 | 2.61 | | | 2.65 | | | (2) | | 3.11 | | | 2.75 | | | 13 |
| 1 This is a non-GAAP financial measure. See the “Non-GAAP Financial Measures” section. 2 All references to per share amounts pertain to diluted net earnings per share, unless otherwise noted. |
| |
Net earnings and adjusted EBITDA increased in the first half of 2026, primarily due to increased global fertilizer benchmarks, higher Retail earnings and record Potash sales volumes. Net earnings and adjusted EBITDA decreased in the second quarter of 2026, as higher global fertilizer benchmarks were more than offset by lower fertilizer volumes and increased sulfur costs.
Segment Results
Our discussion of segment results set out on the following pages is a comparison of the results for the three and six months ended June 30, 2026 to the results for the three and six months ended June 30, 2025, unless otherwise noted.
Retail
| | Three Months Ended June 30 | | Six Months Ended June 30 |
| ($ millions, except as otherwise noted) | 2026 | | | 2025 | | | % Change | | 2026 | | | 2025 | | | % Change |
| Sales | 8,270 | | | 7,959 | | | 4 | | 11,910 | | | 11,049 | | | 8 |
| Cost of goods sold | 6,224 | | | 5,941 | | | 5 | | 9,064 | | | 8,345 | | | 9 |
| Gross margin | 2,046 | | | 2,018 | | | 1 | | 2,846 | | | 2,704 | | | 5 |
| Adjusted EBITDA1 | 1,131 | | | 1,149 | | | (2) | | 1,239 | | | 1,195 | | | 4 |
| 1 See Note 2 to the interim financial statements. |
| |
- Retail adjusted EBITDA increased in the first half of 2026 due to higher proprietary products gross margins and a strong livestock market in Australia. Retail adjusted EBITDA decreased in the second quarter of 2026 mainly due to lower crop nutrient sales volumes and higher fuel costs.
| | Three Months Ended June 30 | | Six Months Ended June 30 |
| | Sales | | Gross Margin | | Sales | | Gross Margin |
| ($ millions) | 2026 | | | 2025 | | 2026 | | | 2025 | | 2026 | | | 2025 | | 2026 | | | 2025 |
| Crop nutrients | 3,541 | | | 3,391 | | 695 | | | 697 | | 5,024 | | | 4,585 | | 945 | | | 916 |
| Crop protection products | 2,755 | | | 2,666 | | 707 | | | 676 | | 3,892 | | | 3,638 | | 933 | | | 867 |
| Seed | 1,278 | | | 1,278 | | 242 | | | 266 | | 1,840 | | | 1,810 | | 326 | | | 336 |
| Services and other | 308 | | | 286 | | 256 | | | 235 | | 483 | | | 432 | | 400 | | | 353 |
| Merchandise | 291 | | | 238 | | 49 | | | 44 | | 514 | | | 427 | | 85 | | | 75 |
| Nutrien Financial | 145 | | | 135 | | 145 | | | 135 | | 225 | | | 205 | | 225 | | | 205 |
| Nutrien Financial elimination1 | (48) | | | (35) | | (48) | | | (35) | | (68) | | | (48) | | (68) | | | (48) |
| Total | 8,270 | | | 7,959 | | 2,046 | | | 2,018 | | 11,910 | | | 11,049 | | 2,846 | | | 2,704 |
| 1 Represents elimination of the interest and service fees charged by Nutrien Financial to Retail branches. |
| |
-
Crop nutrients sales increased in the second quarter and first half of 2026 due to higher selling prices. Gross margin was relatively flat in the second quarter of 2026, as increased sales of proprietary nutritional products was offset by lower crop nutrient sales volumes, in particular phosphate and nitrogen products. Gross margin increased in the first half of 2026, reflecting increased sales of proprietary nutritional products.
-
Crop protection products sales and gross margin increased in the second quarter and first half of 2026 due to higher sales of proprietary products, supported by increased herbicide sales volumes in the US and earlier grower engagement in Australia.
-
Seed gross margin decreased in the second quarter and first half of 2026 primarily due to product mix shifts, partially offset by higher sales volumes, including higher-margin canola seed in Australia.
-
Services and other sales and gross margin increased in the second quarter and first half of 2026 due to a strong livestock market in Australia.
| Supplemental Data | Three Months Ended June 30 | | Six Months Ended June 30 |
| | Gross Margin | | % of Product Line1 | | Gross Margin | | % of Product Line1 |
| ($ millions, except as otherwise noted) | 2026 | | | 2025 | | 2026 | | | 2025 | | 2026 | | | 2025 | | 2026 | | | 2025 |
| Proprietary products | | | | | | | | | | | | | | | | | | | |
| Crop nutrients | 248 | | | 228 | | 36 | | | 33 | | 328 | | | 297 | | 35 | | | 32 |
| Crop protection products | 314 | | | 246 | | 45 | | | 37 | | 402 | | | 299 | | 43 | | | 34 |
| Seed | 86 | | | 87 | | 35 | | | 37 | | 107 | | | 115 | | 33 | | | 34 |
| Merchandise | 4 | | | 3 | | 8 | | | 6 | | 6 | | | 6 | | 7 | | | 7 |
| Total | 652 | | | 564 | | 32 | | | 29 | | 843 | | | 717 | | 30 | | | 27 |
| 1 Represents percentage of proprietary product margins over total product line gross margin. |
| |
| | Three Months Ended June 30 | | Six Months Ended June 30 |
| | Sales Volumes (tonnes – thousands) | | Gross Margin / Tonne (dollars) | | Sales Volumes (tonnes – thousands) | | Gross Margin / Tonne (dollars) |
| | 2026 | | | 2025 | | 2026 | | | 2025 | | 2026 | | | 2025 | | 2026 | | | 2025 |
| Crop nutrients | | | | | | | | | | | | | | | | | | | |
| North America | 3,795 | | | 4,419 | | 167 | | | 146 | | 5,395 | | | 5,883 | | 156 | | | 142 |
| International | 1,057 | | | 1,072 | | 58 | | | 48 | | 1,905 | | | 1,898 | | 54 | | | 42 |
| Total | 4,852 | | | 5,491 | | 143 | | | 127 | | 7,300 | | | 7,781 | | 129 | | | 118 |
| | | | | | | | | | | | | | | | | | | | |
| (percentages) | June 30, 2026 | | | December 31, 2025 |
| Financial performance measures1, 2 | | | | |
| Cash operating coverage ratio | 63 | | | 62 |
| Average working capital to sales | 23 | | | 22 |
| 1 Rolling four quarters. 2 These are non-GAAP financial measures. See the “Non-GAAP Financial Measures” section. |
Potash
| | Three Months Ended June 30 | | Six Months Ended June 30 |
| ($ millions, except as otherwise noted) | 2026 | | | 2025 | | % Change | | 2026 | | | 2025 | | % Change |
| Net sales | 1,053 | | | 991 | | | 6 | | 1,979 | | | 1,735 | | | 14 |
| Cost of goods sold | 446 | | | 440 | | | 1 | | 868 | | | 820 | | | 6 |
| Gross margin | 607 | | | 551 | | | 10 | | 1,111 | | | 915 | | | 21 |
| Adjusted EBITDA1 | 658 | | | 630 | | | 4 | | 1,236 | | | 1,076 | | | 15 |
| 1 See Note 2 to the interim financial statements. |
| |
- Potash adjusted EBITDA increased in the second quarter and first half of 2026 due to higher global benchmarks and strong operational and supply chain execution that supported record first half sales volumes, partially offset by higher provincial mining taxes. We had record production and progressed mine automation, maintaining our controllable cash cost of product manufactured 1 below $60 per tonne.
| Manufactured Product | Three Months Ended June 30 | | Six Months Ended June 30 |
| ($ per tonne, except as otherwise noted) | 2026 | | | 2025 | | 2026 | | | 2025 |
| Sales volumes (tonnes – thousands) | | | | | | | | | |
| North America | 922 | | | 1,038 | | 2,207 | | | 2,350 |
| Offshore | 3,021 | | | 2,951 | | 5,246 | | | 5,041 |
| Total sales volumes | 3,943 | | | 3,989 | | 7,453 | | | 7,391 |
| Net selling price | | | | | | | | | |
| North America | 295 | | | 279 | | 290 | | | 259 |
| Offshore | 259 | | | 237 | | 255 | | | 224 |
| Average net selling price | 267 | | | 248 | | 266 | | | 235 |
| Cost of goods sold | 113 | | | 110 | | 117 | | | 112 |
| Gross margin | 154 | | | 138 | | 149 | | | 123 |
| Depreciation and amortization | 47 | | | 47 | | 48 | | | 47 |
| Gross margin excluding depreciation and amortization1 | 201 | | | 185 | | 197 | | | 170 |
| 1 This is a non-GAAP financial measure. See the “Non-GAAP Financial Measures” section. |
| |
-
Sales volumes increased in the first half of 2026 due to low inventory levels and favorable potash affordability in key offshore markets.
-
Net selling price****per tonne increased in the second quarter and first half of 2026 due to higher global benchmark prices, partially offset by higher offshore freight and insurance costs.
-
Cost of goods sold per tonne increased in the second quarter and first half of 2026 primarily due to higher royalties and maintenance costs.
| Supplemental Data | Three Months Ended June 30 | | Six Months Ended June 30 |
| | 2026 | | | 2025 | | 2026 | | | 2025 |
| Production volumes (tonnes – thousands) | 3,996 | | | 3,531 | | 7,656 | | | 6,820 |
| Potash controllable cash cost of product manufactured per tonne1 | 55 | | | 55 | | 57 | | | 57 |
| Canpotex sales by market (percentage of sales volumes)2 | | | | | | | | | |
| Latin America | 47 | | | 42 | | 44 | | | 37 |
| Other Asian markets3 | 23 | | | 34 | | 26 | | | 33 |
| China | 11 | | | 8 | | 14 | | | 12 |
| India | 4 | | | ‐ | | 3 | | | 2 |
| Other markets | 15 | | | 16 | | 13 | | | 16 |
| Total | 100 | | | 100 | | 100 | | | 100 |
| 1 This is a non-GAAP financial measure. See the “Non-GAAP Financial Measures” section. 2 See Note 8 to the interim financial statements. 3 All Asian markets except China and India. |
Nitrogen
| | Three Months Ended June 30 | | Six Months Ended June 30 |
| ($ millions, except as otherwise noted) | 2026 | | | 20251, 2 | | | % Change | | 2026 | | | 20251, 2 | | | % Change |
| Net sales | 1,154 | | | 1,187 | | | | (3) | | 2,168 | | | 2,072 | | | | 5 |
| Cost of goods sold | 611 | | | 674 | | | | (9) | | 1,258 | | | 1,272 | | | | (1) |
| Gross margin | 543 | | | 513 | | | | 6 | | 910 | | | 800 | | | | 14 |
| Adjusted EBITDA2 | 635 | | | 665 | | | | (5) | | 1,117 | | | 1,070 | | | | 4 |
| 1 Comparative figures have been reclassified for our Purchase for Resale business from Nitrogen to the Corporate and Others segment. 2 See Note 2 to the interim financial statements. |
| |
- Nitrogen adjusted EBITDA increased in the first half of 2026 due to higher global nitrogen benchmarks and lower natural gas costs. Production from our low-cost North American nitrogen plants was consistent with our plan, which included the successful execution of the largest turnaround in our Carseland facility’s history. Nitrogen adjusted EBITDA decreased in the second quarter of 2026 due to lower sales volumes, partially offset by higher global benchmarks. Other expenses increased in the second quarter and first half of 2026 due to Trinidad safe mode costs incurred in connection with its controlled shutdown and the absence of Profertil equity earnings recognized in the comparable periods in 2025.
| Manufactured Product | Three Months Ended June 30 | | Six Months Ended June 30 |
| ($ per tonne, except as otherwise noted) | 2026 | | | 2025 | | 2026 | | | 2025 |
| Sales volumes (tonnes – thousands) | | | | | | | | | |
| Ammonia | 403 | | | 734 | | 701 | | | 1,230 |
| Urea and ESN® | 536 | | | 961 | | 1,284 | | | 1,756 |
| Solutions, nitrates and sulfates | 1,314 | | | 1,322 | | 2,609 | | | 2,500 |
| Total sales volumes | 2,253 | | | 3,017 | | 4,594 | | | 5,486 |
| Net selling price | | | | | | | | | |
| Ammonia | 609 | | | 408 | | 554 | | | 412 |
| Urea and ESN® | 620 | | | 509 | | 559 | | | 477 |
| Solutions, nitrates and sulfates | 335 | | | 287 | | 309 | | | 263 |
| Average net selling price | 452 | | | 387 | | 416 | | | 365 |
| Cost of goods sold | 216 | | | 219 | | 220 | | | 222 |
| Gross margin | 236 | | | 168 | | 196 | | | 143 |
| Depreciation and amortization | 56 | | | 55 | | 58 | | | 56 |
| Gross margin excluding depreciation and amortization1 | 292 | | | 223 | | 254 | | | 199 |
| 1 This is a non-GAAP financial measure. See the “Non-GAAP Financial Measures” section. |
| |
-
Sales volumes decreased in the second quarter of 2026, reflecting no production from the Trinidad and New Madrid facilities 4, planned maintenance at Carseland and deferred customer purchases. For the first half of 2026, the impact of these factors was partially offset by higher solutions, nitrates and sulfates sales volumes driven by reliability and debottlenecking initiatives.
-
Net selling price per tonne was higher in the second quarter and first half of 2026 for all major nitrogen products due to stronger global benchmark prices. In the second quarter of 2026, net selling prices reflected the portion of sales volumes established earlier in the year, prior to the onset of geopolitical conflict in the Middle East.
-
Cost of goods sold per tonne was lower in the second quarter and first half of 2026 due to lower overall natural gas costs, partially offset by higher sulfur input costs for ammonium sulfate and turnaround costs. The lower overall natural gas cost reflects a higher proportion of production from our low-cost North American nitrogen plants compared to the same periods in 2025.
| Supplemental Data | Three Months Ended June 30 | | Six Months Ended June 30 |
| | 2026 | | | 2025 | | 2026 | | | 2025 |
| Sales volumes (tonnes – thousands) | | | | | | | | | |
| Fertilizer | 1,346 | | | 1,845 | | 2,755 | | | 3,234 |
| Industrial and feed | 907 | | | 1,172 | | 1,839 | | | 2,252 |
| Production volumes (tonnes – thousands) | | | | | | | | | |
| Ammonia production – total1 | 1,056 | | | 1,535 | | 2,178 | | | 3,078 |
| Ammonia production – adjusted1, 2 | 956 | | | 1,088 | | 1,975 | | | 2,164 |
| Ammonia operating rate (%)2 | 86 | | | 98 | | 89 | | | 98 |
| Natural gas costs (dollars per MMBtu) | | | | | | | | | |
| Overall natural gas cost excluding realized derivative impact | 2.10 | | | 3.31 | | 2.72 | | | 3.61 |
| Realized derivative impact3 | ‐ | | | ‐ | | ‐ | | | ‐ |
| Overall natural gas cost | 2.10 | | | 3.31 | | 2.72 | | | 3.61 |
| 1 All figures are provided on a gross production basis in thousands of product tonnes. 2 Excludes Trinidad and Joffre. 3 Includes realized derivative impacts recorded as part of cost of goods sold or other income and expenses. 4 As previously disclosed, on October 23, 2025, the Trinidad nitrogen facility completed a controlled shutdown and we ceased production at our New Madrid nitrogen upgrade facility at year-end 2025. |
Phosphate
| | Three Months Ended June 30 | | Six Months Ended June 30 |
| ($ millions, except as otherwise noted) | 2026 | | | 2025 | | % Change | | 2026 | | | 2025 | | % Change |
| Net sales | 468 | | | 396 | | | 18 | | 953 | | | 756 | | | 26 |
| Cost of goods sold | 493 | | | 363 | | | 36 | | 982 | | | 724 | | | 36 |
| Gross margin | (25) | | | 33 | | | n/m | | (29) | | | 32 | | | n/m |
| Adjusted EBITDA1 | 23 | | | 92 | | | (75) | | 80 | | | 153 | | | (48) |
| 1 See Note 2 to the interim financial statements. |
| |
- Phosphate adjusted EBITDA decreased in the second quarter and first half of 2026 due to higher sulfur input costs, partially offset by higher global benchmarks and sales volumes compared to the same periods of 2025.
| Manufactured Product | Three Months Ended June 30 | | Six Months Ended June 30 |
| ($ per tonne, except as otherwise noted) | 2026 | | | 2025 | | 2026 | | | 2025 |
| Sales volumes (tonnes – thousands) | | | | | | | | | |
| Fertilizer | 409 | | | 374 | | 877 | | | 706 |
| Industrial and feed | 181 | | | 169 | | 371 | | | 337 |
| Total sales volumes | 590 | | | 543 | | 1,248 | | | 1,043 |
| Net selling price | | | | | | | | | |
| Fertilizer | 719 | | | 666 | | 692 | | | 661 |
| Industrial and feed | 919 | | | 821 | | 901 | | | 819 |
| Average net selling price | 781 | | | 714 | | 754 | | | 712 |
| Cost of goods sold | 812 | | | 646 | | 766 | | | 672 |
| Gross margin | (31) | | | 68 | | (12) | | | 40 |
| Depreciation and amortization | 117 | | | 125 | | 113 | | | 134 |
| Gross margin excluding depreciation and amortization1 | 86 | | | 193 | | 101 | | | 174 |
| 1 This is a non-GAAP financial measure. See the “Non-GAAP Financial Measures” section. |
| |
-
Sales volumes were higher in the second quarter and the first half of 2026 due to higher production volumes from reliability improvements compared to the first half of 2025.
-
Net selling price per tonne increased in the second quarter and first half of 2026 due to stronger global benchmark prices.
-
Cost of goods sold per tonne increased in the second quarter and first half of 2026 primarily due to higher sulfur input costs.
| Supplemental Data | Three Months Ended June 30 | | Six Months Ended June 30 |
| | 2026 | | | 2025 | | 2026 | | | 2025 |
| Production volumes (P2O5 tonnes – thousands) | 319 | | | 333 | | 656 | | | 615 |
| P2O5 operating rate (%) | 75 | | | 79 | | 78 | | | 73 |
| | | | | | | | | | |
Corporate and Others and Eliminations
| | Three Months Ended June 30 | | Six Months Ended June 30 |
| ($ millions, except as otherwise noted) | 2026 | | | 20251, 2 | | | % Change | | 2026 | | | 20251, 2 | | | % Change |
| Corporate and Others | | | | | | | | | | | | | | | |
| Gross margin2 | ‐ | | | 4 | | | n/m | | 14 | | | 18 | | | (22) |
| Selling recovery | ‐ | | | (1) | | | n/m | | (3) | | | (4) | | | (25) |
| General and administrative expenses | 100 | | | 95 | | | 5 | | 211 | | | 194 | | | 9 |
| Share-based compensation (recovery) expense | (41) | | | 49 | | | n/m | | 75 | | | 91 | | | (18) |
| Foreign exchange loss, net of related derivatives | 13 | | | 22 | | | (41) | | 18 | | | 29 | | | (38) |
| Other expenses | 87 | | | 46 | | | 89 | | 97 | | | 64 | | | 52 |
| Adjusted EBITDA2 | (89) | | | (102) | | | (13) | | (173) | | | (180) | | | (4) |
| Eliminations | | | | | | | | | | | | | | | |
| Gross margin | 80 | | | 56 | | | 43 | | 45 | | | 26 | | | 73 |
| Adjusted EBITDA2 | 72 | | | 52 | | | 38 | | 36 | | | 24 | | | 50 |
| 1 Comparative figures have been reclassified for our Purchase for Resale business from Nitrogen to the Corporate and Others segment. 2 See Note 2 to the interim financial statements. |
-
Share-based compensation (recovery) expense was a recovery in the second quarter and a lower expense in the first half of 2026 due to a decrease in the fair value of our share-based awards. The fair value of our share-based awards takes into consideration several factors, such as our share price movement, our performance relative to our peer group and our return on invested capital.
-
Other expenses increased in the second quarter and first half of 2026 due to higher restructuring costs associated with portfolio optimization initiatives.
Finance Costs, Income Taxes and Other Comprehensive (Loss) Income
| | Three Months Ended June 30 | | Six Months Ended June 30 |
| ($ millions, except as otherwise noted) | 2026 | | | 2025 | | | % Change | | 2026 | | | 2025 | | | % Change |
| Finance costs | 173 | | | 155 | | | 12 | | 349 | | | 334 | | | 4 |
| Income taxes | | | | | | | | | | | | | | | |
| Income tax expense | 382 | | | 398 | | | (4) | | 427 | | | 426 | | | ‐ |
| Actual effective tax rate including discrete items (%) | 24 | | | 24 | | | ‐ | | 24 | | | 25 | | | (4) |
| Other comprehensive (loss) income | (30) | | | 184 | | | n/m | | 36 | | | 209 | | | (83) |
| | | | | | | | | | | | | | | | |
- Other comprehensive (loss) income is primarily driven by changes in the currency of our foreign operations. There was a loss in the second quarter and lower income in the first half of 2026 due to lower appreciation of the Australian and Brazilian currencies and depreciation of the Canadian currency, relative to the US dollar, compared to the same periods in 2025.
Liquidity and Capital Resources
Sources and uses of liquidity
We continued to manage our capital in accordance with our current capital allocation strategy. We believe that our internally generated cash flow, supplemented by available borrowings under new or existing financing sources, if necessary, will be sufficient to meet our anticipated capital expenditures, planned growth and development activities, and other cash requirements for the foreseeable future. Refer to the “Capital Structure and Management” section for details on our existing long-term debt and credit facilities.
Sources and uses of cash
| | Three Months Ended June 30 | | Six Months Ended June 30 |
| ($ millions, except as otherwise noted) | 2026 | | | 2025 | | | % Change | | 2026 | | | 2025 | | | % Change |
| Cash provided by operating activities | 2,484 | | | 2,538 | | | (2) | | 1,633 | | | 1,456 | | | 12 |
| Cash used in investing activities | (505) | | | (495) | | | 2 | | (992) | | | (738) | | | 34 |
| Cash used in financing activities | (1,822) | | | (1,572) | | | 16 | | (396) | | | (207) | | | 91 |
| Cash used for dividends and share repurchases1 | (439) | | | (373) | | | 18 | | (848) | | | (786) | | | 8 |
| 1 This is a supplementary financial measure. See the “Other Financial Measures” section. |
| |
| Cash provided by operating activities | * Decreased in the second quarter of 2026 as higher global fertilizer benchmarks were more than offset by lower fertilizer volumes and increased sulfur costs. * Increased in the first half of 2026 due to increased global fertilizer benchmarks, higher Retail earnings and record Potash sales volumes. |
| Cash used in investing activities | * Increased in the second quarter and first half of 2026, primarily due to the absence of proceeds from the sale of our investment in Sinofert Holdings Limited recognized in the comparable period. In the first half of 2026 capital expenditures increased due to the timing of turnaround activities in Nitrogen as well as an increase in cash used on business acquisitions. |
| Cash used in financing activities | * Increased in the second quarter and first half of 2026 due to higher commercial paper repayments, partially offset by the issuance of $1.0 billion in senior notes in the second quarter of 2026 with no comparable issuance in the second quarter of 2025. In addition, we repaid senior notes maturing in the second quarter of 2025 with no comparable repayment in the second quarter of 2026. |
| Cash used for dividends and share repurchases | * Increased in the second quarter and first half of 2026 due to higher share repurchases. |
| | |
Financial Condition Review
The following is a comparison of balance sheet categories that are considered material:
| | As at | | | | | | |
| ($ millions, except as otherwise noted) | June 30, 2026 | | | December 31, 2025 | | | $ Change | | | % Change |
| Assets | | | | | | | | | | |
| Cash and cash equivalents | 921 | | | 701 | | | 220 | | | 31 |
| Receivables | 8,687 | | | 5,675 | | | 3,012 | | | 53 |
| Inventories | 6,164 | | | 6,977 | | | (813) | | | (12) |
| Prepaid expenses and other current assets | 395 | | | 1,396 | | | (1,001) | | | (72) |
| Property, plant and equipment | 22,672 | | | 22,747 | | | (75) | | | ‐ |
| Liabilities and Shareholders' Equity | | | | | | | | | | |
| Short-term debt | 527 | | | 873 | | | (346) | | | (40) |
| Trade, other payables and accrued liabilities | 9,296 | | | 9,309 | | | (13) | | | ‐ |
| Long-term debt, including current portion | 10,861 | | | 9,863 | | | 998 | | | 10 |
| Share capital | 13,446 | | | 13,519 | | | (73) | | | (1) |
| Retained earnings | 12,694 | | | 12,076 | | | 618 | | | 5 |
| | | | | | | | | | | |
-
Explanations for changes in Cash and cash equivalents are in the “Liquidity and Capital Resources - Sources and uses of cash” section.
-
Receivables increased primarily due to the seasonality of Retail sales and a strategic extension of credit terms to our Retail customers.
-
Inventories decreased due to the seasonality of our Retail segment. Our North American inventory levels generally increase at year-end, peak in the first quarter of the year in preparation for the planting and application seasons, and are drawn down in the succeeding quarters.
-
Prepaid expenses and other current assets decreased due to Retail taking delivery of prepaid inventories during the planting and application season in North America.
-
Short-term debt decreased due to repayments of, and lower draws on, our credit facilities due to the issuance of $1.0 billion of senior notes.
-
Trade, other payables and accrued liabilities decreased due to lower customer prepayments in North America as Retail customers took delivery of prepaid sales, as well as settlement of our Retail supplier financing arrangements in 2026 that were entered into in the fourth quarter of 2025. This was partially offset by higher income tax payable as our tax provision exceeded payments.
-
Long-term debt, including current portion, increased due to the issuance of $1.0 billion of senior notes in the second quarter of 2026, the net proceeds of which were used to pay short-term debt.
Capital Structure and Management
Principal debt instruments
As part of the normal course of business, we closely monitor our liquidity position. We use a combination of cash generated from operations and short-term and long-term debt to finance our operations. We continually evaluate various financing arrangements and may seek to engage in transactions from time to time when market and other conditions are favorable. We were in compliance with our debt covenants and did not have any changes to our credit ratings for the six months ended June 30, 2026.
Capital structure (debt and equity)
| ($ millions) | June 30, 2026 | | | December 31, 2025 |
| Short-term debt | 527 | | | 873 |
| Current portion of long-term debt | 1,434 | | | 513 |
| Current portion of lease liabilities | 366 | | | 346 |
| Long-term debt | 9,427 | | | 9,350 |
| Lease liabilities | 974 | | | 937 |
| Shareholders' equity | 25,938 | | | 25,365 |
| | | | | |
Commercial paper, credit facilities and other debt
We have a total facility limit of approximately $7,310 million comprised of several credit facilities available in the jurisdictions where we operate. In North America, we have a commercial paper program, which is limited to the undrawn amount under our $4,500 million unsecured revolving term credit facility and excess cash invested in highly liquid securities.
As at June 30, 2026, we utilized $540 million of our total facility limit, which includes $419 million of commercial paper outstanding. During the first half of 2026, we extended the maturity of our accounts receivable purchase facility from March 6, 2026 to March 31, 2028 and entered into a $69 million uncommitted revolving demand facility.
As at June 30, 2026, $231 million in letters of credit were outstanding and committed, with $258 million of remaining credit available under our letter of credit facilities.
Our long-term debt consists primarily of notes and debentures. See the “Capital Structure and Management” section of our 2025 Annual Report for information on balances, rates and maturities for our notes and debentures. During the first half of 2026, we issued $500 million of 4.850 percent senior notes due May 29, 2031 and $500 million of 5.350 percent senior notes due May 29, 2036. See Note 6 to the interim financial statements.
Outstanding share data
| | As at August 4, 2026 | |
| Common shares | 477,210,074 | |
| Options to purchase common shares | 1,890,151 | |
| | | |