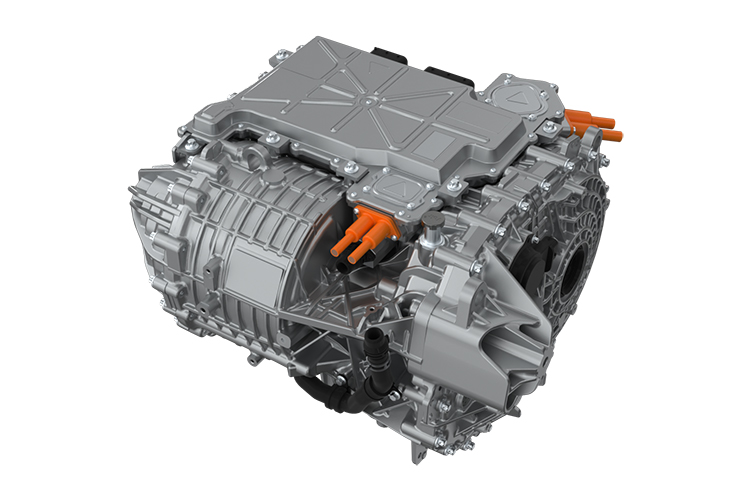
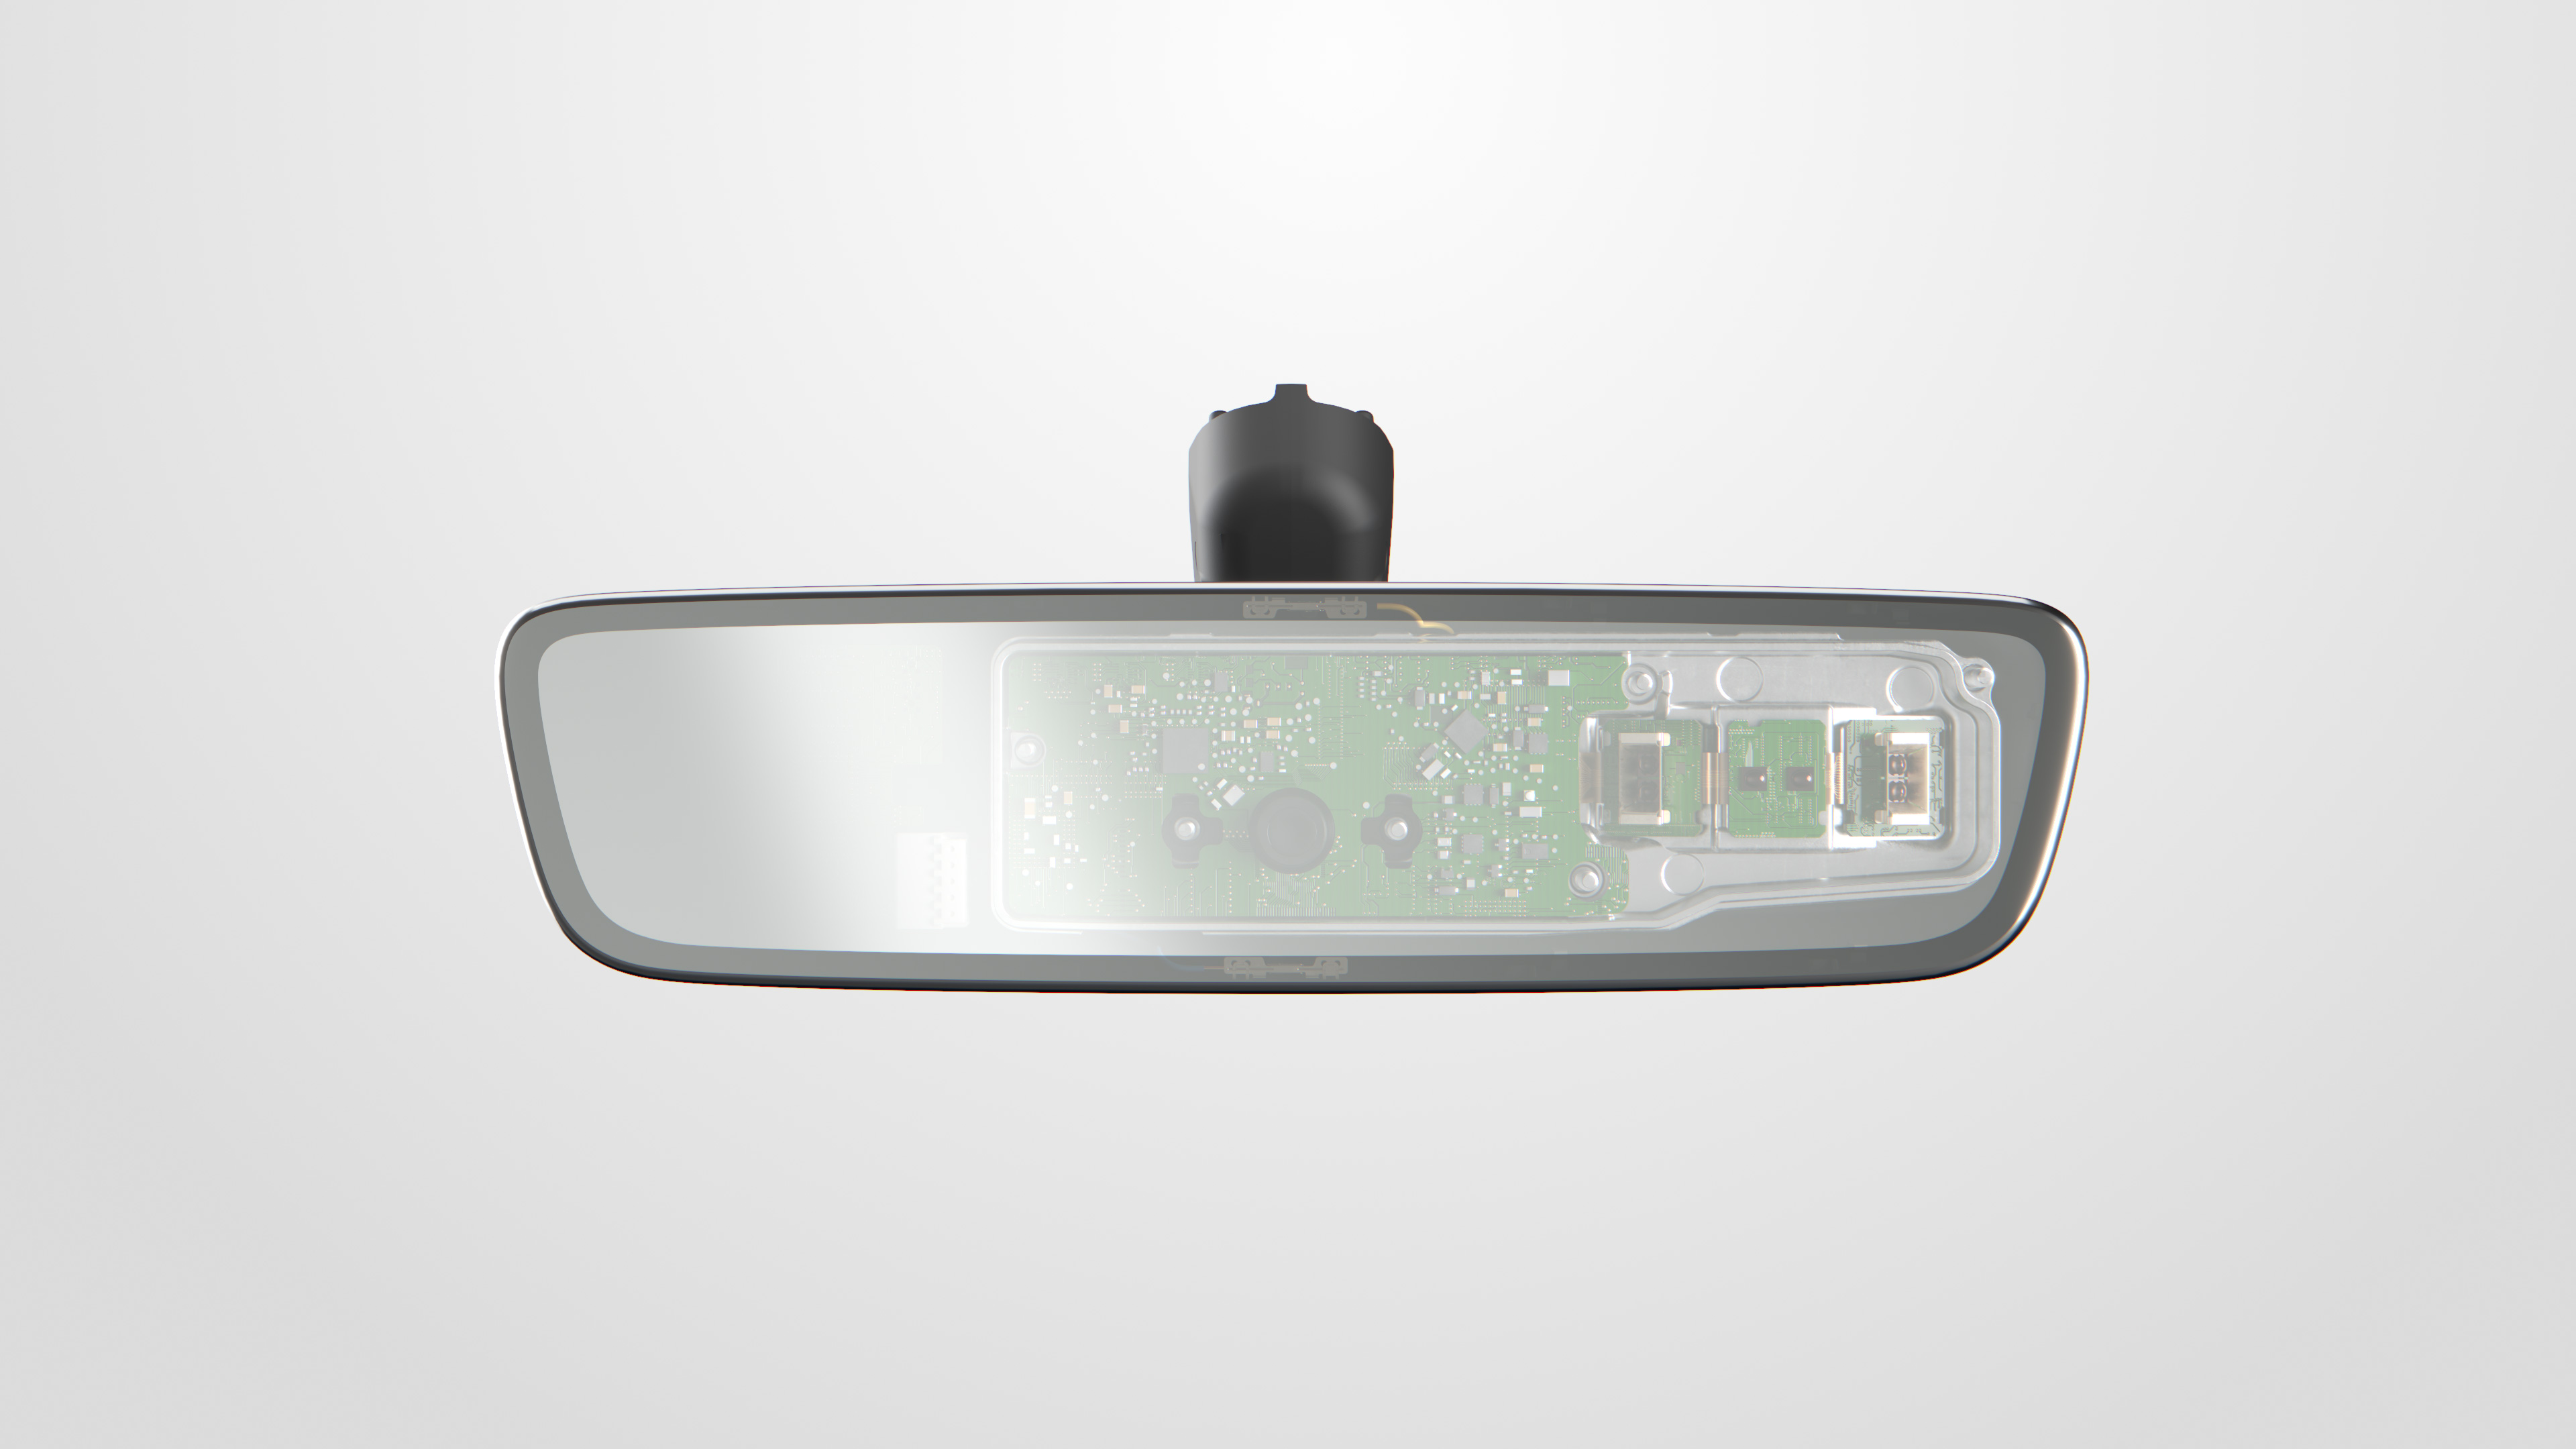
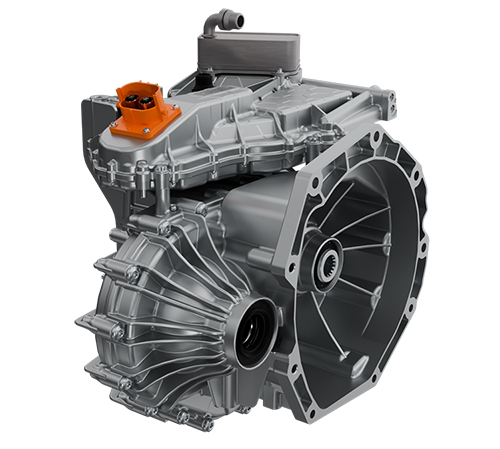
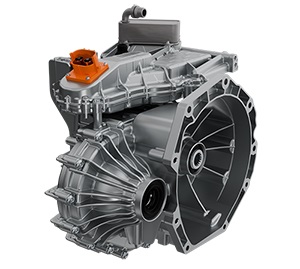
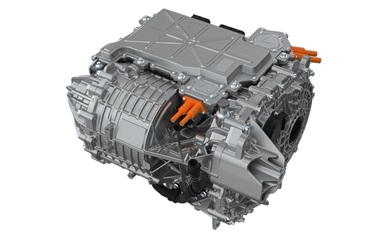
Magna International, Inc. is an automotive supplier that designs, engineers, and manufactures vehicle components and systems for original equipment manufacturers (OEMs). The company operates through four segments: Body Exteriors & Structures, Power & Vision, Seating Systems, and Complete Vehicles. Its products include body and chassis systems, all-wheel drive and four-wheel-drive systems, transmissions, latches, mirrors, exteriors, seating, advanced driver assistance systems (ADAS), electrification components such as eDrives, and lighting. The company also provides contract vehicle assembly services. Magna serves major global automakers in North America, Europe, and China, supplying systems for both internal combustion engine and electric vehicles. It was incorporated in 1961.

Summarised from the annual information form, filed Mar 2026

Industry Auto Parts Homepage magna.com
Sector Consumer Cyclical IR page magna.com/company/investors
Tags
contract vehicle assembly, advanced driver assistance systems, electric vehicle components, seating systems, body and chassis, transmissions, powertrain systems, eDrive, ADAS, MAFACT, Chery, General Motors
Press page magna.com/newsroom

Metrics

Valuation  
Market cap —
Market cap (USD) —
P/E 22.73
PEG 2.02
P/BV —
P/S —
P/OCF —
P/FCF —
Dividend yield —
Turnover / mcap —
Returns  
ROE 7.1%
ROI 6.9%
ROIC 6.9%
Profit margin 2.1%
Growth  
Revenue growing No
Profits growing No
Revenue up 3y No
Revenue up 5y No
Earnings growth 3y (net profit CAGR) 11.3%
Quality  
Profitable Yes
Margin expanding No
Buying back stock —
Diluting (TTM) —
Debt/Equity —
Podcast bulls (TTM) Sign up
Podcast bears (TTM) Sign up
Podcast sentiment (TTM) Sign up
Podcast sentiment % (TTM) Sign up
News sentiment (TTM) 0
Quality score 0%
Insiders  
Buys, 1w Sign up
Buys, 1m Sign up
Buys, 1y Sign up
Sells, 1w Sign up
Sells, 1m Sign up
Sells, 1y Sign up

Sign up to see this company's insider trades

Figure FY 2025 FY 2024 FY 2023 FY 2022 FY 2021 FY 2020 FY 2019 FY 2018 FY 2017 FY 2016 FY 2015 FY 2014 FY 2013 FY 2012 FY 2011 FY 2010
Revenue 42.01B 42.836B 42.797B 37.84B 36.242B 32.647B 39.431B 40.827B 38.946B 36.445B 32.134B 36.641B 34.835B 30.837B 28.748B 23.465B
Net profit 829M 1.009B 1.213B 592M 1.514B 757M 1.765B 2.296B 2.206B 2.031B 2.013B 1.882B 1.561B 1.433B 1.018B 1.003B
Free cash flow 2.285B 1.456B 649M 414M 1.568B 2.133B 2.519B 2.068B 1.471B 1.579B 741M 1.206B 1.398B 932M -26M 1.132B

Figure FY 2025 FY 2024 FY 2023 FY 2022 FY 2021 FY 2020 FY 2019 FY 2018 FY 2017 FY 2016 FY 2015 FY 2014 FY 2013 FY 2012 FY 2011 FY 2010
Share price 53.3 41.79 59.08 56.18 80.94 70.8 54.84 45.45 56.67 43.4 40.56 108.69 82.06 49.98 33.47 —
Price performance 12m 0.28 -0.29 0.05 -0.31 0.14 0.29 0.21 -0.2 0.31 0.07 -0.63 0.32 0.64 0.49 — —

Filed figures

Figure Dec 2016 Dec 2017 Dec 2018 Dec 2019 Dec 2020 Dec 2021 Dec 2022 Dec 2023 Dec 2024 Dec 2025
Balance sheet detail
Trade receivables (USD) 6.17B 6.88B 6.55B 5.93B 6.39B 6.31B 6.79B 7.88B 7.38B 7.59B
↳ YoY growth +13.3% +11.6% -4.8% -9.5% +7.9% -1.4% +7.7% +16.1% -6.4% +2.9%
↳ 5y CAGR +7.0% +7.6% +4.5% +1.0% +3.3% +0.5% -0.3% +3.8% +4.5% +3.5%
Borrowings, current (USD) 762M 367M 1.3B 106M 129M 455M 662M 1.33B 979M 27M
Borrowings, non-current (USD) 2.39B 3.2B 3.08B 3.06B 3.97B 3.54B 2.85B 4.18B 4.13B 4.69B
Lease liabilities (USD) — — — 1.83B 1.9B 1.68B 1.56B 1.72B 1.96B 1.98B
Cash and deposits (USD) 974M 726M 684M 1.28B 3.27B 2.95B 1.23B 1.2B 1.25B 1.61B
Intangible assets (USD) 621M 650M 560M 484M 481M 493M 452M 876M 738M 490M
Right-of-use assets (USD) — — — 1.81B 1.91B 1.7B 1.6B 1.74B 1.94B 1.93B
Net debt (borrowings + leases - cash) (USD) 2.18B 2.84B 3.7B 3.72B 2.73B 2.73B 3.84B 6.03B 5.82B 5.08B
Cash flow detail
Operating cash flow (USD) 3.39B 3.33B 3.72B 3.96B 3.28B 2.94B 2.1B 3.15B 3.63B 3.6B
Purchases of property, plant and equipment (USD) -1.81B -1.86B -1.65B -1.44B -1.15B -1.37B -1.68B -2.5B -2.18B -1.31B
Change in receivables (cash effect) (USD) -446M -297M -351M 629M -42M 114M -798M -819M 454M 835M
Change in inventories (cash effect) (USD) -159M -362M -92M 104M 37M -653M -448M -196M 153M 248M
Change in payables (cash effect) (USD) 562M 494M 265M -519M 274M 160M 812M 609M -357M -697M
Dividends paid (cash effect) (USD) -385M -400M -448M -449M -467M -514M -514M -522M -539M -544M
Share buybacks (cash effect) (USD) -913M -1.27B -1.83B -1.29B -203M -517M -780M -13M -207M -137M
Interest paid (cash effect) (USD) -99M -88M -115M -103M -104M -122M -128M -242M -309M -270M
Income taxes paid (cash effect) (USD) -707M -782M -665M -484M -336M -341M -560M -546M -499M -610M
Operating cash flow before change in receivables (USD) 3.83B 3.63B 4.07B 3.33B 3.32B 2.83B 2.89B 3.97B 3.18B 2.76B
Free cash flow (OCF - PPE - intangibles) (USD) 1.58B 1.47B 2.07B 2.52B 2.13B 1.57B 414M 649M 1.46B 2.29B
Income detail
Research and development expense (USD) 460M 522M 588M 640M 830M 634M 649M 862M 874M 792M
↳ 5y CAGR +6.6% +4.5% +8.0% +6.4% -0.9%
Total comprehensive income (USD) 2.05B 3.13B 1.7B 1.67B 1.03B 1.39B 382M 1.49B 387M 1.73B
Comprehensive income to owners (USD) 2.03B 3.05B 1.69B 1.81B 1.11B 1.34B 369M 1.43B 316M 1.64B
Reported Mar 29, 2018 Mar 29, 2018 Mar 29, 2019 Mar 27, 2020 Mar 29, 2021 Mar 28, 2022 Mar 31, 2023 Mar 28, 2024 Mar 28, 2025 Mar 27, 2026

Sign up to see institutional holdings

Sign Up

Podcast Mentions

Sign up to see podcast mentions and sentiment

Sign Up

Magna Unveils 2030 Financial Targets at Investor Day Bull 3 Bear 0 Guidance

AURORA, Ontario, Nov. 11, 2026 (GLOBE NEWSWIRE) -- Magna International Inc. (TSX: MG; NYSE: MGA) is holding an Investor Day this morning in New York City, where it will showcase The Power of Magna. The presentation materials include new and compelling mid-term financial targets covering the period through 2030. The targets reflect Magna's strategy to grow above market, execute with excellence and deploy capital with discipline.

Financial Targets:

Organic sales growth: 2-4% above market on a compound annual basis through 2030

Adjusted EBIT margin: 200+ basis points of margin improvement from 2026 through 2030

Adjusted EPS: Compound annual growth of at least 15% through 2030

Free cash flow (FCF): Average FCF conversion on adjusted net income of at least 85% over the 2027-2030 period

Adjusted ROIC: Greater than 15% by 2030

Magna has solid visibility into its growth, with more than 90% of expected 2028 sales and more than 60% of expected 2030 sales supported by existing business and awarded programs. The company recently renewed its normal course issuer bid (NCIB) and intends to fully complete the repurchase of almost 26 million shares over the next 12 months.

Magna Announces Renewal of Normal Course Issuer Bid Bull 3 Bear 0 Capital return

NCIB authorizes the discretionary repurchase of up to 25,778,000 Magna Common Shares, representing approximately 10% of Magna’s public float

NCIB takes effect on November 9, 2026, and terminates no later than November 8, 2027

AURORA, Ontario, Nov. 05, 2026 (GLOBE NEWSWIRE) -- Magna International Inc. (TSX: MG; NYSE: MGA) announces today the Toronto Stock Exchange’s (the "TSX") acceptance of its notice of intention to renew its normal course issuer bid (the "Notice"). Pursuant to the Notice, Magna may purchase up to 25,778,000 Magna Common Shares (the "NCIB"), representing approximately 10% of its public float. As at October 31, 2026, Magna had 258,383,499 issued and outstanding Common Shares, including a public float of 257,862,127 Common Shares.

The primary purposes of the NCIB are to facilitate purchases for cancellation, as well as purchases to fund Magna’s stock-based compensation awards and programs. Magna may purchase its Common Shares for cancellation, from time to time, if it believes that the market price of its Common Shares is attractive and that the purchase would be an appropriate use of corporate funds and in the best interests of the Corporation.

Friday - October 30, 2026
8:00 AM ET

  • Aurora, Ontario, Canada
  • October 08, 2026
  • 2-min read

Download the PDF of the release

LIVE AUDIO WEBCAST & REPLAY*

Click here to register and access replay: https://events.q4inc.com/attendee/258579312

DIAL-IN DETAILS

USA Toll-Free: 1-833-461-5787

International Toll: 1-585-542-9983

Meeting ID: 258579312

Slide presentation will be available on our website Investors | Magna prior to the call.

*Note: Replay available 2 hours after call until November 6, 2026

INVESTOR CONTACT
Louis Tonelli, Vice-President, Investor Relations
[email protected] , 905-726-7035

WEBCAST CONTACT
Nancy Hansford, Executive Assistant, Investor Relations
[email protected] , 905-726-7108

ABOUT MAGNA
Magna is one of the world’s largest automotive suppliers and a trusted partner to automakers in the industry’s most critical markets—North America, Europe, and Asia. With operations in 28 countries, we combine global scale with trusted reliability and proven execution. Backed by nearly seven decades of experience, we bring together deep manufacturing expertise with innovative vehicle systems to deliver performance, safety, and quality.

Prompts

Magna International, Inc. (ticker MGA), listed in Canada.

ETFs Holding Magna International, Inc.

ETF Weight in ETF Shares Market value As of
JHID 1.28% 2,123 $ 139.553K Jun 30, 2026
TDI 1.13% 61,964 $ 4.075M Jun 30, 2026
DSTX 1.02% 7,309 $ 479.909K Jun 30, 2026
FYLD 0.98% 101,437 $ 6.957M Jul 31, 2026
VUS 0.64% 1,672 $ 114.699K Jul 31, 2026
GMOI 0.64% 67,251 $ 4.41M Aug 31, 2026
HWSM 0.61% 255 $ 16.743K Jun 30, 2026
ESIM 0.52% 1,370 $ 93.982K Jul 31, 2026
GINX 0.49% 7,945 $ 520.954K Aug 31, 2026
RFDA 0.48% 6,001 $ 393.486K Aug 31, 2026
GVLU 0.44% 18,577 $ 1.138M Nov 17, 2026
AVIV 0.43% 146,374 $ 8.969M Nov 16, 2026
VDI 0.40% 947 $ 64.946K Jul 31, 2026
RINT 0.39% 8,329 $ 547.691K Jun 30, 2026
ESUM 0.34% 9,040 $ 620.144K Jul 31, 2026
DFIV 0.33% 1,202,042 $ 74.973M Nov 12, 2026
AVSD 0.27% 16,680 $ 1.022M Nov 16, 2026
DIHP 0.27% 282,753 $ 17.635M Nov 12, 2026
JSTC 0.23% 11,205 $ 686.351K Nov 17, 2026
NBIE 0.20% 7,686 $ 504.655K Aug 31, 2026
DXIV 0.18% 7,132 $ 444.823K Nov 12, 2026
AVDE 0.16% 496,214 $ 30.407M Nov 16, 2026
DFIC 0.16% 393,504 $ 24.543M Nov 12, 2026
DFSI 0.11% 20,588 $ 1.284M Nov 12, 2026
DFAX 0.11% 208,493 $ 13.004M Nov 12, 2026
TIER 0.10% 508 $ 34.839K Jul 31, 2026
DFAI 0.10% 280,405 $ 17.49M Nov 12, 2026
TACU 0.07% 211 $ 12.928K Nov 17, 2026
EBI 0.00% 12 $ 786.84 Aug 31, 2026

Securities

Ticker Type Class Market Exchange Last price Price date
MGA Common share — US nyse 63.67 USD 2026-09-30
MG canonical Common share — CA tsx 89.40 CAD 2026-11-19