September 28, 2026 Sept. 28, 2026 Line 5 bypass/incident update (posted at 6:30 p.m. CT) Enbridge crews continue to focus on environmental testing and remediation. Soils from the construction excavation are being tested, removed, and sent for…
September 28, 2026
Sept. 28, 2026 Line 5 bypass/incident update (posted at 6:30 p.m. CT)
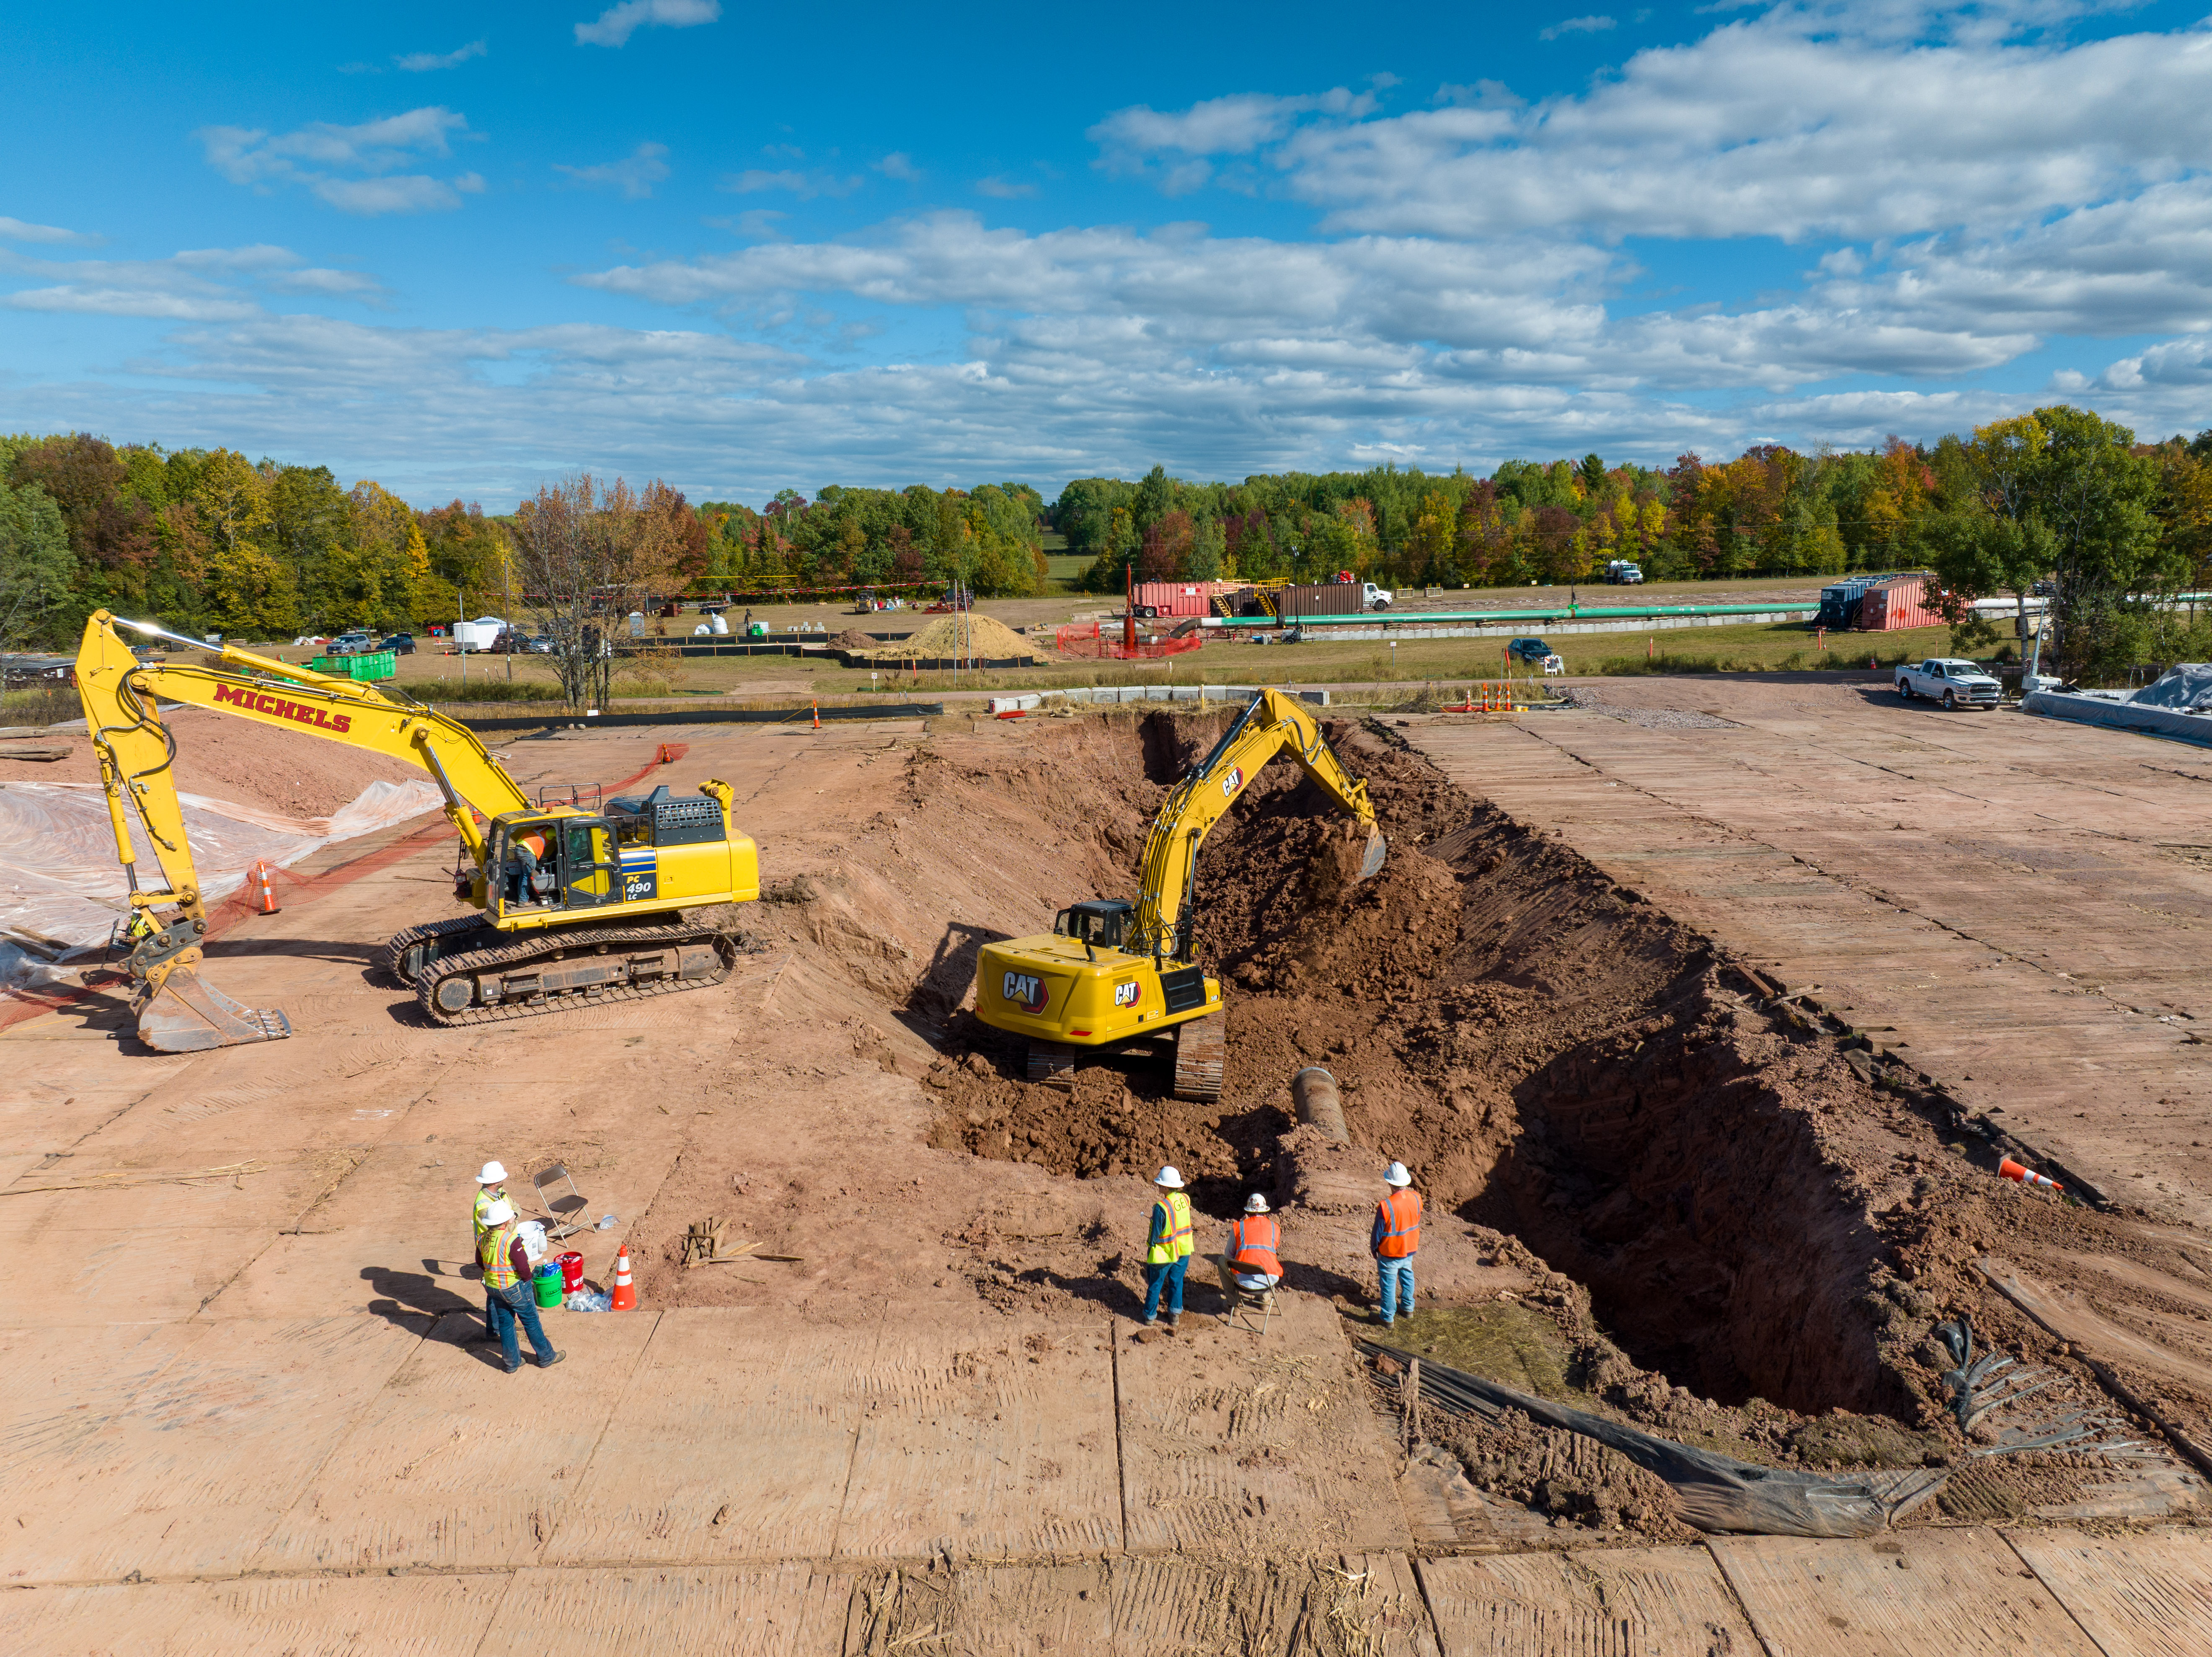
Enbridge crews continue to focus on environmental testing and remediation. Soils from the construction excavation are being tested, removed, and sent for proper disposal. Authorized parties and agencies have been permitted access to the site.
Community air monitoring has consistently shown safe air quality outside of the incident site. Monitoring wells continue to show no contamination, and soil and water monitoring remains ongoing.
The cause of the third-party line strike is under investigation. Enbridge crews, working with federal and state investigators, have removed the flatbed truck from the incident site.
Background
Tuesday, Aug. 25, a parked and unoccupied subcontractor flatbed truck delivering equipment rolled forward into an open excavation at a Line 5 valve project, striking the pipe and releasing natural gas liquids (NGLs), mainly propane and butane. NGLs are transported by pipeline as liquids, but when exposed to normal outdoor conditions, rapidly vaporize into gases and dissipate. No one was injured and no impacts to wildlife have been identified. Environmental monitoring began immediately at the site, expanded quickly throughout the surrounding community, and continues today.
Line 5 is operating safely through a temporary bypass. All work performed for construction of the bypass was done consistent with either conditions required in existing permits or our application for an amendment to the stormwater permit. Enbridge was in daily communications with the Wisconsin Department of Natural Resources (DNR), and DNR staff was on site periodically during construction. We worked closely with the federal regulator, the Pipeline and Hazardous Materials Safety Administration (PHMSA), to install a temporary bypass following their approved procedures.
Line 5 is critical infrastructure, supplying 10 refineries and propane production facilities that deliver energy to millions of people in the Midwest and Great Lakes regions.
Sept. 14, 2026 Line 5 bypass/incident update (posted at 11:03 a.m. CT)
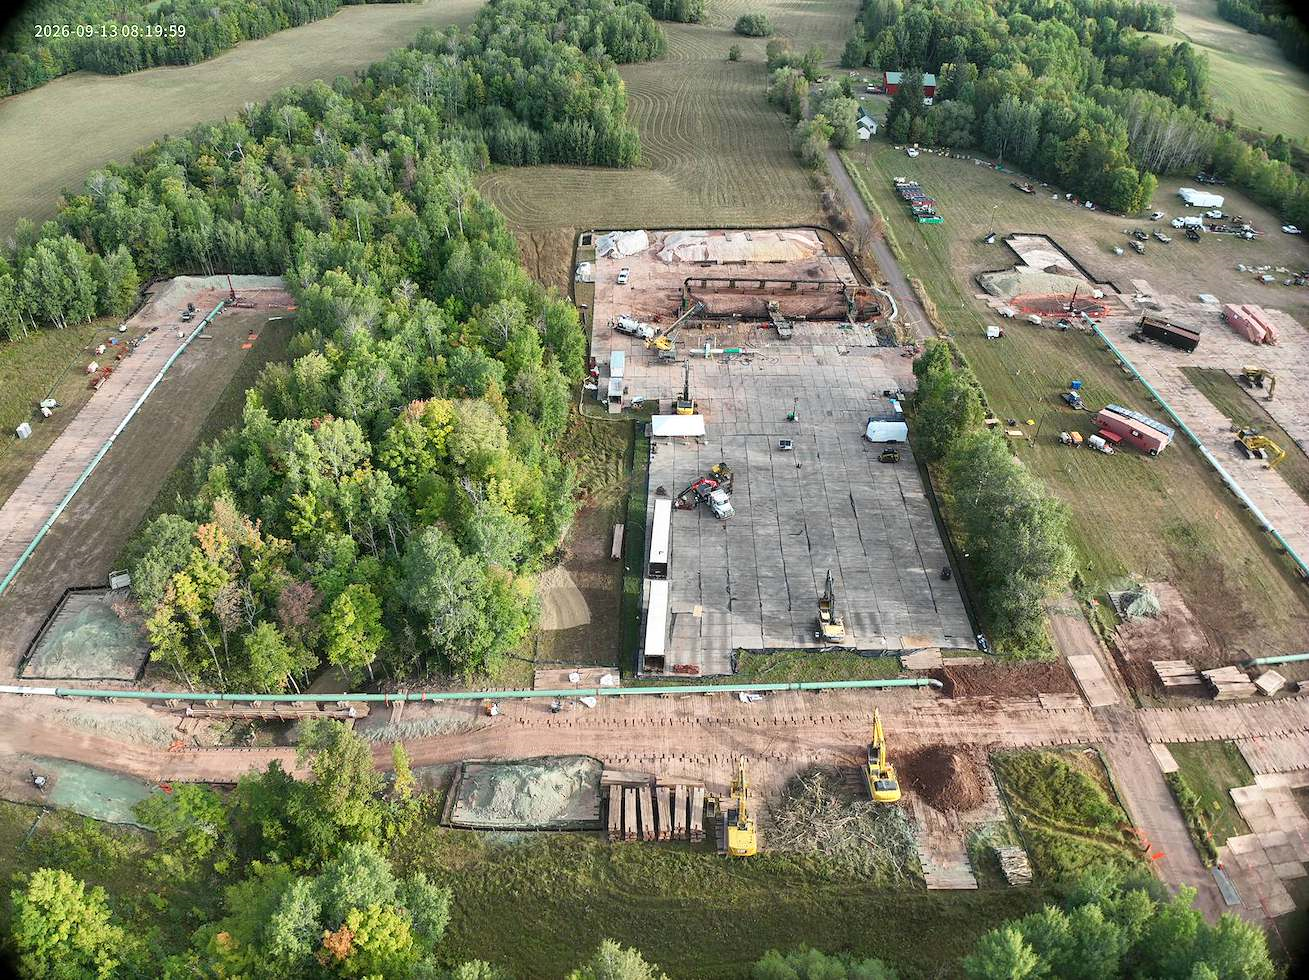
_Aerial view of bypass and remediation site captured Sept. 13 in Iron County, Wisconsin. Click here, or on the image above, to download this Sept. 13, 2026 image (automatic download of zipped folder).
_
Over the weekend Enbridge teams safely returned Line 5 to service through the use of a temporary bypass around the damaged section of pipeline near Saxon, WI. Work continues at the site focused on safe access, environmental testing and remediation.
Enbridge has worked closely with the federal regulator, the Pipeline and Hazardous Materials Safety Administration (PHMSA) and local officials to protect the health and safety of nearby residents, responders, and our Enbridge teams. We continue to work with the Wisconsin Department of Natural Resources on relevant permitting and separately on environmental conditions at the incident site.
Ongoing environmental monitoring at the site continues. Wildlife has not been impacted. Testing of surface water and from a nearby residential well continues to show no impacts. Water monitoring wells continue to show no contamination. Soil and water monitoring are in place, as are plans to test, remove and properly dispose of the soil in the trench.
The flatbed truck remains onsite and will be removed in conjunction with ongoing incident investigations. We continue to monitor air conditions directly around the impacted section of pipe to determine where crews can safely work.
Line 5 is critical infrastructure, securely supplying 10 refineries and propane production facilities that deliver energy to millions of people in the Midwest and Great Lakes regions.
Background
On Tuesday, Aug. 25, a parked and unoccupied subcontractor flatbed truck delivering equipment to the site rolled forward into an open excavation at a Line 5 valve project, striking the pipe and releasing natural gas liquids (NGLs), mainly propane and butane. NGLs are transported by pipeline as liquids, but when exposed to normal outdoor conditions, rapidly vaporize into gases.
No one was injured. As a precaution, a nearby home was evacuated. The affected section of pipe was immediately isolated, and Line 5 was shut down.
For everyone’s safety a no-fly zone remains over the site as ordered by the Iron County Sheriff.
Sept. 12, 2026 Line 5 bypass/incident update (posted at 4:51 p.m. CT)
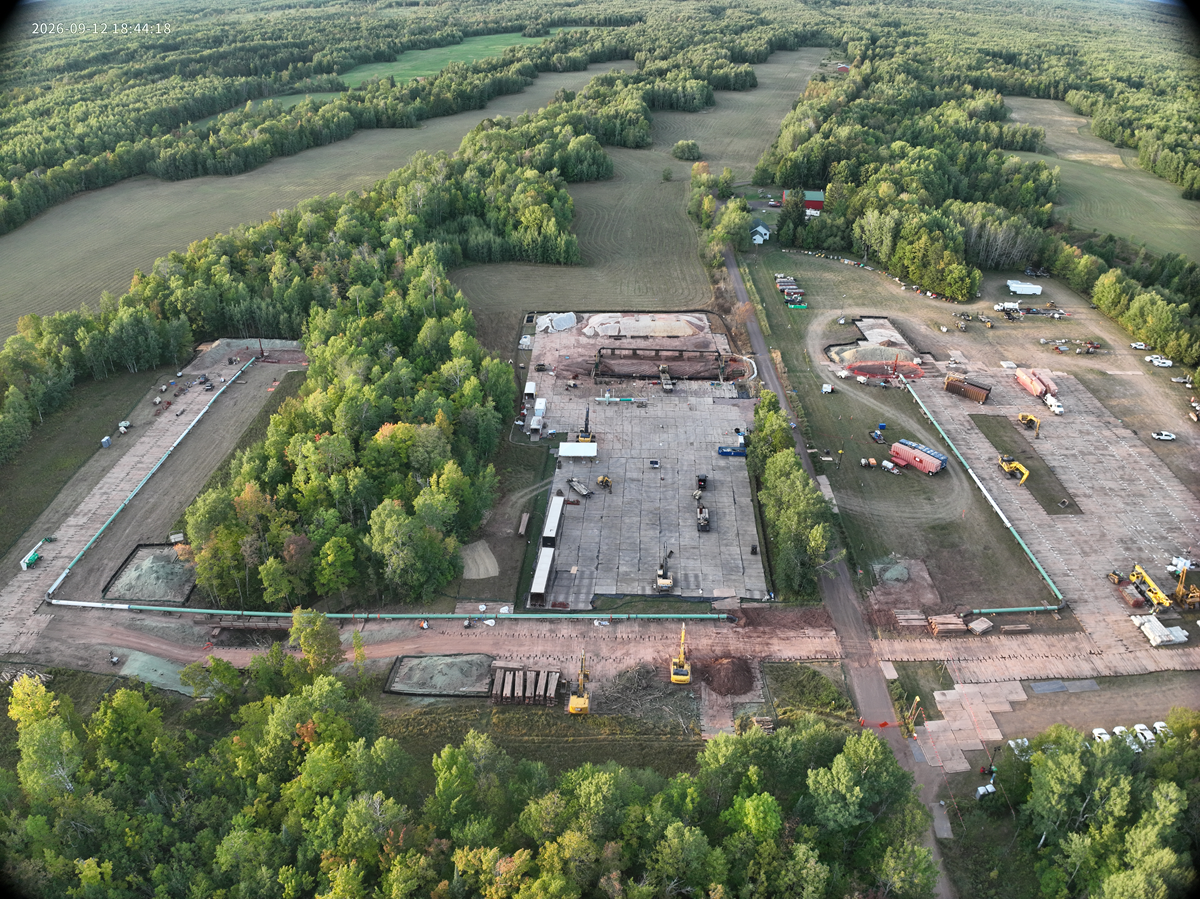
_Aerial view of bypass and remediation site captured Sept. 12 in Iron County, Wisconsin. Click here, or on the image above, to download this Sept. 12, 2026 image (automatic download of zipped folder).
_
Overnight, Enbridge crews successfully pressure tested the temporary bypass and currently are working through the highly regulated process of finalizing the return to service of Line 5. Around-the-clock work continues towards both priorities related to the incident—the safe control and remediation of the incident site and returning the line to service—following a plan approved by federal regulator, the Pipeline and Hazardous Materials Safety Administration (PHMSA).
Enbridge has worked closely with PHMSA and local officials to protect the health and safety of nearby residents, responders, and our Enbridge teams. We continue to work with the Wisconsin Department of Natural Resources on relevant permitting and separately on environmental conditions at the incident site.
Ongoing environmental monitoring at the site continues. Wildlife has not been impacted. Testing of surface water and from a nearby residential well continues to show no impacts. Water monitoring wells continue to show no contamination. Soil and water monitoring are in place, as are plans to test, remove and properly dispose of the soil in the trench.
The flatbed truck remains onsite and will be removed in conjunction with ongoing incident investigations. We continue to monitor air conditions directly around the impacted section of pipe to determine when crews can safely work there.
Line 5 is critical infrastructure, supplying 10 refineries and propane production facilities that deliver energy to millions of people in the Midwest and Great Lakes regions.
Background
On Tuesday, Aug. 25, a parked and unoccupied subcontractor flatbed truck delivering equipment to the site rolled forward into an open excavation at a Line 5 valve project, striking the pipe and releasing natural gas liquids (NGLs), mainly propane and butane. NGLs are transported by pipeline as liquids, but when exposed to normal outdoor conditions, rapidly vaporize into gases.
No one was injured. As a precaution, a nearby rural home was evacuated. The affected section of pipe was immediately isolated, and Line 5 was shut down.
For everyone’s safety a no-fly zone remains over the site as ordered by the Iron County Sheriff.
Sept. 11, 2026 Line 5 bypass/incident update (posted at 5:48 p.m. CT)
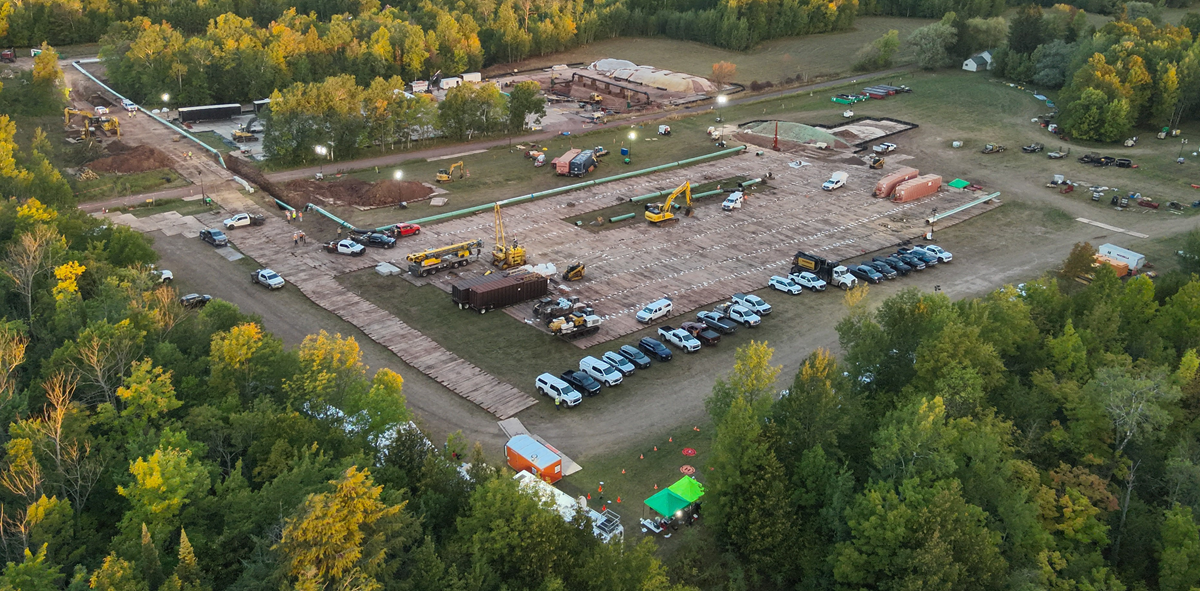
_Workers continue to make progress on the temporary bypass and work remains on schedule to bring Line 5 back into service by Sept. 12. Click here, or on the image above, to download this Sept. 11, 2026 image of Line 5 bypass construction (automatic download of zipped folder).
_
Today, Enbridge crews finished mechanical construction of the temporary bypass which will allow Line 5 to return to service. Around-the-clock work continues towards both priorities related to the incident—the safe control and remediation of the incident site, and completing the temporary bypass. The bypass pipe will be pressure-tested today at above normal operating conditions before line fill activities are allowed to begin, following a plan approved by the federal regulator, the Pipeline and Hazardous Materials Safety Administration (PHMSA).
Enbridge has worked closely with PHMSA and local officials to protect the health and safety of nearby residents, responders, and our Enbridge teams. We continue to work with the Wisconsin Department of Natural Resources on relevant permitting and separately on environmental conditions at the incident site.
Community air monitoring is ongoing and continues to show safe air quality outside of the evacuation zone and where crews are currently working. We continue to monitor air conditions directly around the impacted section of pipe to determine when crews can safely work there.
Wildlife has not been impacted. Samples of surface water and from a nearby residential well have been tested and show no impacts. Water monitoring wells have been installed around the site and continue to show no contamination. Soil and water monitoring is in place, as are plans to test, remove, and properly dispose of the soil in the trench.
Line 5 is critical infrastructure, supplying 10 refineries and propane production facilities that deliver energy to millions of people in the Midwest and Great Lakes regions.
Background
On Tuesday, Aug. 25, a parked and unoccupied subcontractor flatbed truck delivering equipment to the site rolled forward into an open excavation at a Line 5 valve project, striking the pipe and releasing natural gas liquids (NGLs), mainly propane and butane. NGLs are transported by pipeline as liquids, but when exposed to normal outdoor conditions, rapidly vaporize into gases.
No one was injured. As a precaution, a nearby rural home was evacuated. The affected section of pipe was immediately isolated, and Line 5 was shut down.
The flatbed truck remains onsite, and it will be removed in conjunction with ongoing incident investigations.
For everyone’s safety a no-fly zone remains over the site as ordered by the Iron County Sheriff.
Sept. 10, 2026 Line 5 bypass/incident update (posted at 6:02 p.m. CT)
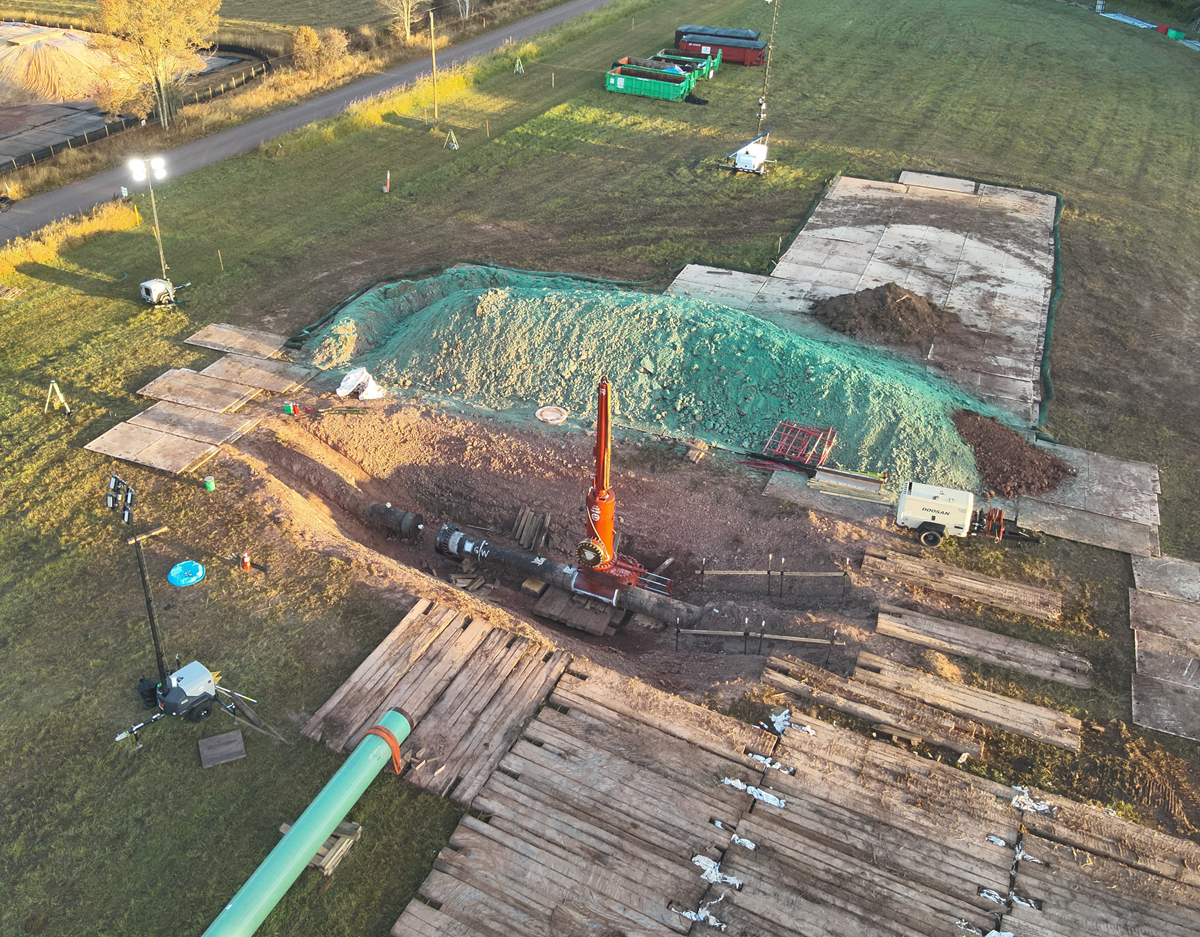
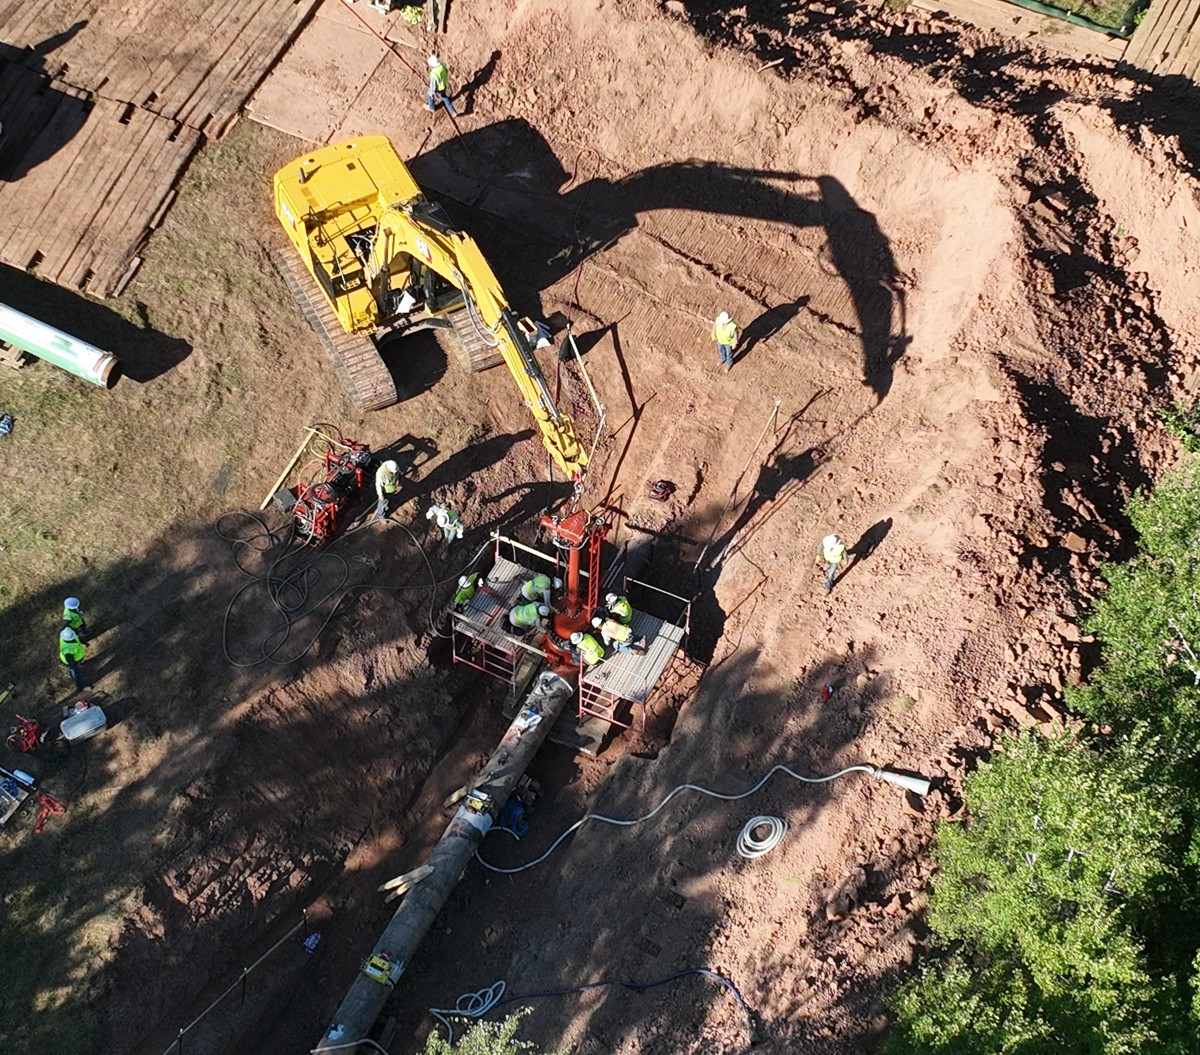
_Workers continue to make progress on the temporary bypass and work remains on schedule to bring Line 5 back into service by Sept. 12. Click here, or on the image above, to download these two Sept. 10, 2026 images of Line 5 bypass construction (automatic download of zipped folder).
_
_Workers continue to make progress on the temporary bypass and work remains on schedule to bring Line 5 back into service by Sept. 12. Click here, or on the image above, to download these two Sept. 10, 2026 images of Line 5 bypass construction (automatic download of zipped folder).
_
Enbridge continues working towards both priorities related to the third-party line strike near Saxon, Wisconsin—the safe control and remediation of the incident site and completing a temporary bypass to allow the pipeline to return to service, which will help resolve energy supply disruptions. Around-the-clock work on both priorities is being done in parallel. Line 5 is critical infrastructure delivering energy to millions of people in the Midwest and Great Lakes regions.
We continue to work with the Wisconsin DNR on relevant permitting and separately on environmental conditions at the incident site.
Community air monitoring continues to show safe air quality outside of the evacuation zone and where crews are working around the clock at the site of a third-party line strike in northern Wisconsin.
Wildlife has not been impacted. Samples of surface water and from a nearby residential well have been tested and show no impacts. Water monitoring wells have been installed around the site and continue to show no contamination. Soil and water monitoring plans are in place, as are plans to test, remove, and properly dispose of the soil in the trench.
The flatbed truck remains onsite, and its removal will happen in conjunction with ongoing incident investigations.
For everyone’s safety a no-fly zone remains over the site as ordered by the Iron County Sheriff.
Background
On Tuesday, Aug. 25, a parked and unoccupied subcontractor flatbed truck delivering equipment to the site rolled forward into an open excavation at a Line 5 valve project, striking the pipe and releasing natural gas liquids (NGLs), mainly propane and butane. NGLs are transported by pipeline as liquids, but when exposed to normal outdoor conditions, rapidly vaporize into gases.
No one was injured. As a precaution, a nearby rural home was evacuated. The affected section of pipe was immediately isolated, and Line 5 remains shut down.
Sept. 9, 2026 Line 5 bypass/incident update (posted at 4:30 p.m. CT)
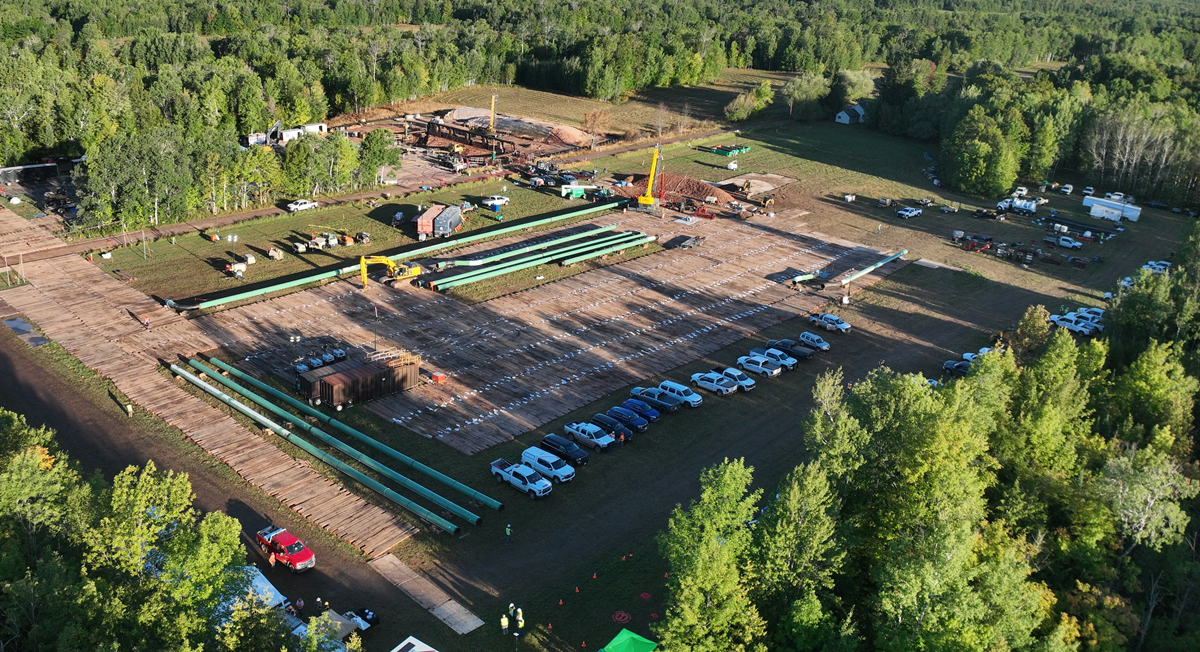
_Workers continue to make progress on the temporary bypass and work remains on schedule to bring Line 5 back into service by Sept. 12. Click here, or on the image above, to download these two Sept. 9, 2026 images of Line 5 bypass construction (automatic download of zipped folder).
_
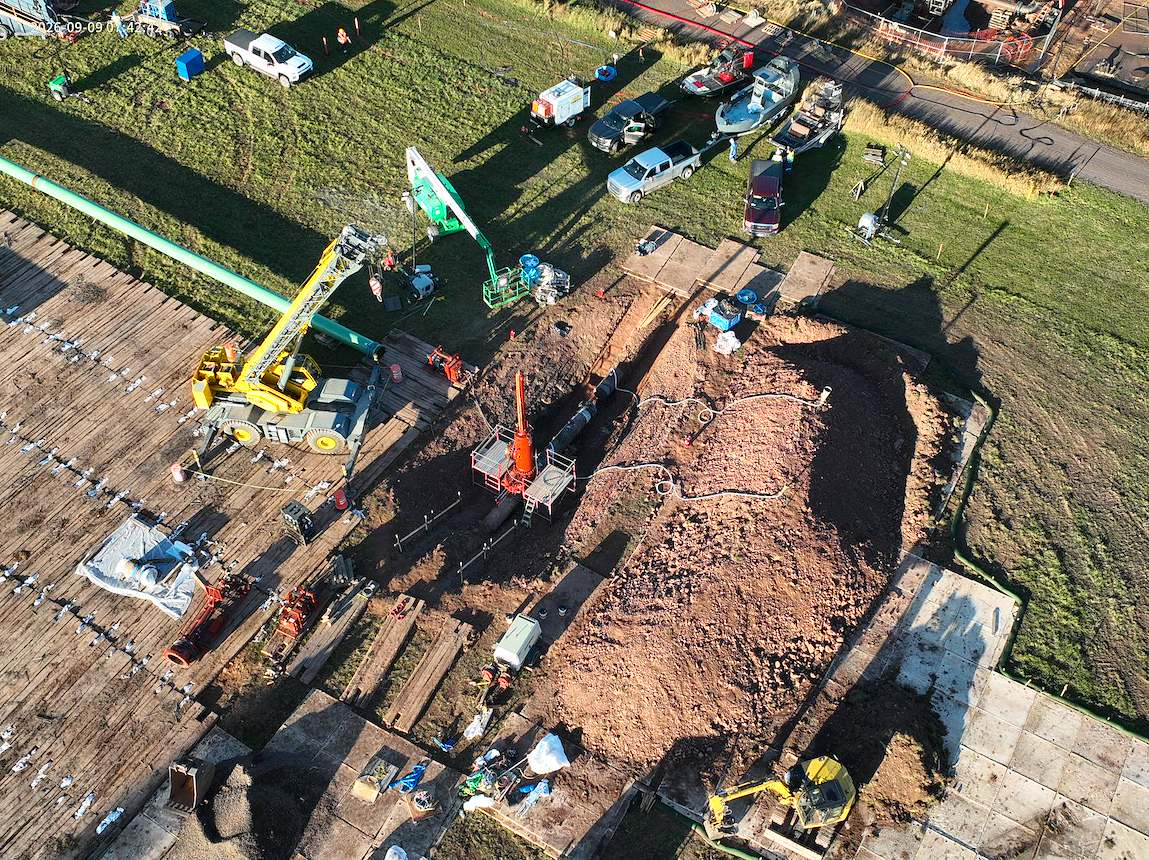
_Workers continue to make progress on the temporary bypass and work remains on schedule to bring Line 5 back into service by Sept. 12. Click here, or on the image above, to download these two Sept. 9, 2026 images of Line 5 bypass construction (automatic download of zipped folder).
_
Enbridge crews are working around the clock at the site of a third-party line strike in northern Wisconsin and have made good progress towards gaining full access to the site and restoring service to the pipeline. Crews are on track to restore service to Line 5 by Sept. 12.
Community air monitoring continues to show safe air quality outside of the evacuation zone and where crews are working. Samples of surface water and from a nearby residential well have been tested and show no impacts. Water monitoring wells have been installed around the site and continue to show no contamination. Soil and water monitoring plans are in place, as are plans to test, remove, and properly dispose of the soil in the trench. The flatbed truck remains onsite, and its removal will happen in conjunction with ongoing incident investigations.
For everyone’s safety a no-fly zone remains over the site as ordered by the Iron County Sheriff.
Background
On Tuesday, Aug. 25, a parked and unoccupied subcontractor flatbed truck delivering equipment to the site rolled forward into an open excavation at a Line 5 valve project, striking the pipe and releasing natural gas liquids (NGLs), mainly propane and butane. NGLs are transported by pipeline as liquids, but when exposed to normal outdoor conditions, rapidly vaporize into gases.
No one was injured. As a precaution, a nearby rural home was evacuated. The affected section of pipe was immediately isolated, and Line 5 remains shut down.
Sept. 8, 2026 Line 5 bypass/incident update (posted at 4:38 p.m. CT)
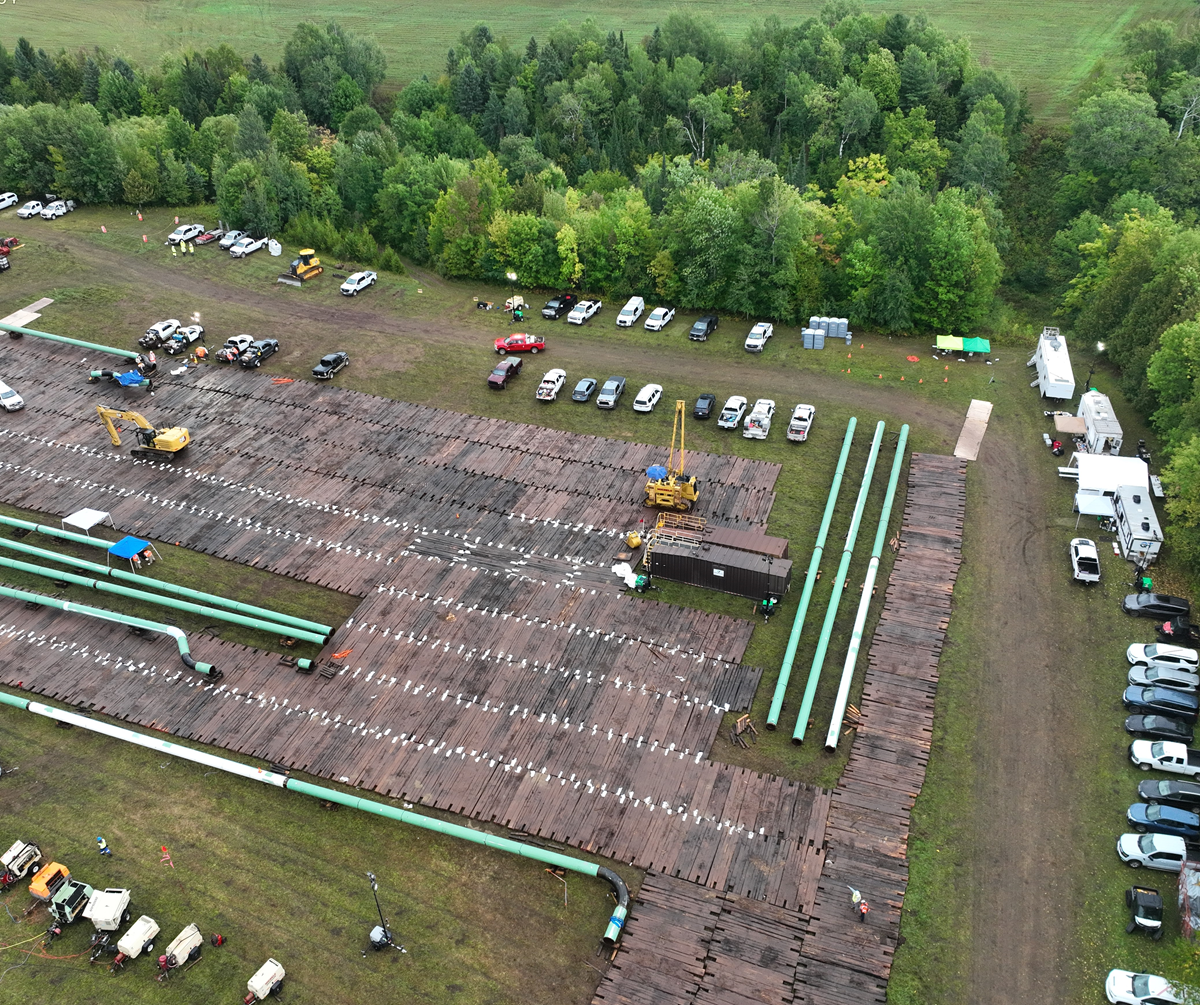
_Temporary bypass work continues around the clock near the Line 5 release site in Iron County, Wisconsin. Click here, or on the image above, to download these two Sept. 8, 2026 images of Line 5 bypass construction (automatic download of zipped folder).
_
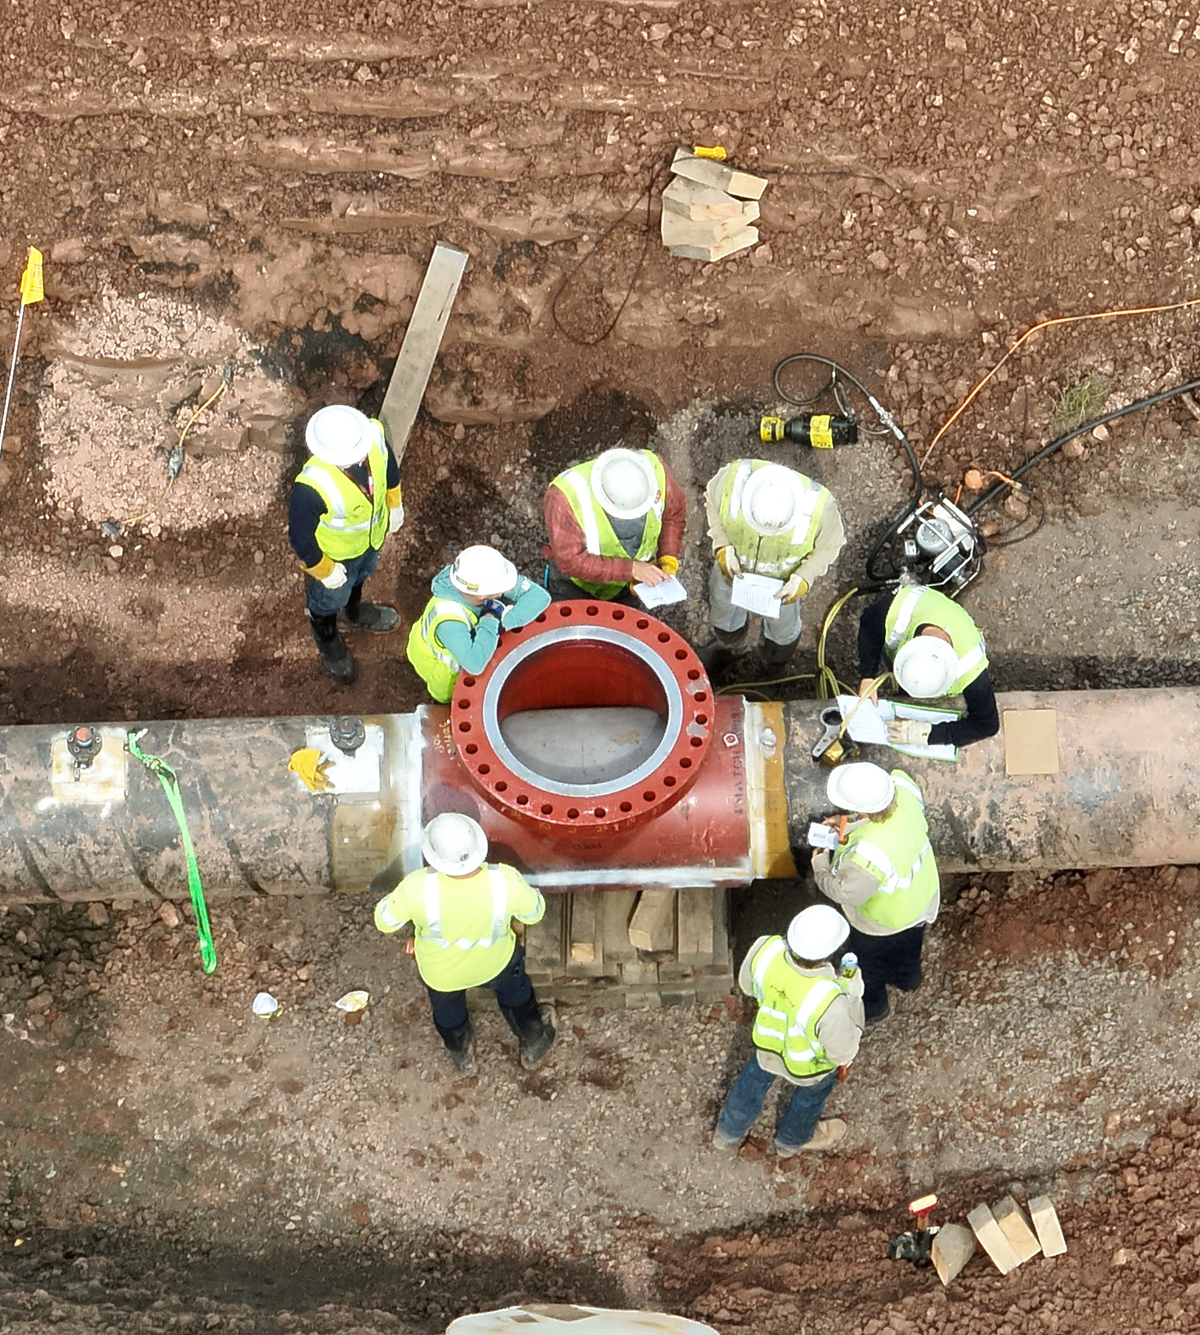
_Temporary bypass work continues around the clock near the Line 5 release site in Iron County, Wisconsin. Click here, or on the image above, to download these two Sept. 8, 2026 images of Line 5 bypass construction (automatic download of zipped folder).
_
Enbridge personnel and emergency response crews continue working around the clock on parallel goals to gain full access to the site and to restore service to the pipeline.
Community air monitoring continues to show safe air quality outside of the evacuation zone and where crews are working. Samples from surface water and a nearby residential well have been tested and show no impacts. Water monitoring wells have been installed around the site and testing will continue. Soil and water monitoring plans are in place, as are plans to test, remove, and properly dispose of the soil in the trench. The flatbed truck remains onsite, and its removal will happen in conjunction with ongoing incident investigations.
Enbridge crews are also working 24/7 on a temporary bypass around the release site with the goal of restoring service by Sept. 12.
For everyone’s safety a no-fly zone remains over the site as ordered by the Iron County Sheriff.
Background
On Tuesday, Aug. 25, a parked and unoccupied subcontractor flatbed truck delivering equipment to the site rolled forward into an open excavation at a Line 5 valve project, striking the pipe and releasing natural gas liquids (NGLs), mainly propane and butane. NGLs are transported by pipeline as liquids, but when exposed to normal outdoor conditions, rapidly vaporize into gases.
No one was injured. As a precaution, a nearby rural home was evacuated. The affected section of pipe was immediately isolated, and Line 5 remains shut down.
Sept. 7, 2026 Line 5 bypass/incident update (posted at 3:26 p.m. CT)
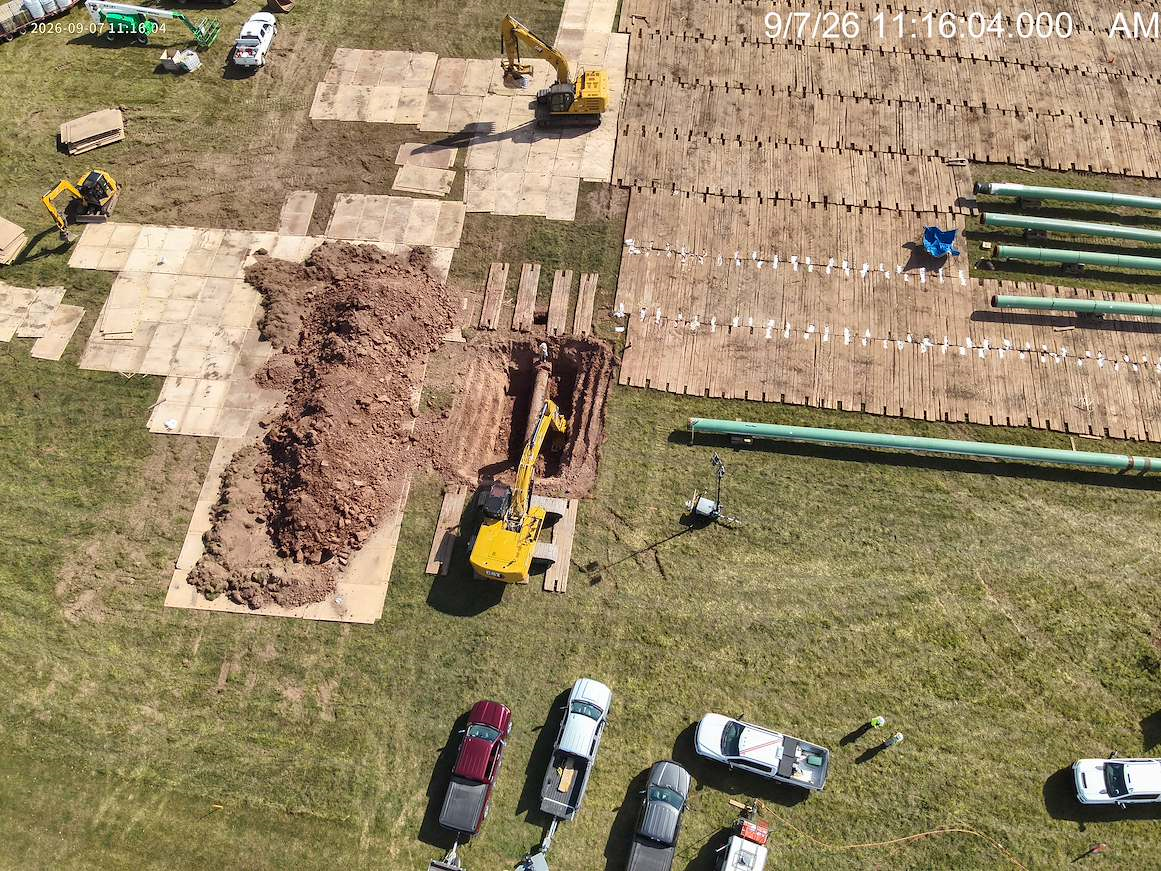
_Temporary bypass work continues around the clock near the Line 5 release site in Iron County, Wisconsin. Click here, or on the image above, to download these three Sept. 7, 2026 images of Line 5 bypass construction (automatic download of zipped folder).
_
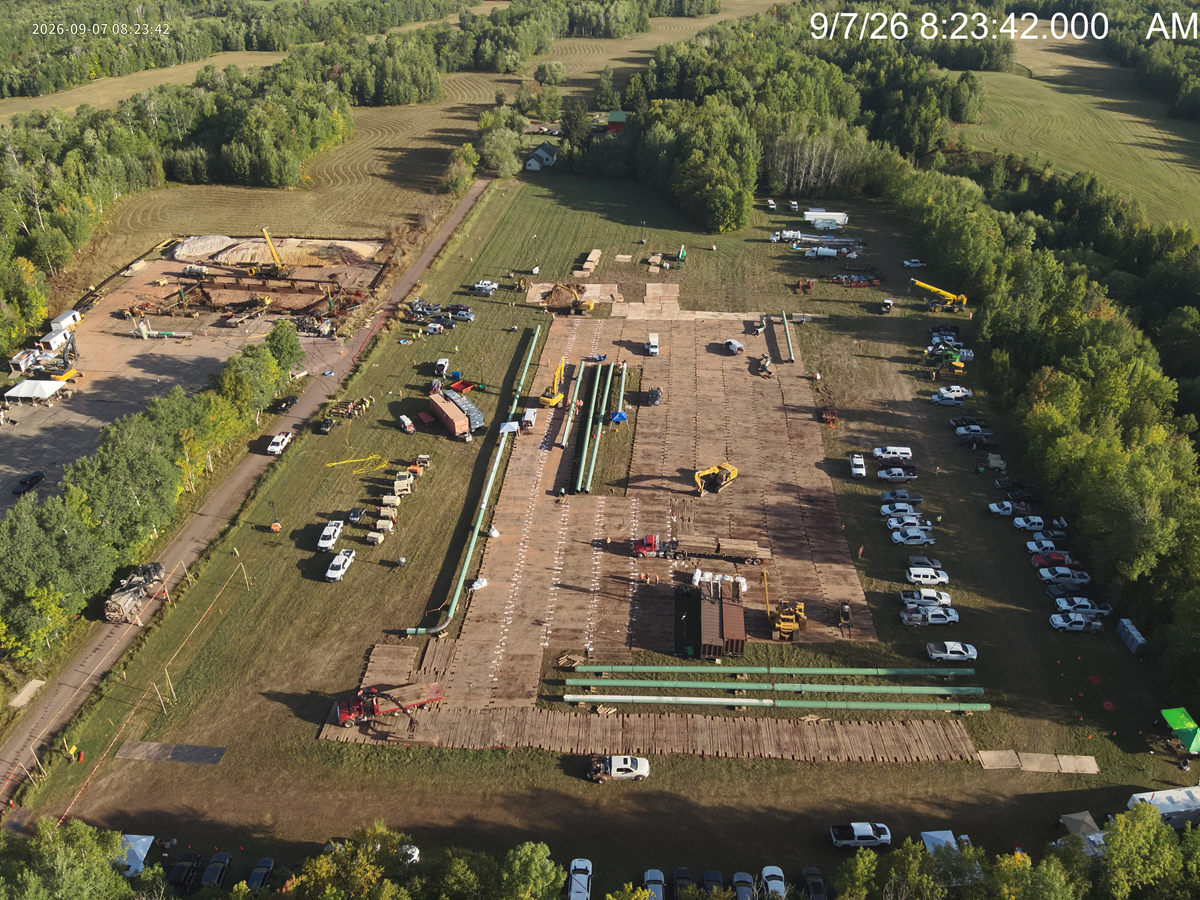
_Temporary bypass work continues around the clock near the Line 5 release site in Iron County, Wisconsin. Click here, or on the image above, to download these three Sept. 7, 2026 images of Line 5 bypass construction (automatic download of zipped folder).
_
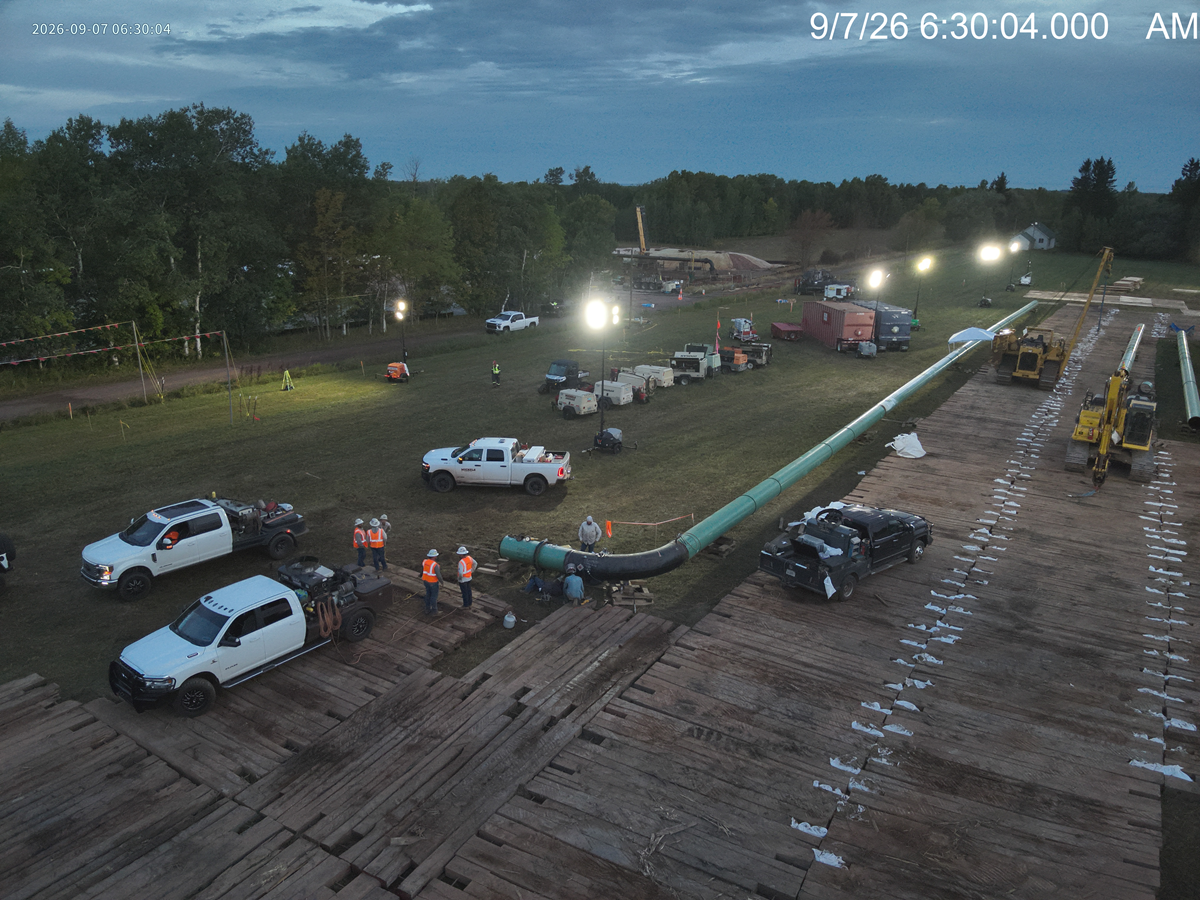
_Temporary bypass work continues around the clock near the Line 5 release site in Iron County, Wisconsin. Click here, or on the image above, to download these three Sept. 7, 2026 images of Line 5 bypass construction (automatic download of zipped folder).
_
Enbridge personnel and emergency response crews continue working around the clock at the site of a third-party line strike on Line 5 in northern Wisconsin on parallel goals to gain full access to the site and to restore service to the pipeline.
Today crews continued removing natural gas liquids from the construction trench using compressed air which encourages vaporization and dissipation of the product. Community air monitoring continues to show safe air quality outside of the evacuation zone and where crews are working.
Soil and water monitoring plans are in place, as are plans to test, remove, and properly dispose of the soil in the trench. The flatbed truck remains onsite, and its removal will happen in conjunction with ongoing incident investigations.
Enbridge crews are also working 24/7 on a temporary bypass, approximately 1,500 feet long, around the release site with the goal of restoring service by Sept. 12.
For everyone’s safety a no-fly zone remains over the site as ordered by the Iron County Sheriff.
Background
On Tuesday, Aug. 25, a parked and unoccupied subcontractor flatbed truck delivering equipment to the site rolled forward into an open excavation at a Line 5 valve project, striking the pipe and releasing natural gas liquids (NGLs), mainly propane and butane. NGLs are transported by pipeline as liquids, but when exposed to normal outdoor conditions, rapidly vaporize into gases.
No one was injured. As a precaution, a nearby rural home was evacuated. The affected section of pipe was immediately isolated, and Line 5 remains shut down.
Sept. 6, 2026 Line 5 bypass/incident update (posted at 1:43 p.m. CT)
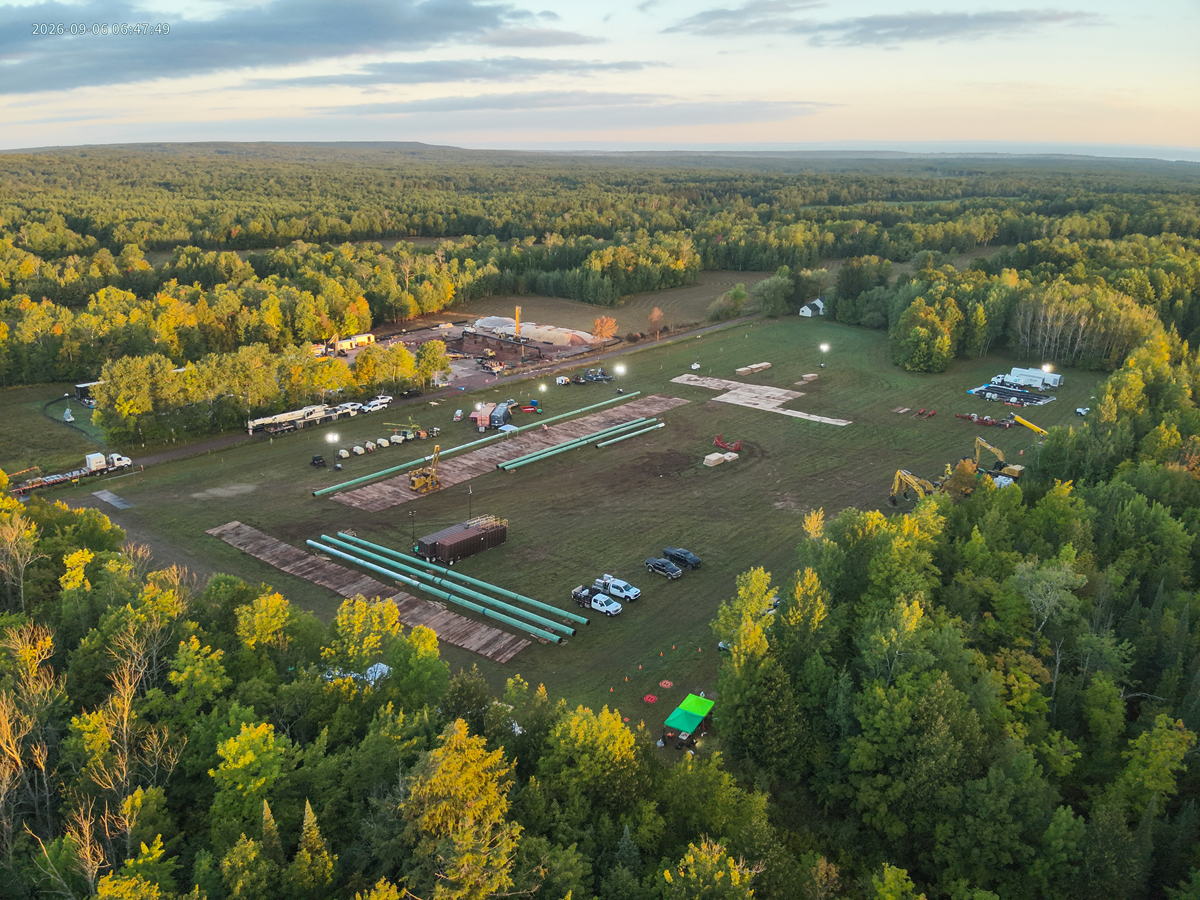
_Crews have begun work on a temporary bypass around the Line 5 release site in Iron County, Wisconsin. Click here, or on the image above, to download these three Sept. 6, 2026 images of the Line 5 bypass staging site (automatic download of zipped folder).
_
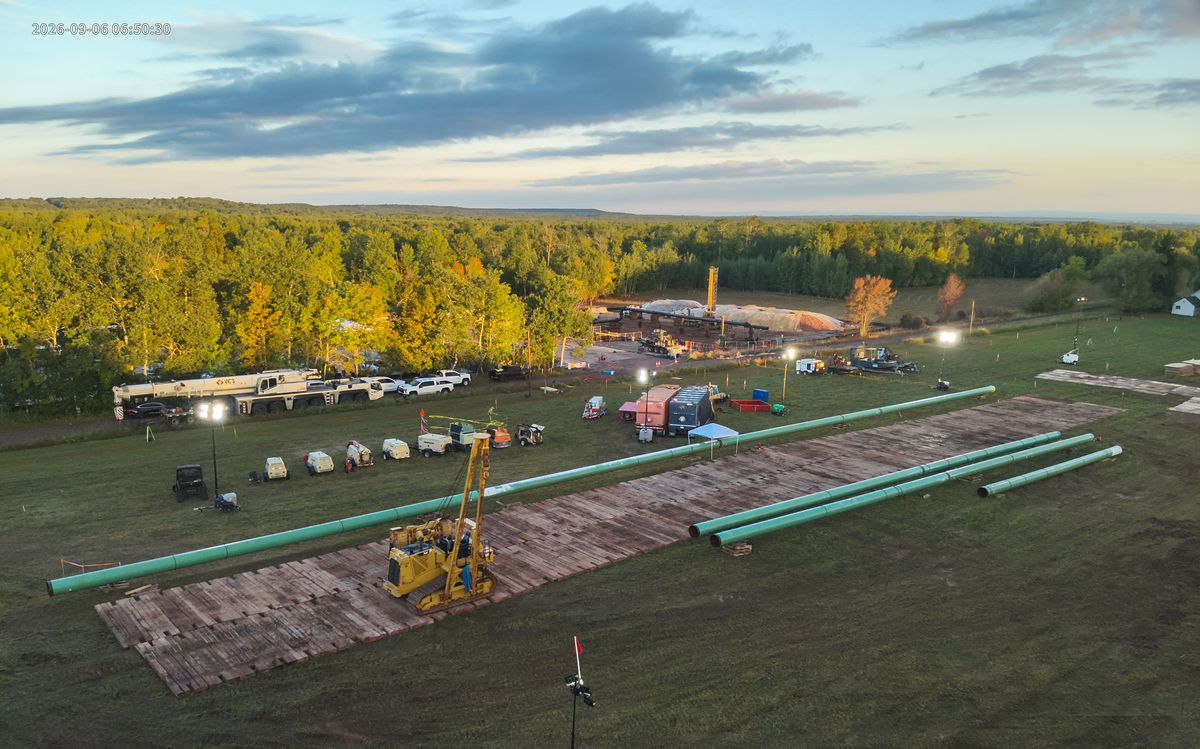
_Crews have begun work on a temporary bypass around the Line 5 release site in Iron County, Wisconsin. Click here, or on the image above, to download these three Sept. 6, 2026 images of the Line 5 bypass staging site (automatic download of zipped folder).
_
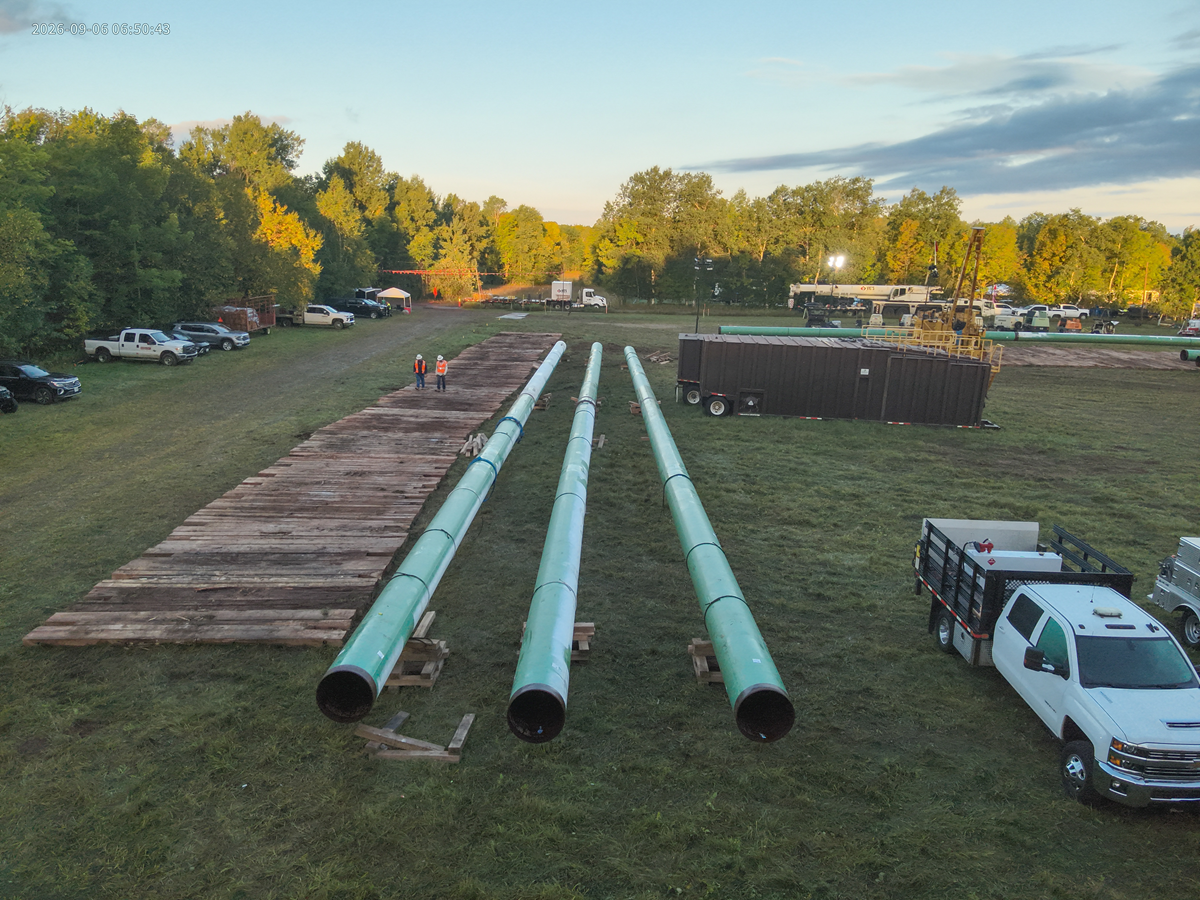
_Crews have begun work on a temporary bypass around the Line 5 release site in Iron County, Wisconsin. Click here, or on the image above, to download these three Sept. 6, 2026 images of the Line 5 bypass staging site (automatic download of zipped folder).
_
As previously communicated, the Line 5 pipeline was taken out of service and safely isolated on Aug. 25 following a third-party line strike and release of natural gas liquids (NGLs). Line 5 remains safely shut down at this time, with Enbridge personnel and emergency response crews continuing to work on site.
Enbridge continues to progress with two key priorities in parallel—to safely secure access to the incident site and to return service to the pipeline. Enbridge crews have been working 24/7 to advance these priorities, while carefully managing potential risks associated with an NGL release, the safety of response crews and protection of the environment. Enbridge continues to work alongside regulatory bodies to advance response priorities and appreciates the time and attention of regulators in addressing the complexity of the response and ensuring the safe and timely return to service of Line 5.
Site access
Enbridge crews continue to safely remove the remaining natural gas liquids from the trench through the introduction of compressed air and vaporization. The soil in the trench will be tested once it is safe to access the site and properly disposed of as required. The flatbed truck remains onsite, and its removal will be addressed in relationship to the ongoing investigations of the incident.
Restoration of pipeline service
Enbridge is constructing a temporary bypass, approximately 1,500 feet long, around the release site to restore service. The bypass will isolate the incident site from Line 5 operations and will allow work to continue to address the conditions at the site while also enabling Enbridge to safely deliver product around the impacted site. Based on the updated timeline for construction of the bypass, Enbridge anticipates a restart and return to service of Line 5 on Sept. 12.
Background
On Tuesday, Aug. 25, a parked and unoccupied subcontractor flatbed truck delivering equipment to the site rolled forward into an open excavation at a Line 5 valve project, striking the pipe and releasing natural gas liquids (NGLs), mainly propane and butane. NGLs are transported by pipeline as liquids, but when exposed to normal outdoor conditions, rapidly vaporize into gases.
No one was injured. As a precaution, a nearby rural home was evacuated. The affected section of pipe was immediately isolated, and Line 5 remains shut down.
Sept. 5, 2026 Line 5 incident update (posted at 6:10 p.m. CT)
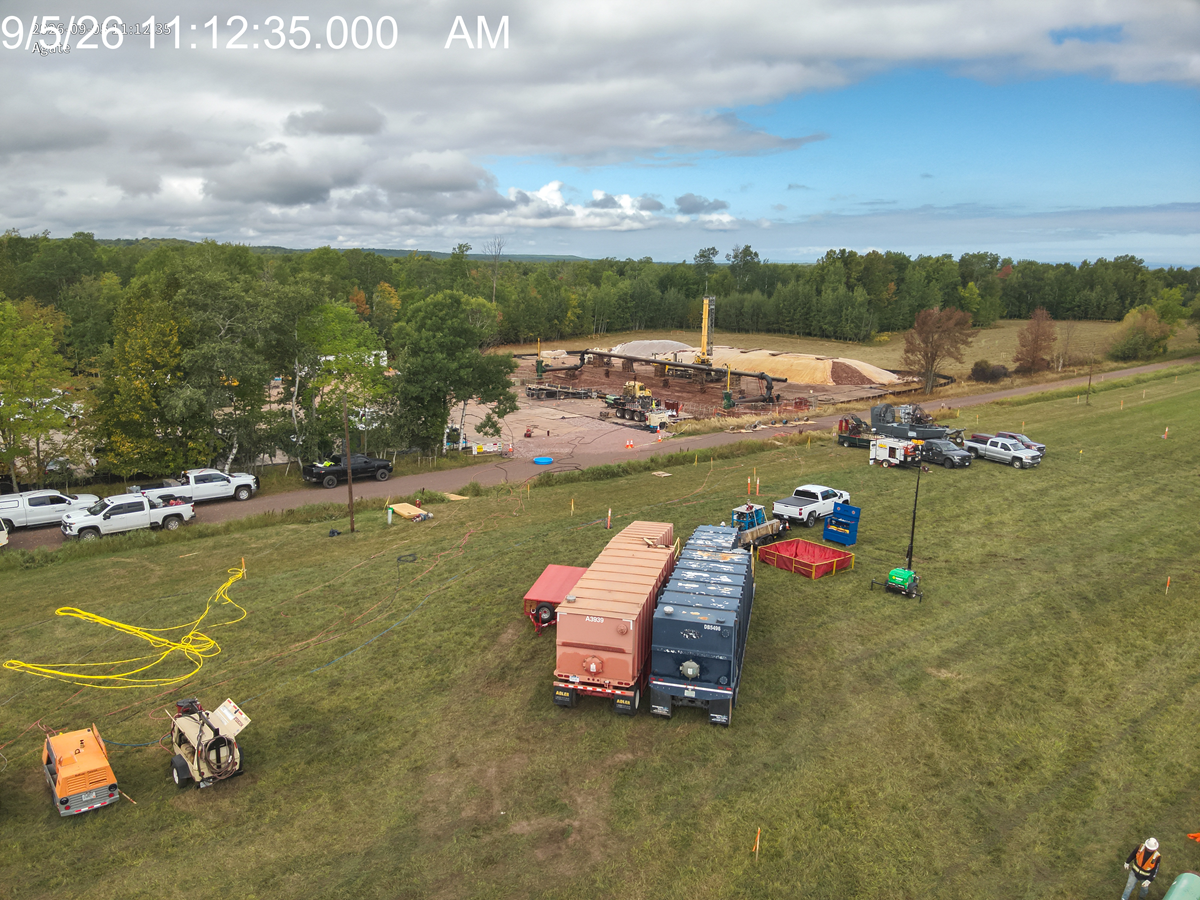
_Enbridge crews continue to inject compressed air into the remaining liquids in the excavated area at the site of a third-party line strike on Line 5 in northern Wisconsin. The compressed air helps the product evaporate and dissipate. The liquid remaining in the excavated area has now been reduced to approximately 140 barrels. Click here, or on the image above, to download these two Sept. 5, 2026 images of the Line 5 valve site in Iron County, Wisconsin (automatic download of zipped folder).
_
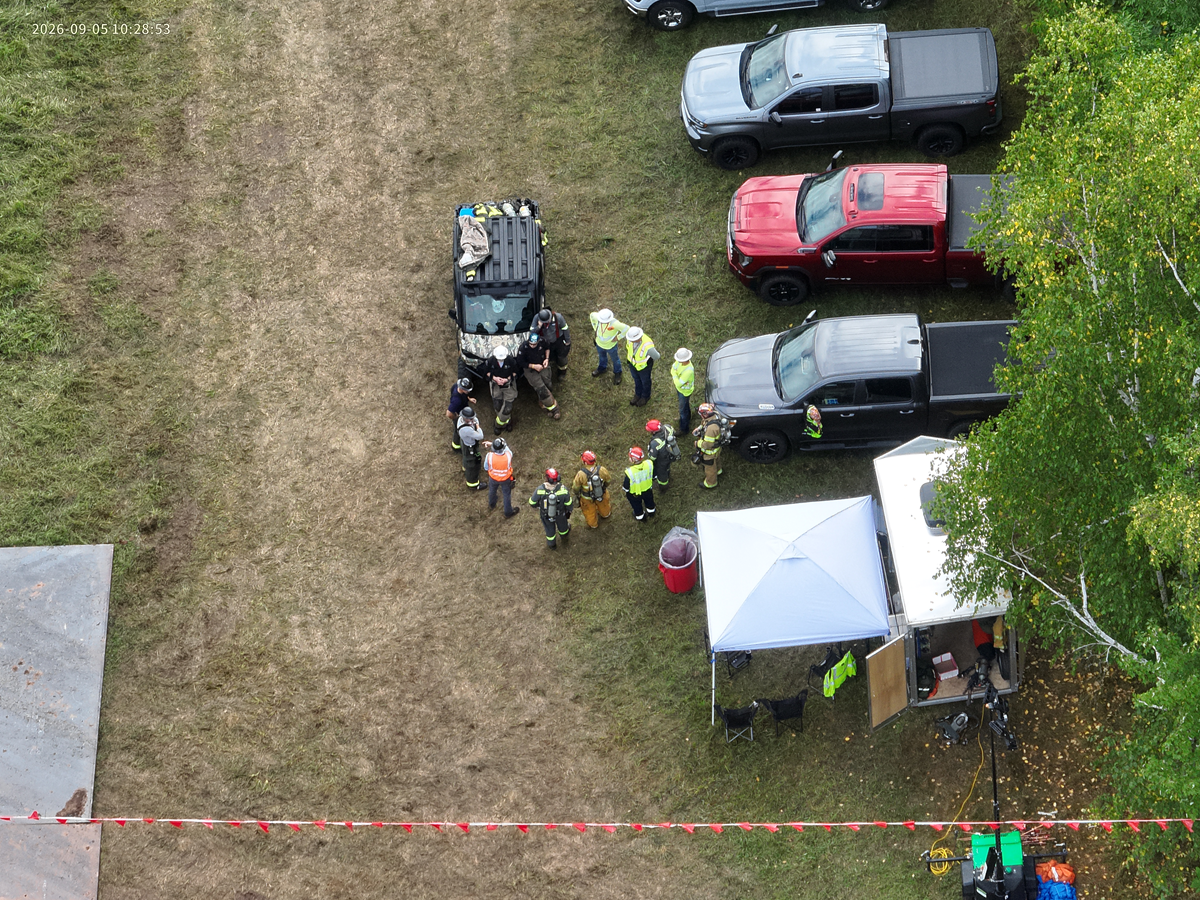
_Workers gather for a safety meeting prior to starting a shift at the incident site. Click here, or on the image above, to download these two Sept. 5, 2026 images of the Line 5 valve site in Iron County, Wisconsin (automatic download of zipped folder).
_
Sept. 3, 2026 Line 5 incident update (posted at 5:30 p.m. CT)
Samples from surface water and a nearby residential well have been tested and show no impacts from the natural gas liquids released at the site of a third-party line strike on Line 5 in northern Wisconsin. Water monitoring wells have been installed around the site and testing will continue.
Extensive air monitoring continues to show safe community air quality outside of the evacuation zone.
Today Enbridge crews were again able to access the incident site in a controlled manner to inject compressed air into liquids remaining in the excavation. The compressed air encourages the product to evaporate and dissipate. Overnight Enbridge crews continued using nitrogen and controlled flaring to evacuate the remaining product from the impacted and isolated segment of Line 5.
Enbridge continues to work with its federal regulator the Pipeline and Hazardous Materials Safety Administration (PHMSA) as our response continues and provide regular updates to the Wisconsin Department of Natural Resources.
Background on incident
On Tuesday, Aug. 25, a parked and unoccupied subcontractor flatbed truck delivering equipment to the site rolled forward into an open excavation at a Line 5 valve project, striking the pipe and releasing natural gas liquids (NGLs), mainly propane and butane. NGLs are transported by pipeline as liquids, but when exposed to normal outdoor conditions, rapidly vaporize into gases.
No one was injured. The affected section of pipe was immediately isolated, and Line 5 remains shut down.
Enbridge restoration plans are progressing towards the goal of safely restoring service to the pipeline between September 6-8.
Updates will be provided as additional information becomes available.
Sept. 2, 2026 Line 5 incident update (posted at 6:31 p.m. CT)
Enbridge crews today began introducing compressed air to the product remaining in the valve excavation at the site of a third-party line strike in northern Wisconsin. The injection of air will help safely evaporate and disperse the remaining product.
Extensive air monitoring continues to show safe air quality outside of the evacuation zone and where crews are working. However, the evacuation zone remains around the active incident site, and the “no-fly” zone continues over the site issued by the Iron County Sheriff.
Water monitoring wells have been installed, and water sampling is ongoing with results expected soon.
Enbridge continues to work with the federal regulator, the Pipeline and Hazardous Materials Safety Administration (PHMSA), as our response continues, and provide regular updates to the Wisconsin Department of Natural Resources.
Enbridge restoration plans are progressing towards the goal of safely restoring service to the pipeline between Sept. 6-8.
Background on incident
On Tuesday, Aug. 25, a parked and unoccupied subcontractor flatbed truck delivering equipment to the site rolled forward into an open excavation at a Line 5 valve project, striking the pipe and releasing natural gas liquids (NGLs), mainly propane and butane. NGLs are transported by pipeline as liquids, but when exposed to normal outdoor conditions, rapidly vaporize into gases.
No one was injured. As a precaution, a nearby rural home was evacuated. The affected section of pipe was immediately isolated, and Line 5 remains shut down.
Updates will be provided as additional information becomes available.
Sept. 1, 2026 Line 5 incident update (posted at 4:45 p.m. CT)
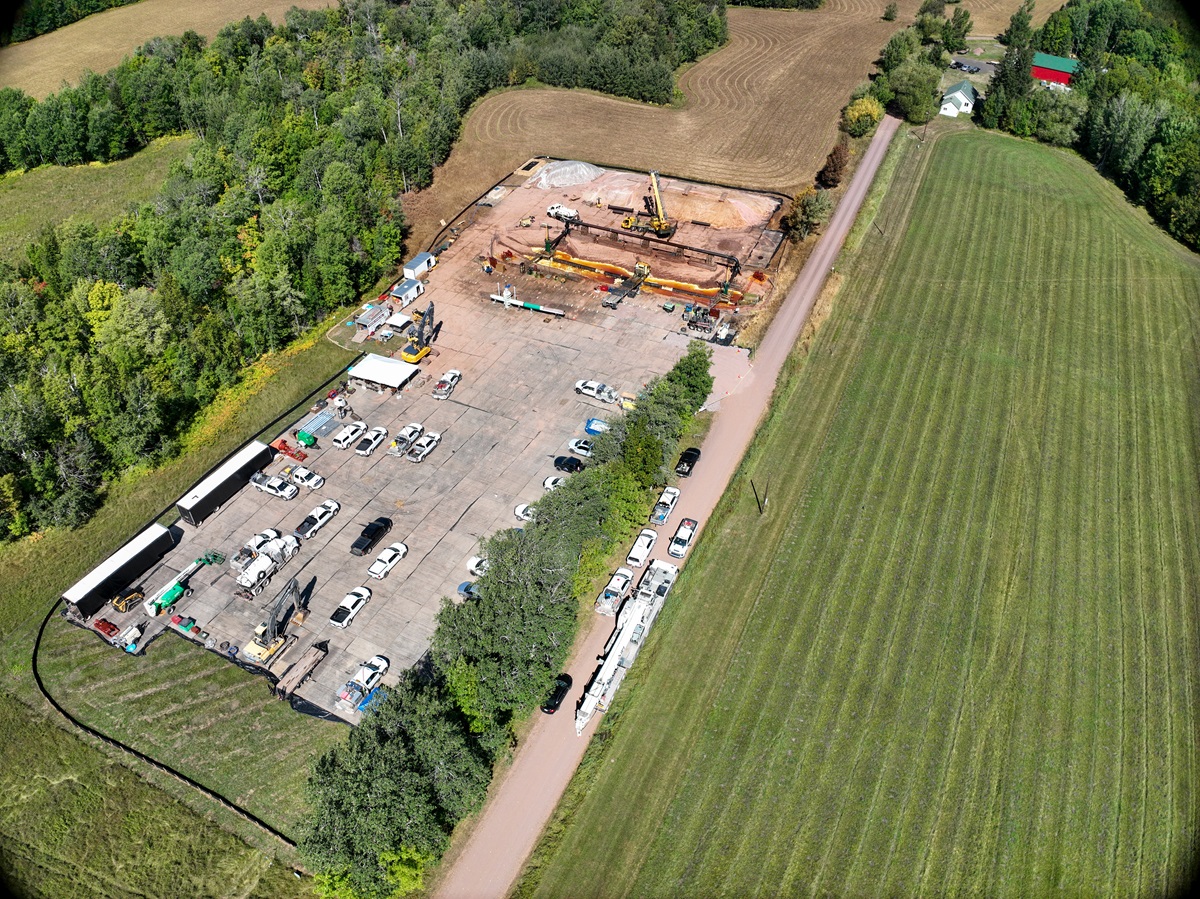
_Aerial view of incident site captured Tuesday, Sept. 1. Click here, or on the image above, to download this Sept. 1 image of the Line 5 valve site in Iron County, Wisconsin (automatic download of zipped folder).
_
Enbridge crews continue to use a combination of nitrogen and trailer-mounted flare stacks to safely evacuate and burn off remaining vapors in the isolated one-mile section of Line 5 near a site impacted by a third-party line strike in northern Wisconsin.
Flare stacks safely burn excess hydrocarbon vapors in a controlled and planned manner.
Extensive air monitoring at the flare site, the incident site, and in the surrounding area continues to show safe air quality outside of the evacuation zone and where crews are working. However, the exclusion zone remains around the active incident site, and the “no-fly” zone continues over the site issued by the Iron County Sheriff.
Background on incident
On Tuesday, Aug. 25, a parked and unoccupied subcontractor flatbed truck delivering equipment to the site rolled forward into an open excavation at a Line 5 valve project, striking the pipe and releasing natural gas liquids (NGLs), mainly propane and butane. NGLs are transported by pipeline as liquids, but when exposed to normal outdoor conditions, rapidly vaporize into gases.
No one was injured. As a precaution, a nearby rural home was evacuated. The affected section of pipe was immediately isolated, and Line 5 remains shut down.
Enbridge continues to progress towards the goal of safely restoring service to the pipeline by September 5.
Line 5 is critical energy infrastructure serving 10 refineries and propane production facilities delivering affordable energy to millions of consumers in the Midwest and Great Lakes regions.
Updates will be provided as additional information becomes available.
Aug. 31, 2026 Line 5 incident update (posted at 4:50 p.m. CT)
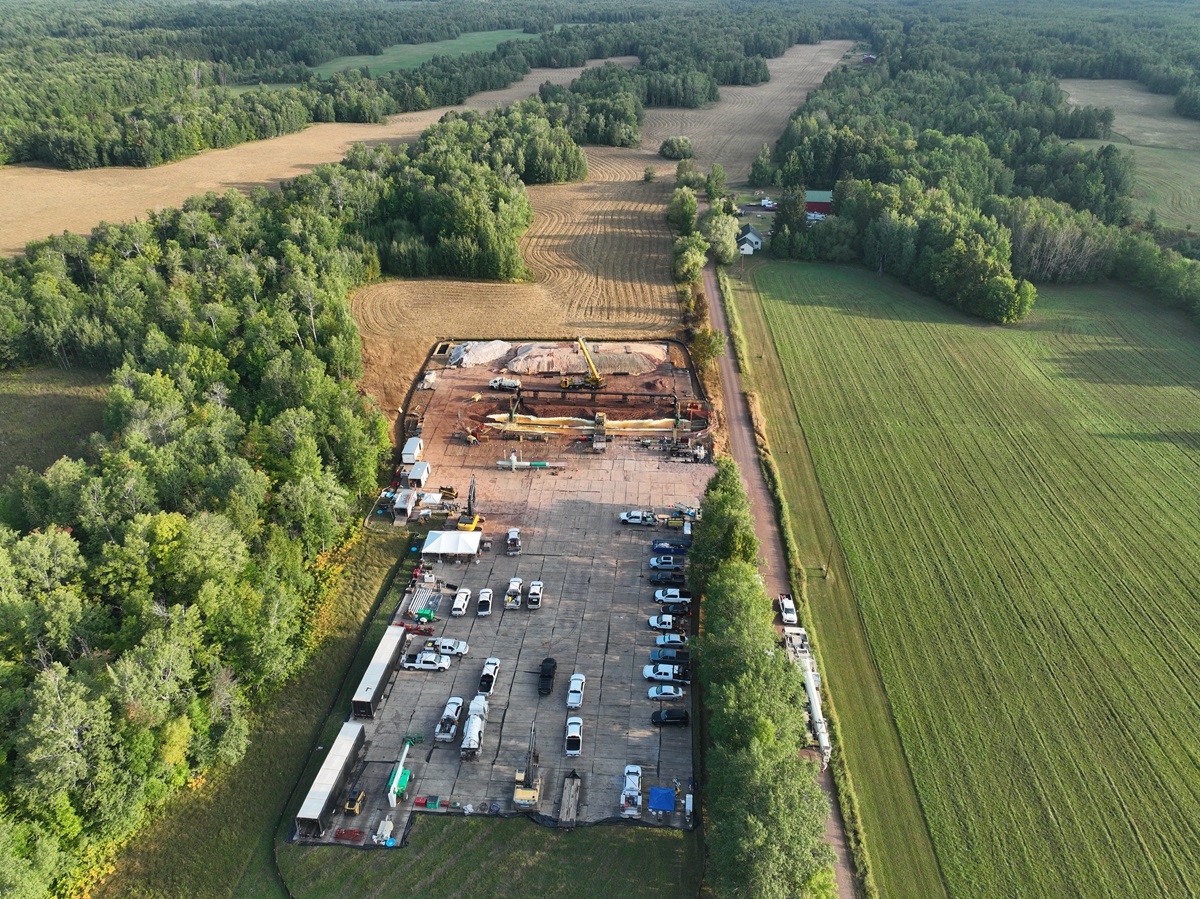
_Aerial view of incident site captured Monday, Aug. 31. Click here, or on the image above, to download this Aug. 31 image of the Line 5 valve site in Iron County, Wisconsin (automatic download of zipped folder).
_
Today Enbridge crews continued to use a combination of nitrogen and trailer-mounted flare stacks to safely evacuate and burn off remaining vapors in the isolated one-mile section of Line 5 near a site impacted by a third-party line strike in northern Wisconsin.
Flare stacks safely burn excess hydrocarbon vapors in a controlled and planned manner.
Extensive air monitoring at the flare site, the incident site, and in the surrounding area continues to show safe air quality outside of the evacuation zone and where crews are working. However, the exclusion zone remains around the active incident site, and the “no-fly” zone continues over the site issued by the Iron County Sheriff.
Background
On Tuesday, Aug. 25, a parked and unoccupied third-party subcontractor flatbed truck delivering equipment to the site rolled forward into an open excavation at a Line 5 valve project, striking the pipe and releasing natural gas liquids (NGLs), mainly propane and butane. NGLs are transported by pipeline as liquids, but when exposed to normal outdoor conditions, rapidly vaporize into gases.
No one was injured. As a precaution, a nearby rural home was evacuated. The affected section of pipe was immediately isolated, and Line 5 remains shut down.
Enbridge continues to progress towards the goal of safely restoring service to the pipeline by Sept. 5.
Line 5 is critical energy infrastructure serving 10 refineries and propane production facilities delivering affordable energy to millions of consumers in the Midwest and Great Lakes regions.
Updates will be provided as additional information becomes available.
Aug. 30, 2026 Line 5 incident update (posted at 6:50 p.m. CT)
Today, Enbridge crews began using trailer-mounted flare stacks to safely remove remaining vapors from the isolated section of Line 5 impacted by a third-party line strike in northern Wisconsin.
The flare stacks safely burn excess hydrocarbon vapors in a controlled and planned manner.
Extensive air monitoring remains in place during this work, at the flare site, the incident site, and in the surrounding area. While monitoring continues to show safe air quality where crews are working, the half mile evacuation zone around the incident remains in place, as does the “no-fly” zone over the site issued by the Iron County Sheriff.
Today, local first responders were able to stand down as a private contractor joined to support those duties. Around 150 people are supporting the response, including Enbridge personnel. There have been no injuries during the response.
Background
On Tuesday, Aug. 25, a parked and unoccupied third-party subcontractor flatbed truck delivering equipment to the site rolled forward into an open excavation at a Line 5 valve project, striking the pipe and releasing natural gas liquids (NGLs), mainly propane and butane. They are transported by pipeline as liquids, but when exposed to normal outdoor conditions, rapidly vaporize into gases.
No one was injured. As a precaution, a nearby rural home was evacuated. The affected section of pipe was immediately isolated, and Line 5 remains shut down
Enbridge continues to work towards the goal of safely restoring service to the pipeline by September 5. Line 5 is critical energy infrastructure serving 10 refineries and propane production facilities delivering affordable energy to millions of consumers in the Midwest and Great Lakes regions.
Updates will be provided as additional information becomes available.
Aug. 29, 2026 Line 5 incident update (posted at 8:18 p.m. CT)
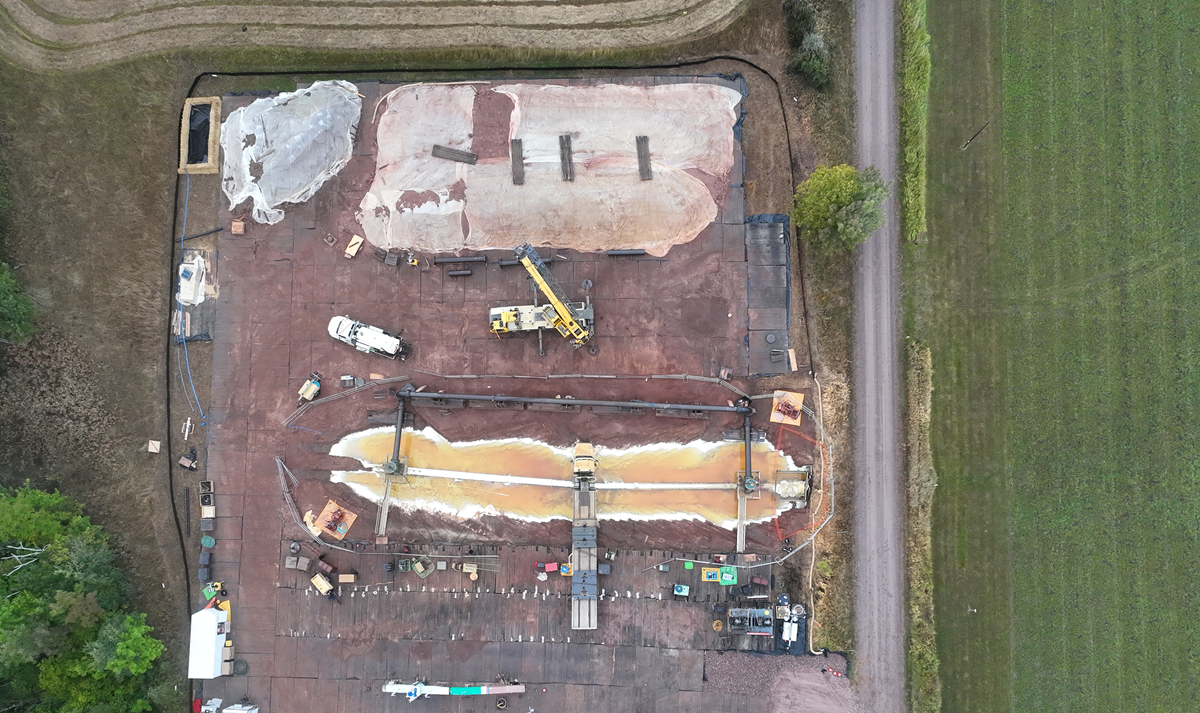
_Wide aerial view of incident site captured Saturday, Aug. 29. Click here, or on the image above, to download these three Aug. 29 images of the Line 5 valve site in Iron County, Wisconsin (automatic download of zipped folder).
_
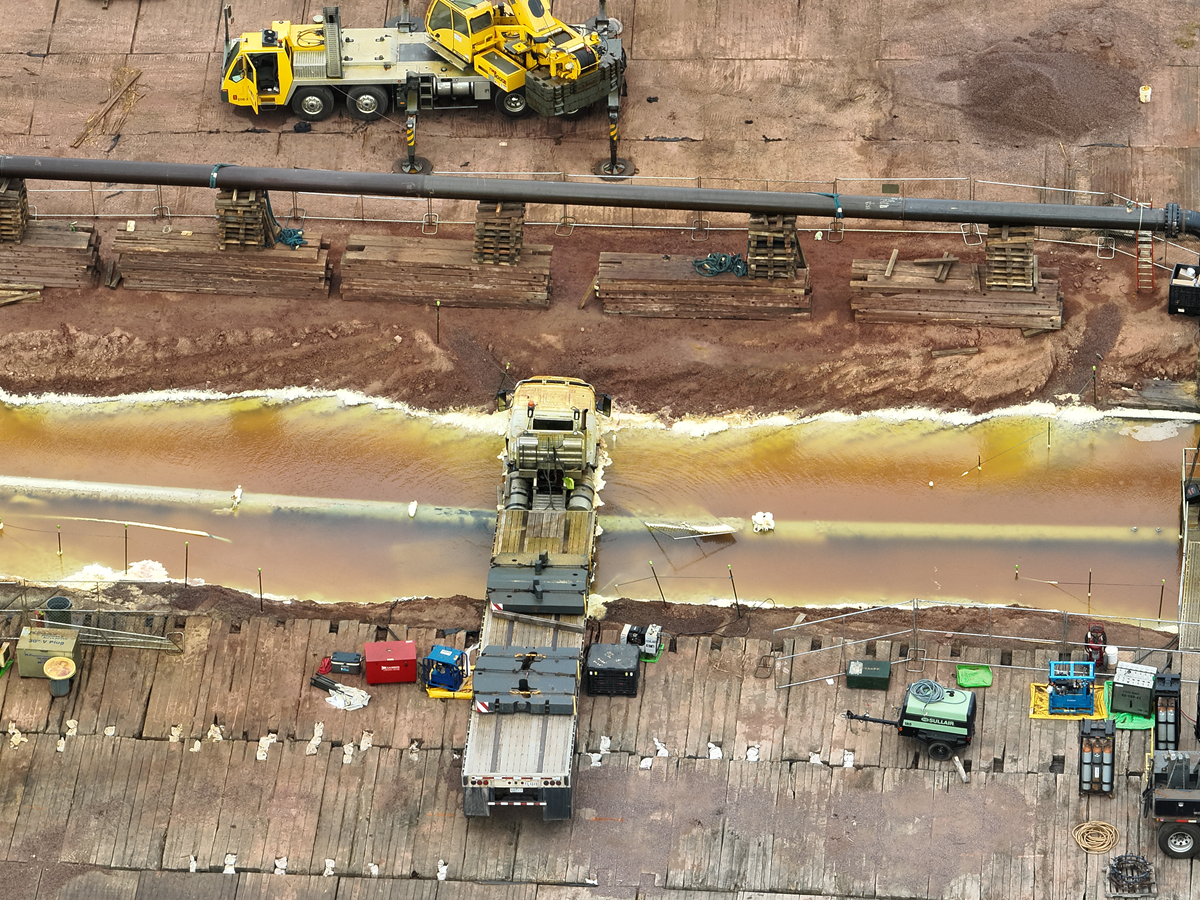
_Closer aerial view of incident site captured Saturday, Aug. 29. Click here, or on the image above, to download these three Aug. 29 images of the Line 5 valve site in Iron County, Wisconsin (automatic download of zipped folder).
_
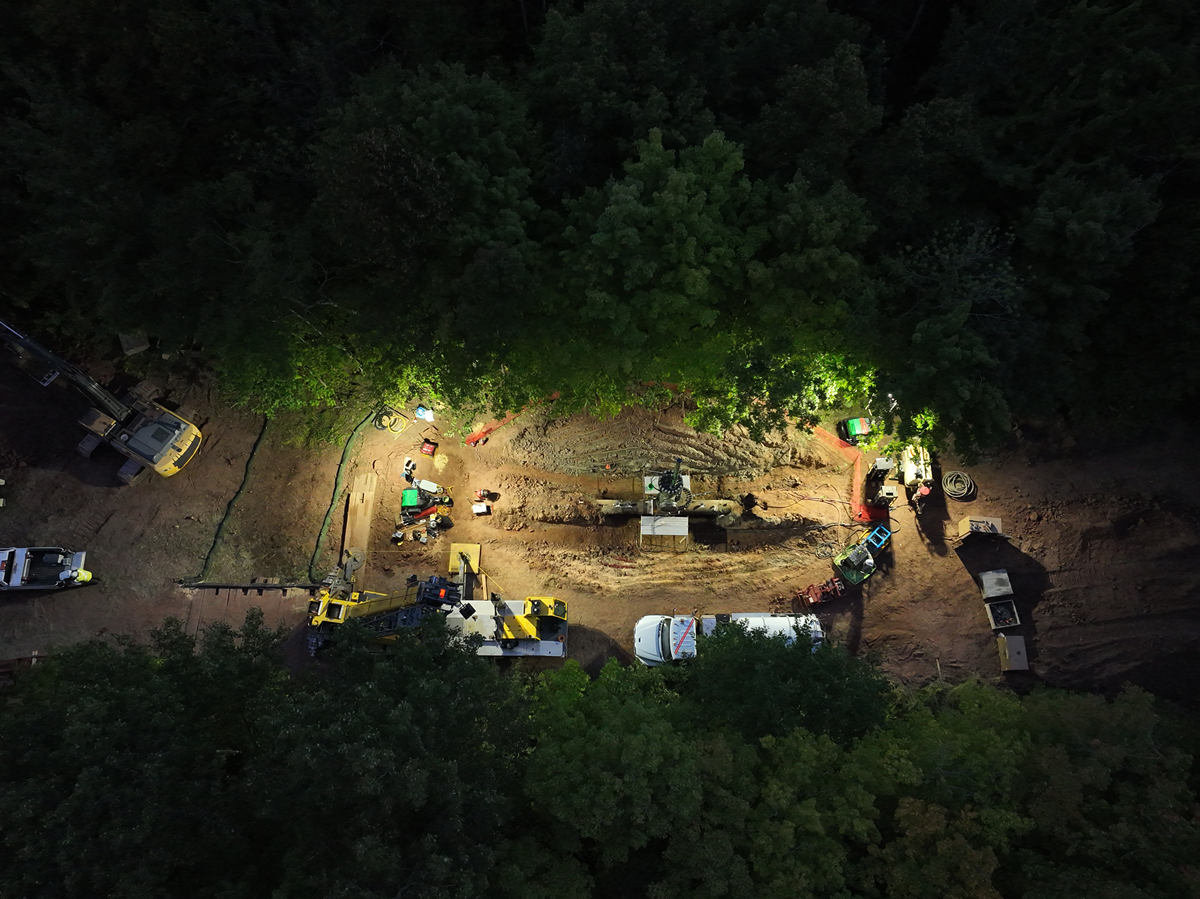
_Overnight work outside of the evacuation zone to prepare the pipeline to remove remaining vapor, captured Saturday Aug. 29. Click here, or on the image above, to download these three Aug. 29 images of the Line 5 valve site in Iron County, Wisconsin (automatic download of zipped folder).
_
Enbridge crews are moving specialized pieces of equipment into place as a plan moves forward to safely remove remaining vapors from the isolated section of Line 5 impacted by a third-party line strike in northern Wisconsin.
Enbridge will use trailer-mounted flare stacks to safely burn excess hydrocarbon vapors in a controlled and planned manner in the coming days.
Extensive air monitoring will continue during this work, at the flare site, the incident site, and in the surrounding area. While monitoring continues to show safe air quality where crews are working, the half mile evacuation zone around the incident remains in place, as does the “no-fly” zone over the site issued by the Iron County Sheriff.
Natural gas liquids (NGLs), which are mainly propane and butane, are transported by pipeline as liquids. When exposed to normal outdoor conditions, they rapidly vaporize into gases. As of Aug. 29, at 6:00 p.m. CT, about 2,000 barrels of liquid product are contained at the site within the excavation area. About 31,000 barrels of primarily propane and butane have vaporized and dispersed into the atmosphere.
Around 150 people are supporting the response, including Enbridge personnel and local first responders. There have been no injuries during the response.
Background
On Tuesday, Aug. 25, a parked and unoccupied third-party subcontractor flatbed truck delivering equipment to the site rolled forward into an open excavation at a Line 5 valve project, striking the pipe and releasing natural gas liquids (NGLs). No one was injured. As a precaution, a nearby rural home was evacuated. The affected section of pipe was immediately isolated, and Line 5 remains shut down.
Enbridge continues to work towards the goal of safely restoring service to the pipeline by September 5. Line 5 is critical energy infrastructure serving 10 refineries and propane production facilities delivering affordable energy to millions of consumers in the Midwest and Great Lakes regions.
Updates will be provided as additional information becomes available.
Aug. 28, 2026 Line 5 incident update (posted at 2:45 p.m. CT)
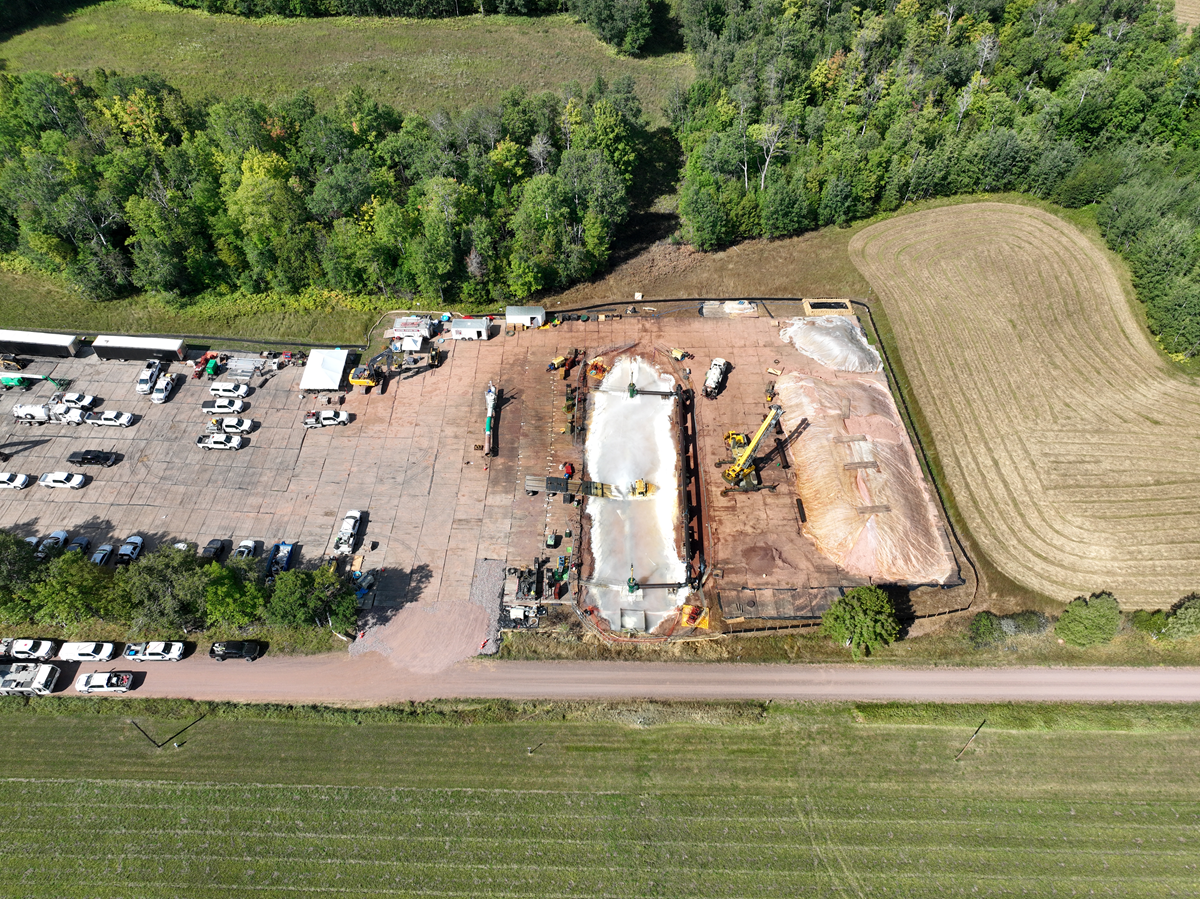
_Click here, or on the image above, to download a high-resolution image, captured on Aug. 28, 2026, of the Line 5 valve site in Iron County, Wisconsin (automatic download of zipped folder).
_
Crews continue to work around the clock moving forward with plans to safely remove remaining vapors from the already isolated section of Line 5 impacted by a third-party line strike in northern Wisconsin. Specialized equipment is being moved into place to facilitate the work.
Initially, power was shut down in the evacuation area as a precaution to eliminate ignition sources, and 55 local customers lost power. Late yesterday, power was restored to nearly all affected homeowners in cooperation with Bayfield Electric and Xcel Energy. Enbridge is continuing to provide support to the remaining five impacted customers.
For the safety of first responders, the local community, and response personnel, the half mile evacuation zone around the incident remains in place, as does the “no-fly” zone over the site issued by the Iron County Sheriff.
Around 150 people are supporting the response, including Enbridge personnel and local first responders. There have been no injuries during the response.
Return to service
Enbridge continues to respond to the incident and work toward safely restoring service to the pipeline. Enbridge estimates a return to service by Saturday, Sept. 5. Please note that this remains an estimated return-to-service window, and Enbridge will continue to provide regular updates as work progresses.
Enbridge continues to work closely with impacted customers, including refineries, to help mitigate the effects of this outage. This includes implementing contingency measures across both the broader network and affected regions, in coordination with customers, to minimize disruptions wherever possible.
Background on incident
On Tuesday, Aug. 25, a parked and unoccupied third-party subcontractor flatbed truck delivering equipment to the site rolled forward into an open excavation at a Line 5 valve project, striking the pipe and releasing natural gas liquids (NGLs). No one was injured. As a precaution, a nearby rural home was evacuated. The affected section of pipe was immediately isolated, and Line 5 remains shut down.
As a reminder, the incident involves the release of primarily propane and butane, not natural gas. NGLs are hydrocarbons separated from natural gas during processing. Common NGL products include propane, butane, and ethane. These products are used for home heating, crop drying, and as key building blocks in thousands of everyday products, including plastics, medical supplies, electronics and clothing.
More information will be provided as it becomes available.
Aug. 27, 2026 Line 5 incident update (posted at 7:36 p.m. CT)
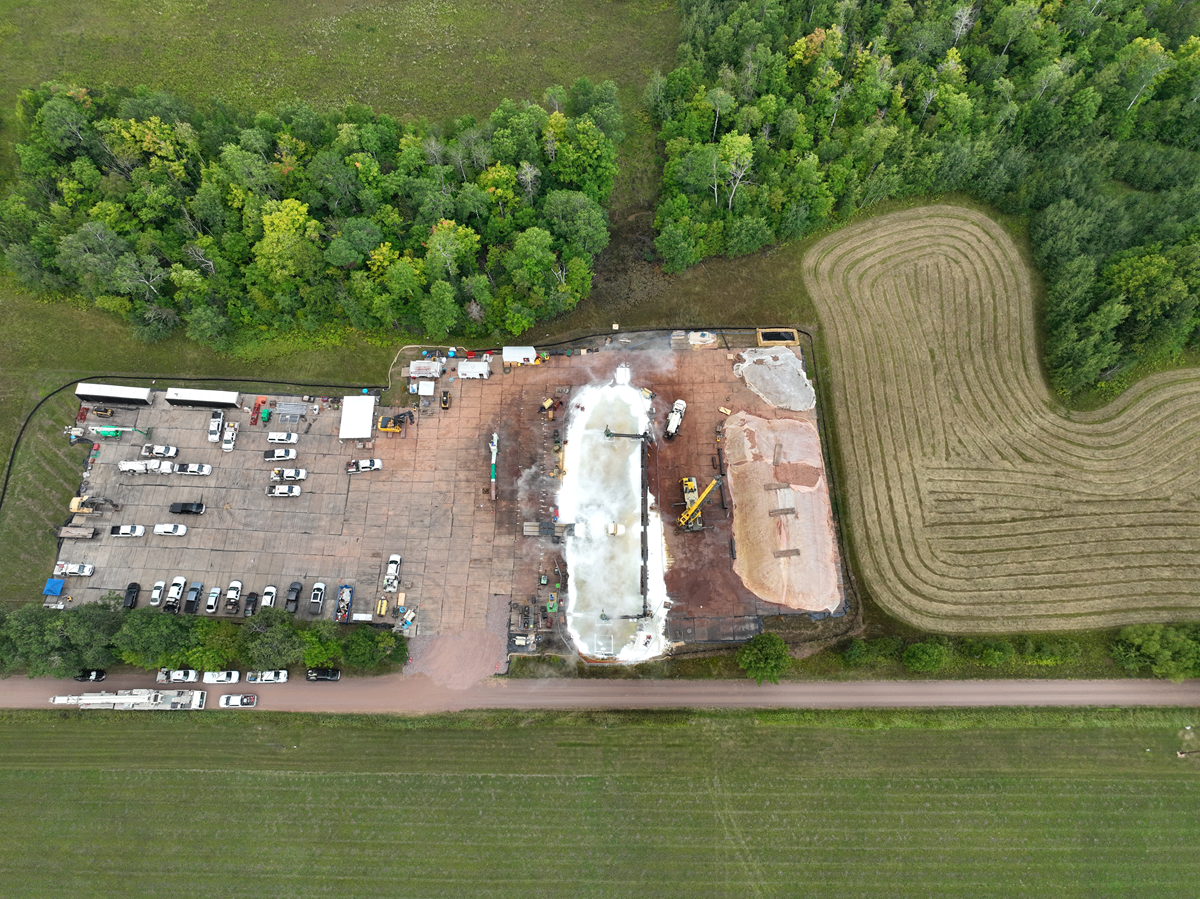
_Click here, or on the image above, to download a high-resolution image, captured on Aug. 27, 2026, of the Line 5 valve site in Iron County, Wisconsin (automatic download of zipped folder).
_
Around 150 people are working on the response to the incident at a Line 5 valve project in northern Iron County, Wisconsin—including Iron County Emergency Management, the Iron County Sheriff’s Department, Ashland and Superior Hazardous Materials teams, local fire departments from Gurney, Saxon, and Kimball, and Enbridge response personnel. We want to thank all of the emergency responders for their expert support of the incident. There have been no injuries during the response.
For the safety of first responders, the local community and Enbridge response teams, the Iron County Sheriff has issued a “no-fly zone” over the site and access to the site is restricted.
On Tuesday, Aug. 25, a parked, unoccupied flatbed third-party subcontractor truck delivering equipment to the site rolled into an open excavation site on a Line 5 valve project, striking the pipe and releasing natural gas liquids (NGLs). No one was injured. As a precaution, a nearby rural home was evacuated. The affected section of pipe was immediately isolated, and Line 5 remains safely shut down.
Enbridge continues to work on the response and restoration of service to the pipeline.
As a reminder, the incident involves the release of natural gas liquids (NGLs)—not natural gas. NGLs are hydrocarbons that are separated from natural gas during processing. Common NGL products include propane, butane and ethane. These are used for heating homes and drying crops, as well as the building blocks for thousands of everyday products, including plastics, medical supplies, electronics, and clothing.
More information will be provided as it becomes available.
Aug. 26, 2026 Line 5 incident update (posted at 6:49 p.m. CT)
Enbridge crews continue to work with local emergency response teams to respond to a line strike in rural northern Iron County, Wisconsin.
On Tuesday, Aug. 25, a parked, unoccupied semi-truck rolled into an open excavation site on a Line 5 valve project, striking the pipe and releasing natural gas liquids (NGLs). No one was injured. As a precaution, a nearby rural home was evacuated. The affected section of pipe was immediately isolated, and Line 5 remains safely shut down.
Enbridge is working to stabilize the situation and restore service to the pipeline. Enbridge currently estimates the return to service of Line 5 between Aug. 31 and Sept. 5. Enbridge notes this is an estimated return to service range and will be providing regular updates. Enbridge is working alongside its impacted customers to mitigate the impact of this outage. This includes redirecting volumes across the Enbridge network, increasing connectivity and capacity where possible and working with parties on a regional basis to limit disruptions.
As a safety precaution the Iron County Sheriff has issued a “no fly zone” over the site and access to the site is restricted.
The incident involves the release of natural gas liquids (NGLs)—not natural gas. NGLs are hydrocarbons that are separated from natural gas during processing. Common NGL products include propane, butane, and ethane. These are used for heating homes and drying crops, as well as the building blocks for thousands of everyday products, including plastics, medical supplies, electronics, and clothing.
More information will be provided as it becomes available.
Aug. 25, 2026 statement
On Tuesday, Aug. 25, a parked, unoccupied semi-truck rolled into an open excavation site on a Line 5 valve project in rural northern Iron County, Wisconsin, striking the pipe and releasing Natural Gas Liquids (NGLs). No one was injured. As a precaution, a nearby rural home was evacuated.
The section of pipe was immediately isolated, and local emergency response crews are on site. Line 5 remains shut down.
We will provide more information as it becomes available.
Line 5 Wisconsin Newsroom
Plus Symbol A vertical and horizontal line forming a cross
Line 5 is a vital link to propane and other energy supplies for the upper Midwest.
Learn more Plus Symbol A vertical and horizontal line forming a cross
Line 5 Wisconsin Segment Relocation Project
Plus Symbol A vertical and horizontal line forming a cross
Relocating 12 miles of Line 5 from the Bad River Reservation, replacing with 41 miles of pipe outside the Reservation.
Learn more Plus Symbol A vertical and horizontal line forming a cross



Add To Favorites
My Favorite
Return to this page later
Save time by adding this page to your list of favorites. On your next visit, you'll find a shortcut to this page in the main menu
This page has been added to your list of favorites. Click to remove it from your list.
Back to top 

Operations
© 2026 Enbridge Inc. All Rights Reserved
Detected Location: Phuket Change location


