Jun 05, 2026 Topic: Sustainability / Corporate At Eldorado, our approach to climate change is rooted in action-making measurable changes to reduce greenhouse gas emissions, improve energy efficiency, and integrate lower-emissions technologies…
Jun 05, 2026
Topic: Sustainability / Corporate
At Eldorado, our approach to climate change is rooted in action-making measurable changes to reduce greenhouse gas emissions, improve energy efficiency, and integrate lower-emissions technologies across our operations. Across our sites, this means investing in battery-electric equipment, expanding across to renewable electricity, and identifying practical ways to operate more sustainably.
This World Environment Day, we are highlighting how these efforts are being implemented across our business, from electrifying key equipment to supporting communities with cleaner, more sustainable solutions that make a difference where we operate.
CANADA
At our Lamaque Complex in Québec, our operational team has expanded its fleet of battery-electric vehicles (BEVs), in line with the development of the Ormaque deposit as a second production hub. The goal is to have 12 BEV units in operation by 2027, including seven Sandvik TH550B ore haul trucks and 5 Toro® LH518iB shuttle loaders. As of October 2025, four 50-tonnes trucks are already in operation, with an additional three trucks and five 18-tonne shuttle loaders scheduled for delivery between mid-2026 and 2027.
Each vehicle is expected to reduce CO2 emissions by approximately 600 tonnes per year compared to diesel-powered equivalents, based on current operating assumptions and Québec’s largely renewable electricity grid. Beyond emissions reductions, the new equipment also enhances performance, with BEV trucks delivering up to a 20% increase in productivity, including higher full load speeds of 14 km/h versus 8 km/h for diesel trucks.
At our McIlvenna Bay in Saskatchewan, we are advancing our commitment to lower-emission operations by integrating BEV technology into our underground operations. Building on operational learnings from the Lamaque Complex, the planned BEV fleet is expected to include jumbos, boom bolters, load-haul-dump (LHD) units, and haul trucks—bringing cleaner, more efficient equipment into key stages of the mining cycle. Energy infrastructure is also playing a critical role in enabling emissions reduction. With the recent completion of the site’s transmission line, McIlvenna Bay now has access to reliable grid electricity. This allows us to reduce greenhouse gas emissions by implementing electric heating systems and enabling underground BEVs to operate using lower-emission energy sources from the outset.
GREECE
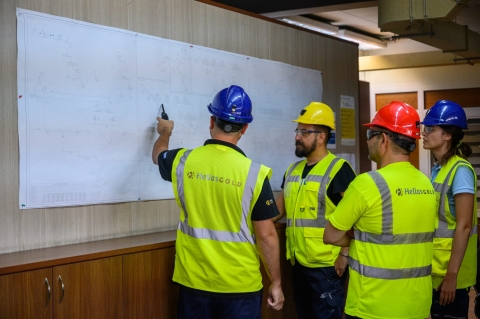
In early 2026, our team in Greece added two fully electric Mercedes-Benz Actros e600 Pro Cabin heavy-duty trucks to its fleet, designed for continuous operation under demanding conditions. These vehicles support the transport of concentrate from the Olympias mine to Hellas Gold’s port facilities in Stratoni.
This route is being transformed into a lower-noise, zero tailpipe-emission transport system––helping to reduce our environmental impacts while minimizing disruption for the local communities along the route. This initiative is part of Hellas Gold’s broader efforts to reduce carbon emissions and integrate lower-emission technologies across its operations.
TÜRKIYE
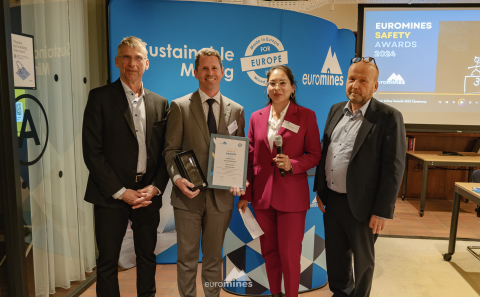
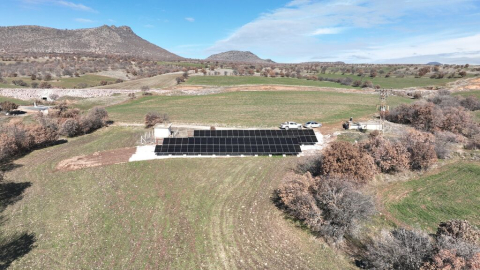
In Türkiye, our team won the 2026 Towards Sustainable Mining (TSM) Environmental Excellence Award for a solar-powered water access project at our Kışladağ mine, completed in December 2025. The project involved installing photovoltaic systems at water wells serving six villages near the mine: Gümüşkol, Katrancılar, Söğütlü, Küçükilyaslı, Gedikler, and Karacaömerli.
With 125 kW of installed solar capacity, the system provides clean, uninterrupted energy to water infrastructure serving more than 1,000 residents across over 350 households, while removing the electricity costs that communities previously required for water pumping.
Developed in collaboration with local village leaders (muhtars) and community stakeholders, each system was tailored to local needs—taking into account population size, number of subscribers, and water usage patterns. This project builds on Tüprag’s longstanding support for improving water access in the region, and reflects a continued focus on addressing community needs through cleaner, more sustainable solutions.
OUR COMMITMENT
Together, these efforts reflect our belief that meaningful progress comes from practical actions. By improving our operations and supporting the communities around us, we aim to contribute to more sustainable outcomes where we operate today and for the future.
Related Stories
May 26, 2026
Sustainability From the Ground Up: 2025 Sustainability Report
Learn More
May 05, 2026
Kışladağ wins 2026 TSM Environmental Excellence Award
Learn More
Jun 05, 2025
Improving Non-Mineral Waste Management on World Environment Day
Learn More
Close popup
Left Right
[](https://www.eldoradogold.com/ "Eldorado Gold Corporation - Link to homepage")
Footer
Our regional sites
Our Social links
Delivered by IDXTM