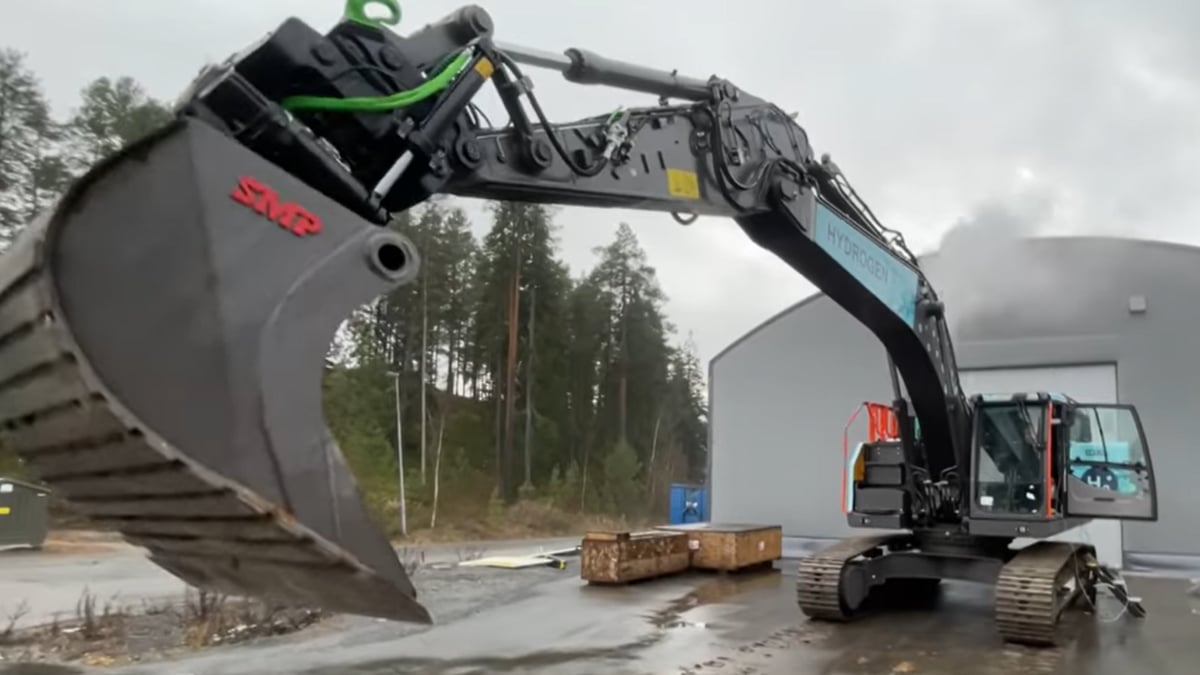
NASDAQ:BLDP Price $1.67 TSX:BLDP Price $2.36 Sustainability Investors Investors Investor Hub Ballard’s investor hub provides essential information and updates for investors, including financial reports, and investment resources. Document Library…




NASDAQ:BLDP Price $1.67 TSX:BLDP Price $2.36
-
Products
Products
Market Application
Application
-
Solutions & Services
-
About us
About us

Our Company
With over four decades of expertise, Ballard delivers efficient and sustainable power solutions for automotive, maritime, rail, and backup power applications, shaping a cleaner future.
-
News & Resources
News & Resources
-
Ask a Fuel Cell Expert
MEDIA KIT
Ballard to showcase latest FCmove®-XD 150kW fuel cell engine and introduce Fleet360° at IAA 2026
Latest 150kW heavy-duty fuel cell engine makes its first show appearance alongside a new fleet support offering designed to strengthen uptime and lifecycle value
Ballard Power Systems will put the next generation of heavy-duty fuel cell performance and integrated fleet services at the centre of its presence at IAA TRANSPORTATION 2026 in Hannover, Germany. Ballard will present the latest FCmove®-XD150 for the first time at the show and introduce Ballard Fleet360°, a new lifecycle service offering for fuel cell fleets.
At the event, visitors can meet Ballard's product and service specialists to explore how proven fuel cell technology, actionable operational insights and responsive service can help accelerate the deployment of zero-emission commercial vehicles.
You can find Ballard at Hall 21, Stand D22 in Hannover, Germany from September 14-20.
Read Ballard's show release here
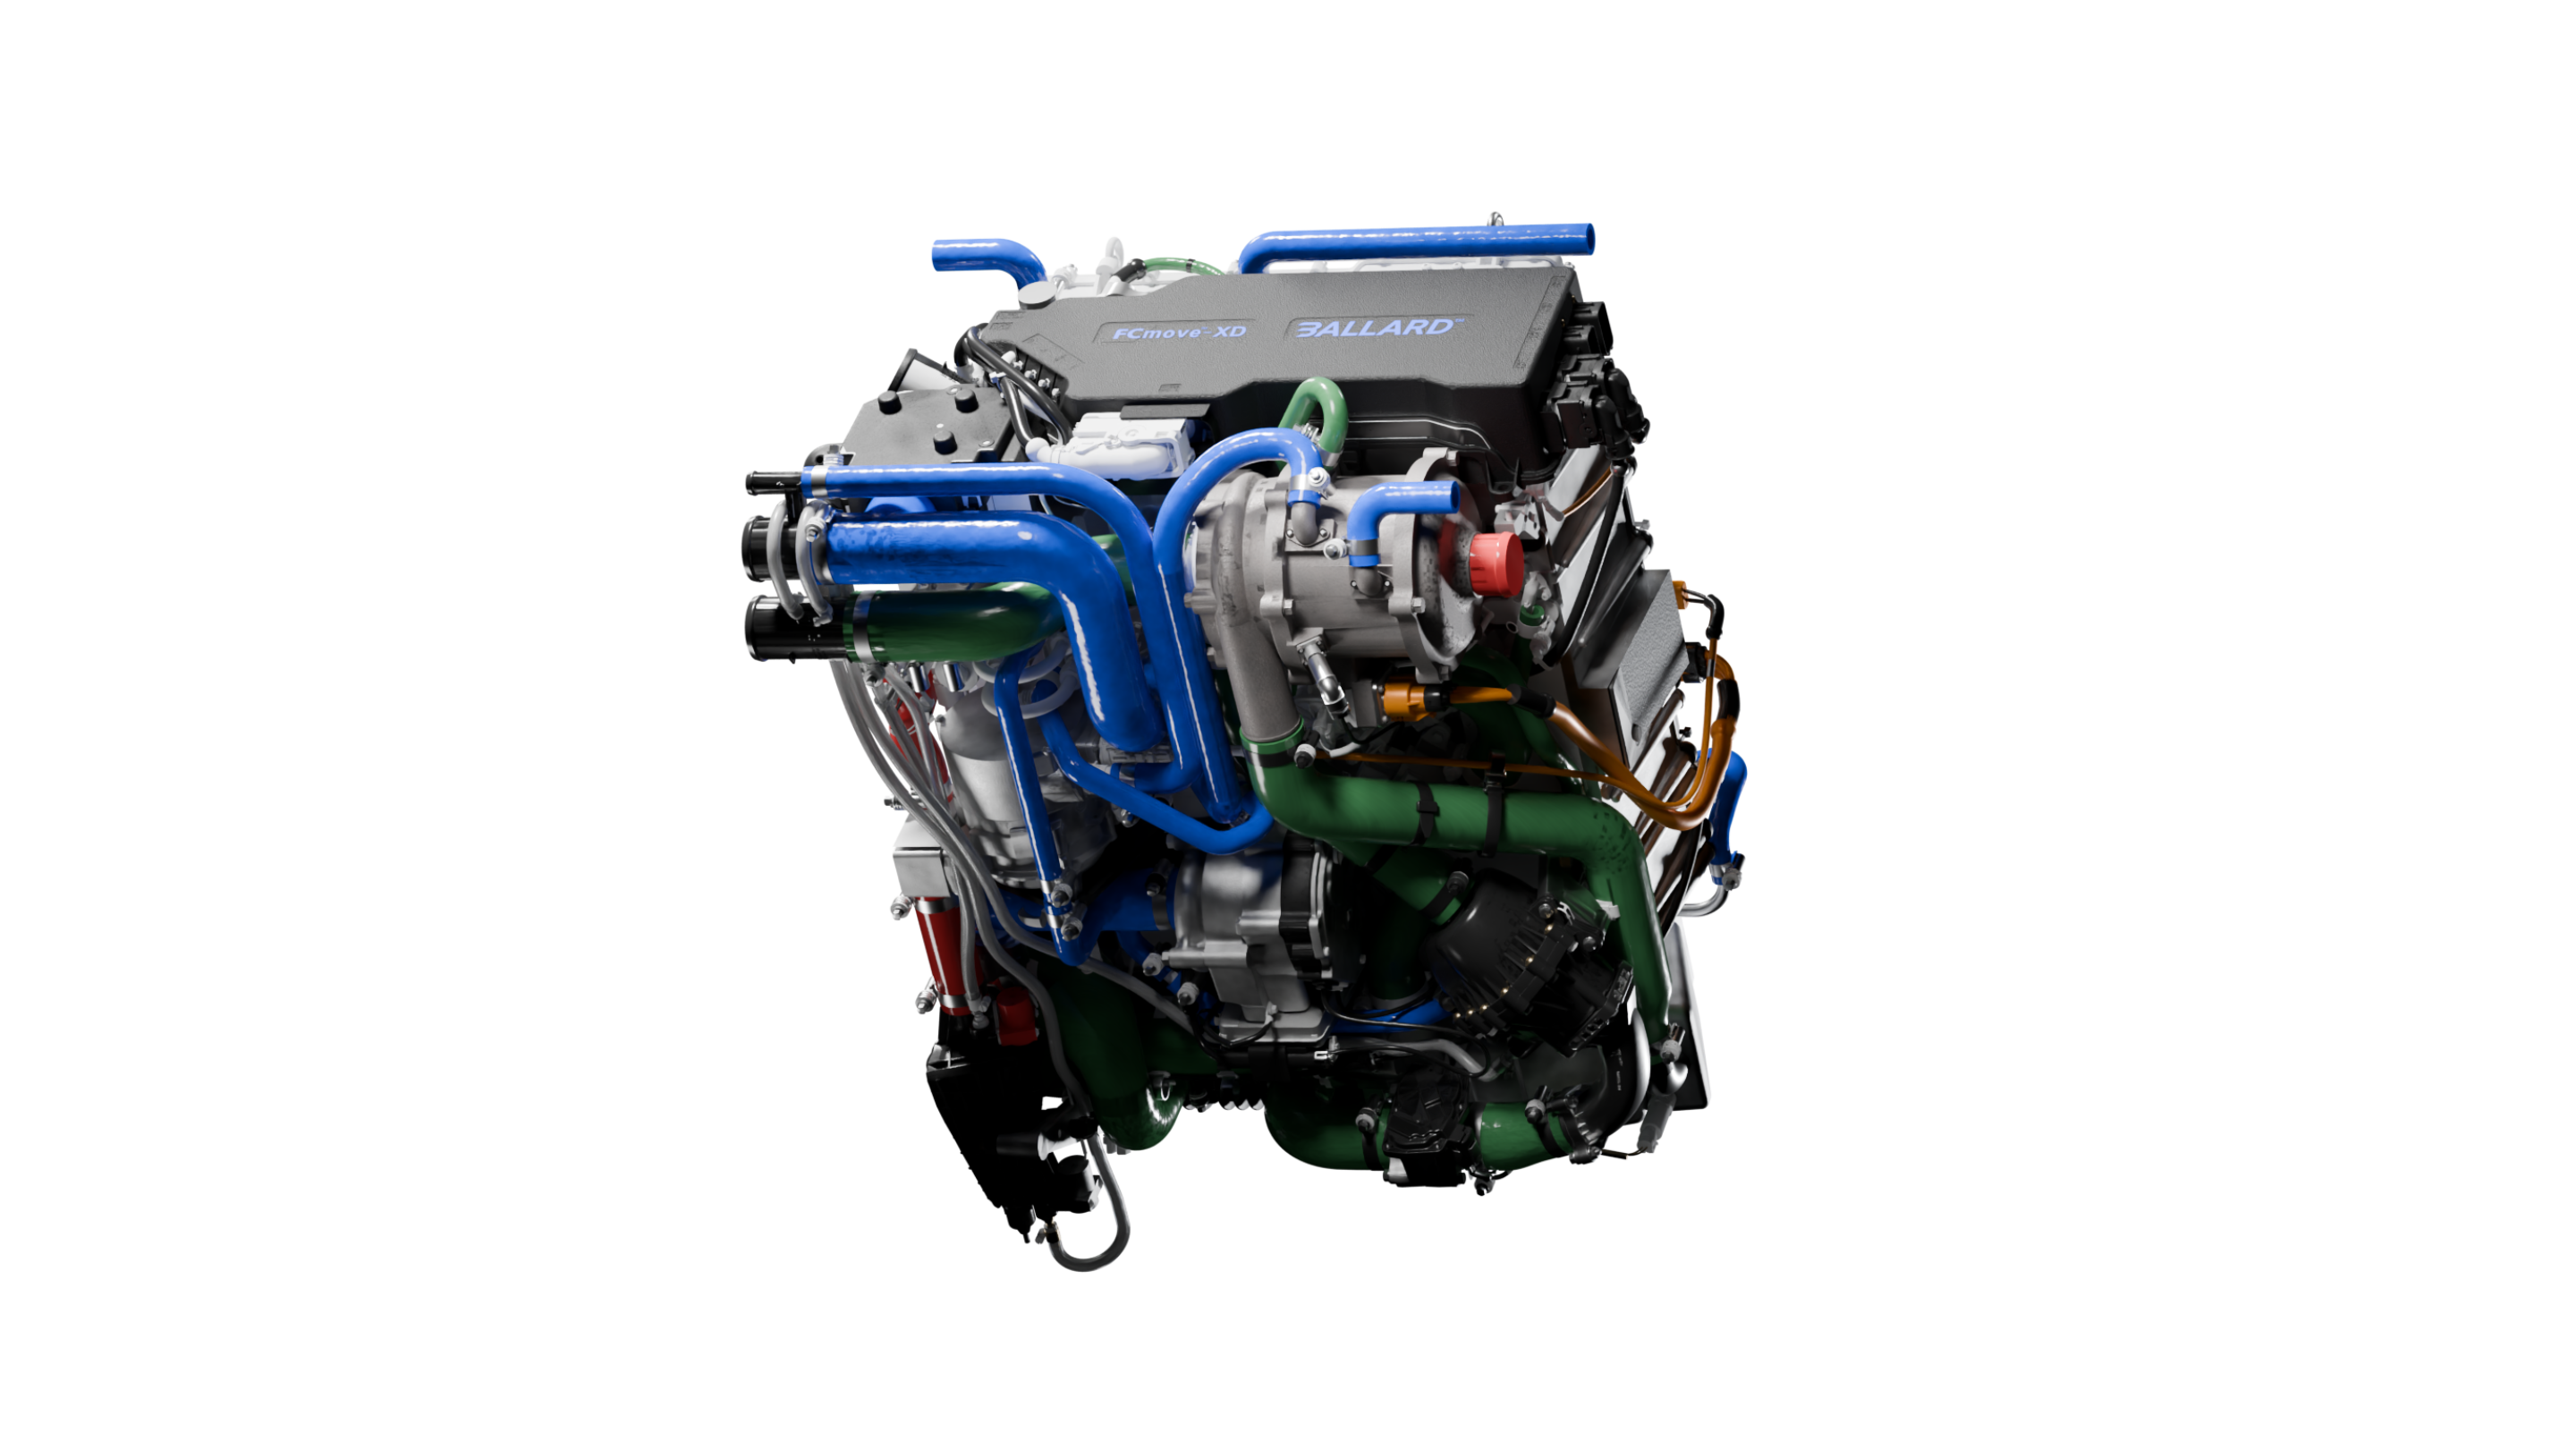
A more integration-ready fuel cell engine
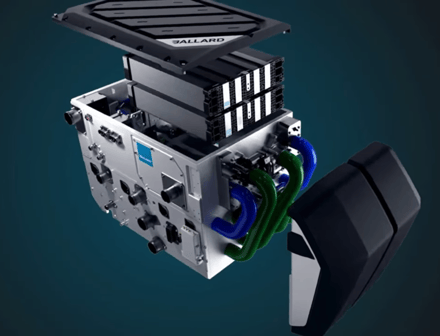
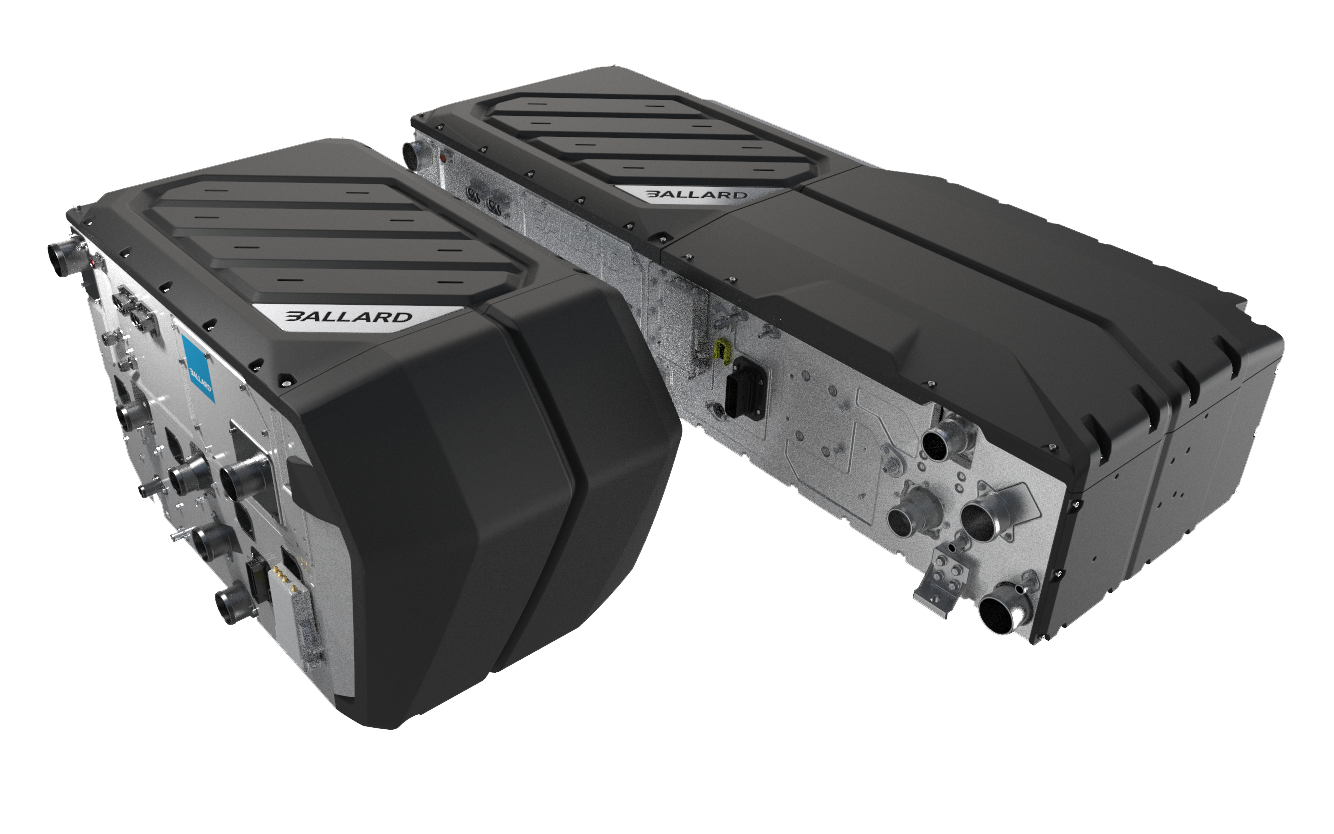
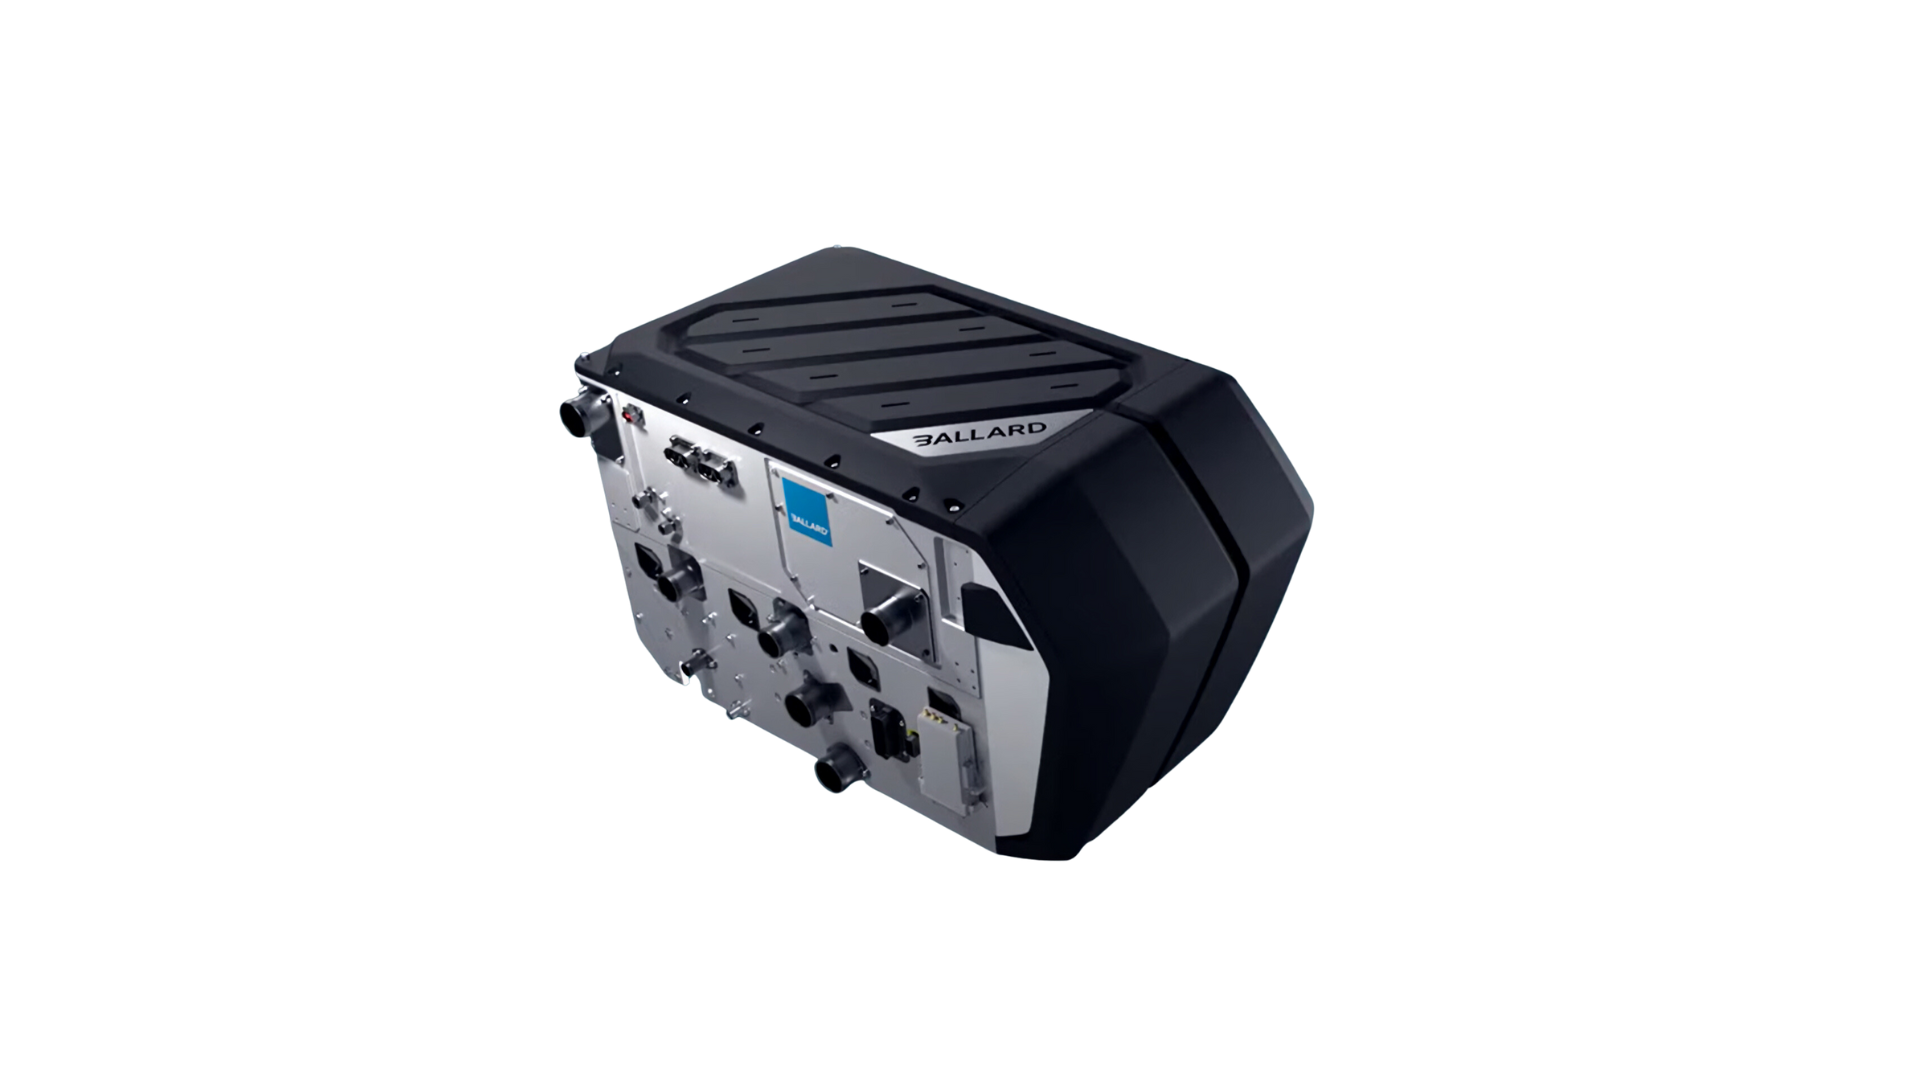
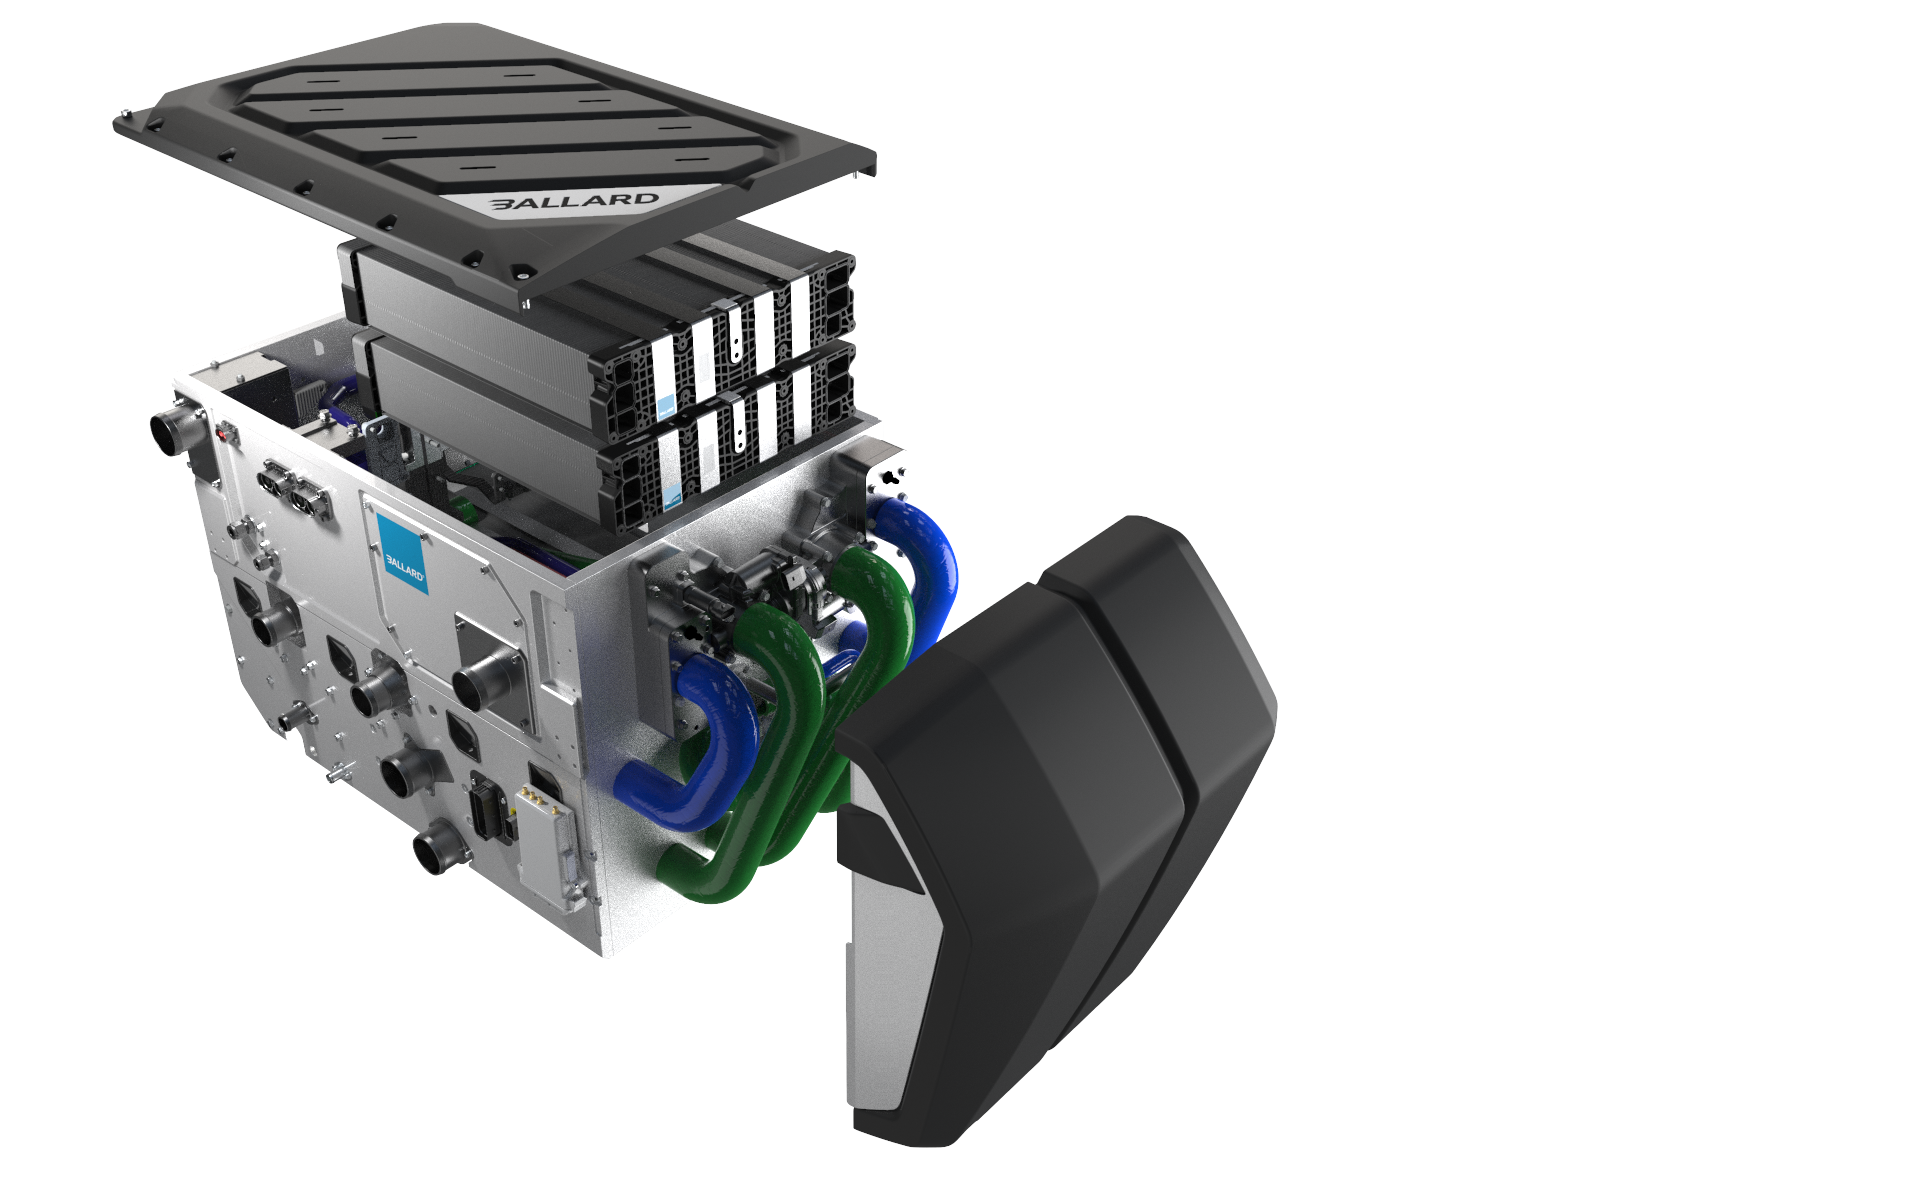
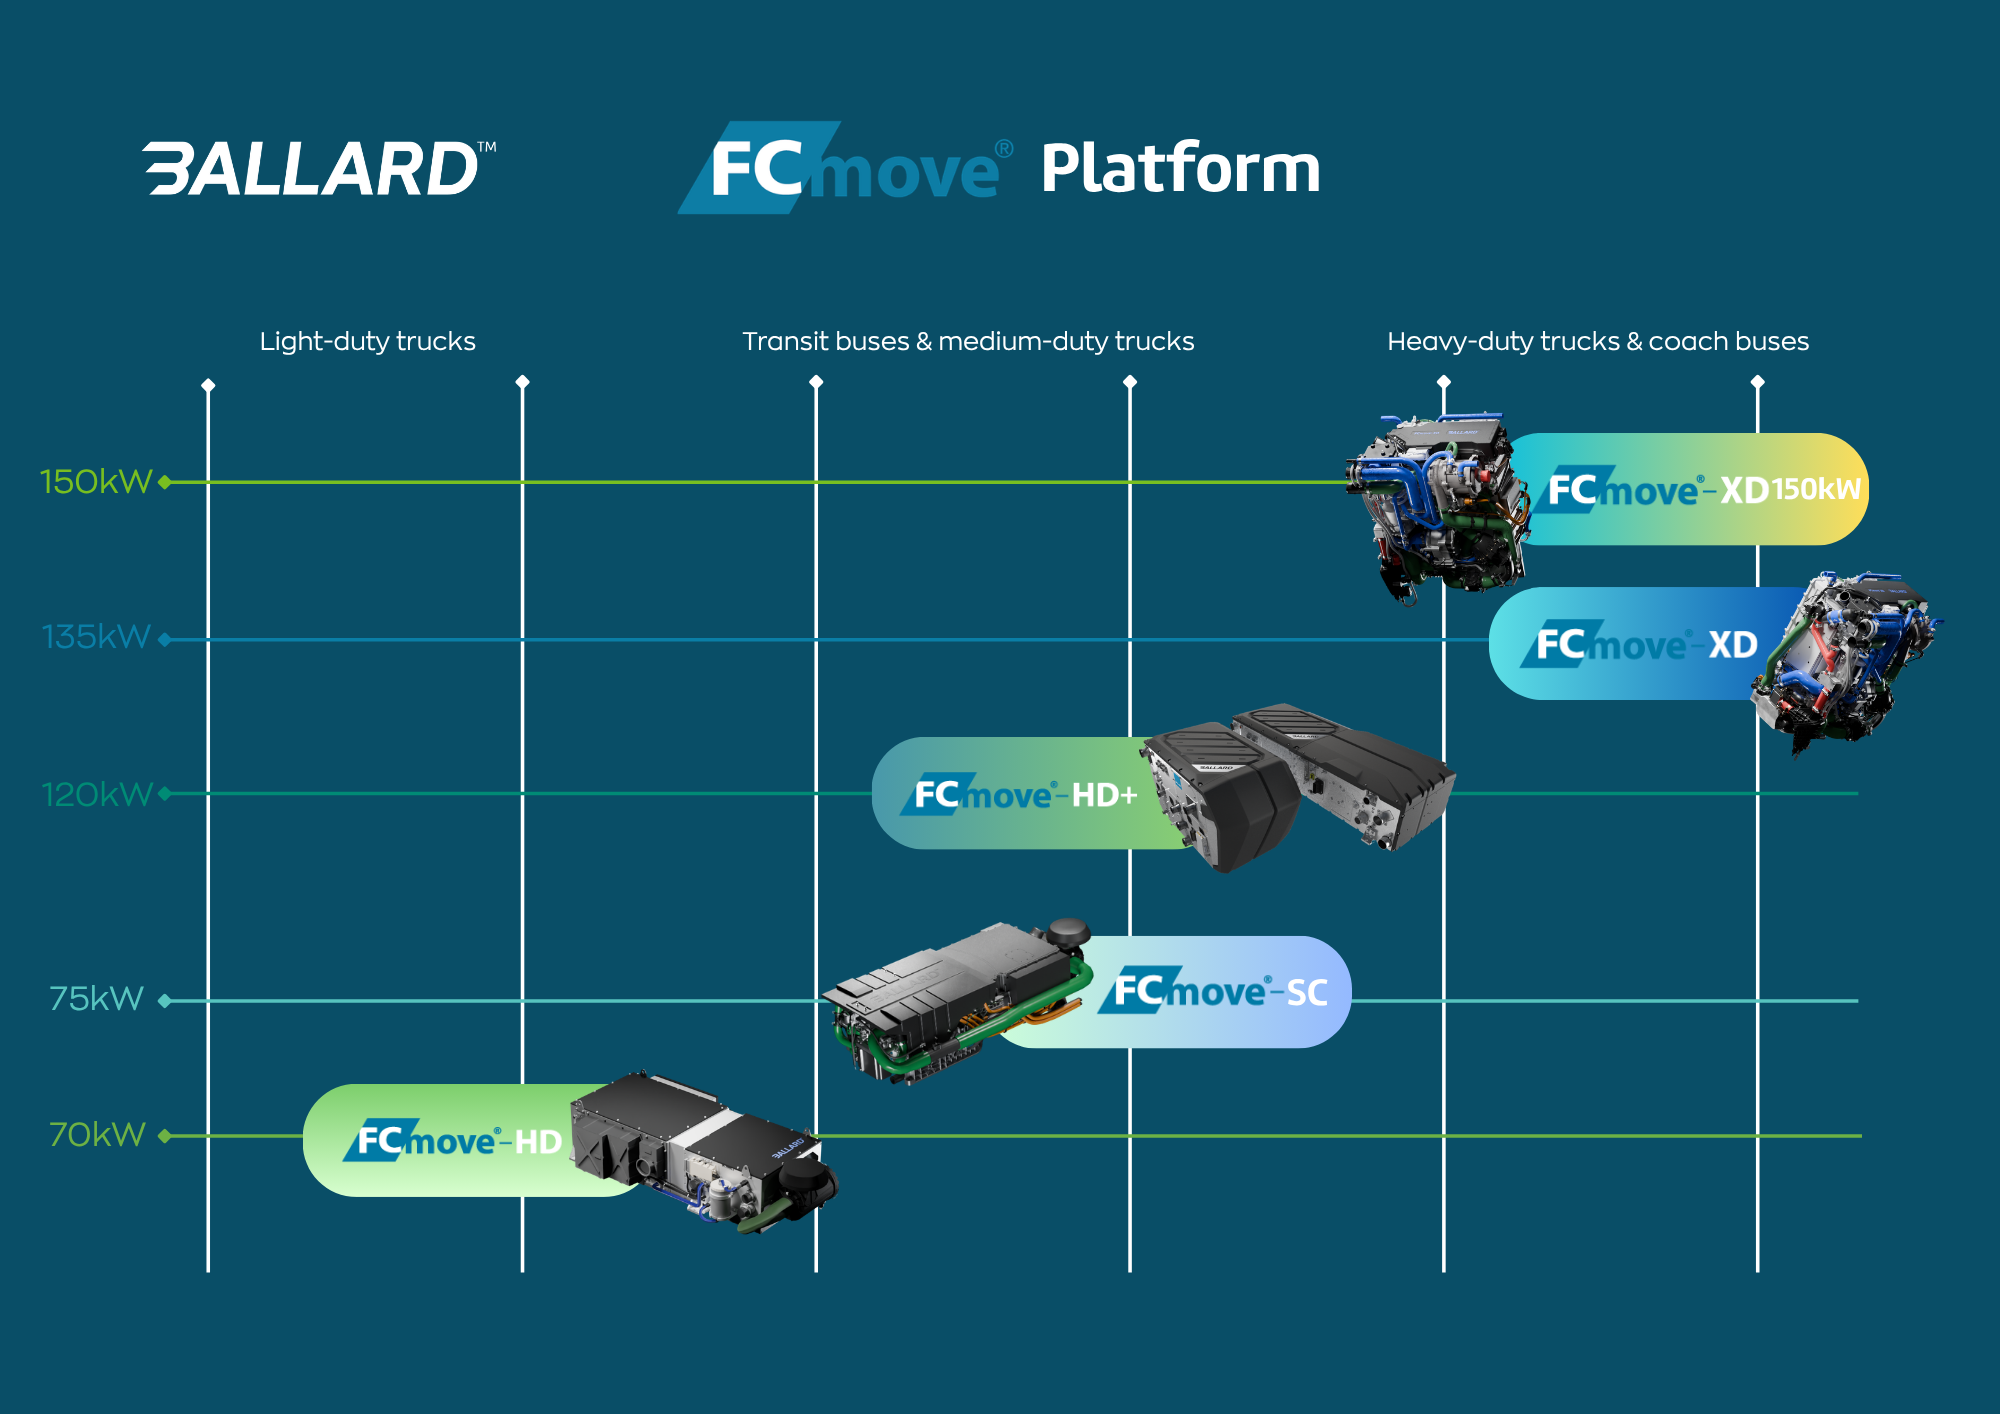
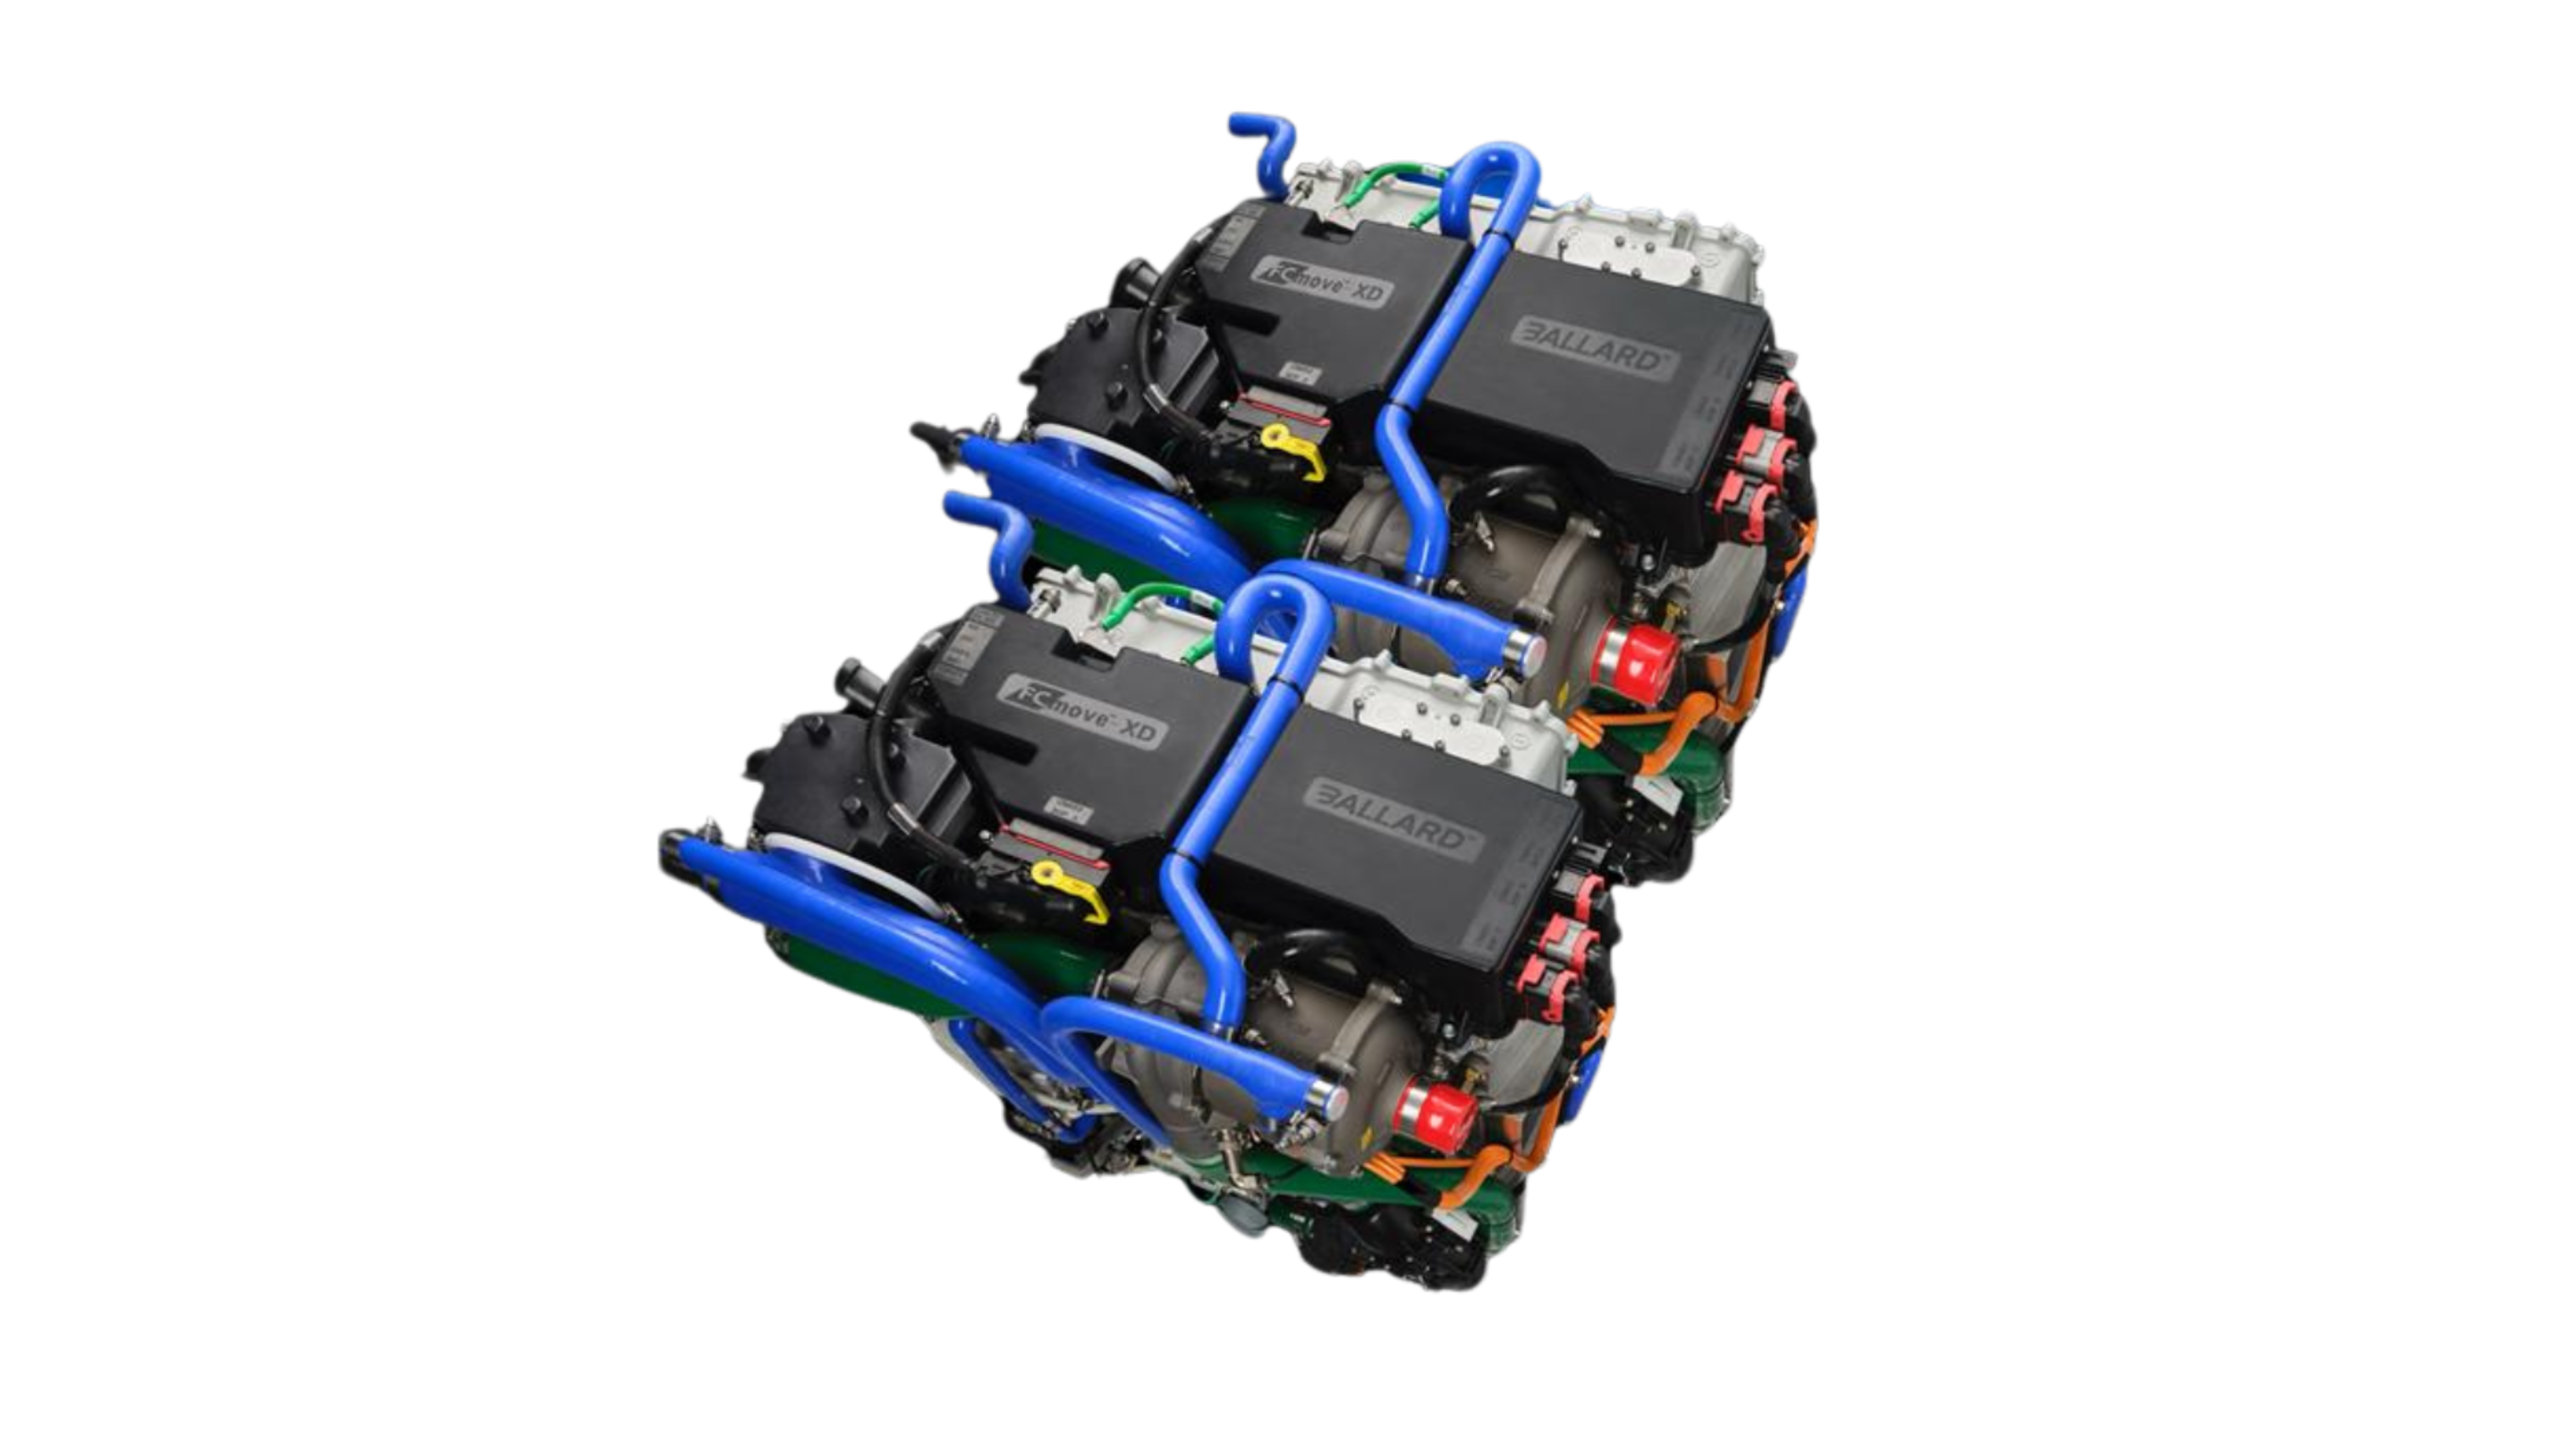
The latest development in Ballard’s proven FCmove® platform is the powerful FCmove®-XD 150kW fuel cell engine developed for demanding heavy-duty truck, bus, rail, and stationary applications. The engine delivers an increase of more than 90% in volumetric power density compared to previous generations.
Its compact, integrated design brings key components together in a package that is 23% smaller by volume than previous models, helping truck manufacturers fit fuel cell power into established vehicle architectures. A single interface supports easier integration, while the modular design allows OEMs to scale power from 150kW to 450kW for different vehicle classes and duty cycles. With optimized vehicle integration, a fuel consumption rate of less than 6kg/100km is achievable for a 40-ton truck under real-world driving conditions.
The new module builds on Ballard's operational experience covering more than 300 million kilometers of heavy-duty mobility, with a fuel cell stack lifetime of more than 25,000 operating hours (under standard conditions) and 98% in-service module power availability. It is also designed to optimize everyday operational requirements, including rapid start-up in temperatures as low as -30°C and remote monitoring that can help identify maintenance needs earlier.
Introducing Ballard Fleet360°
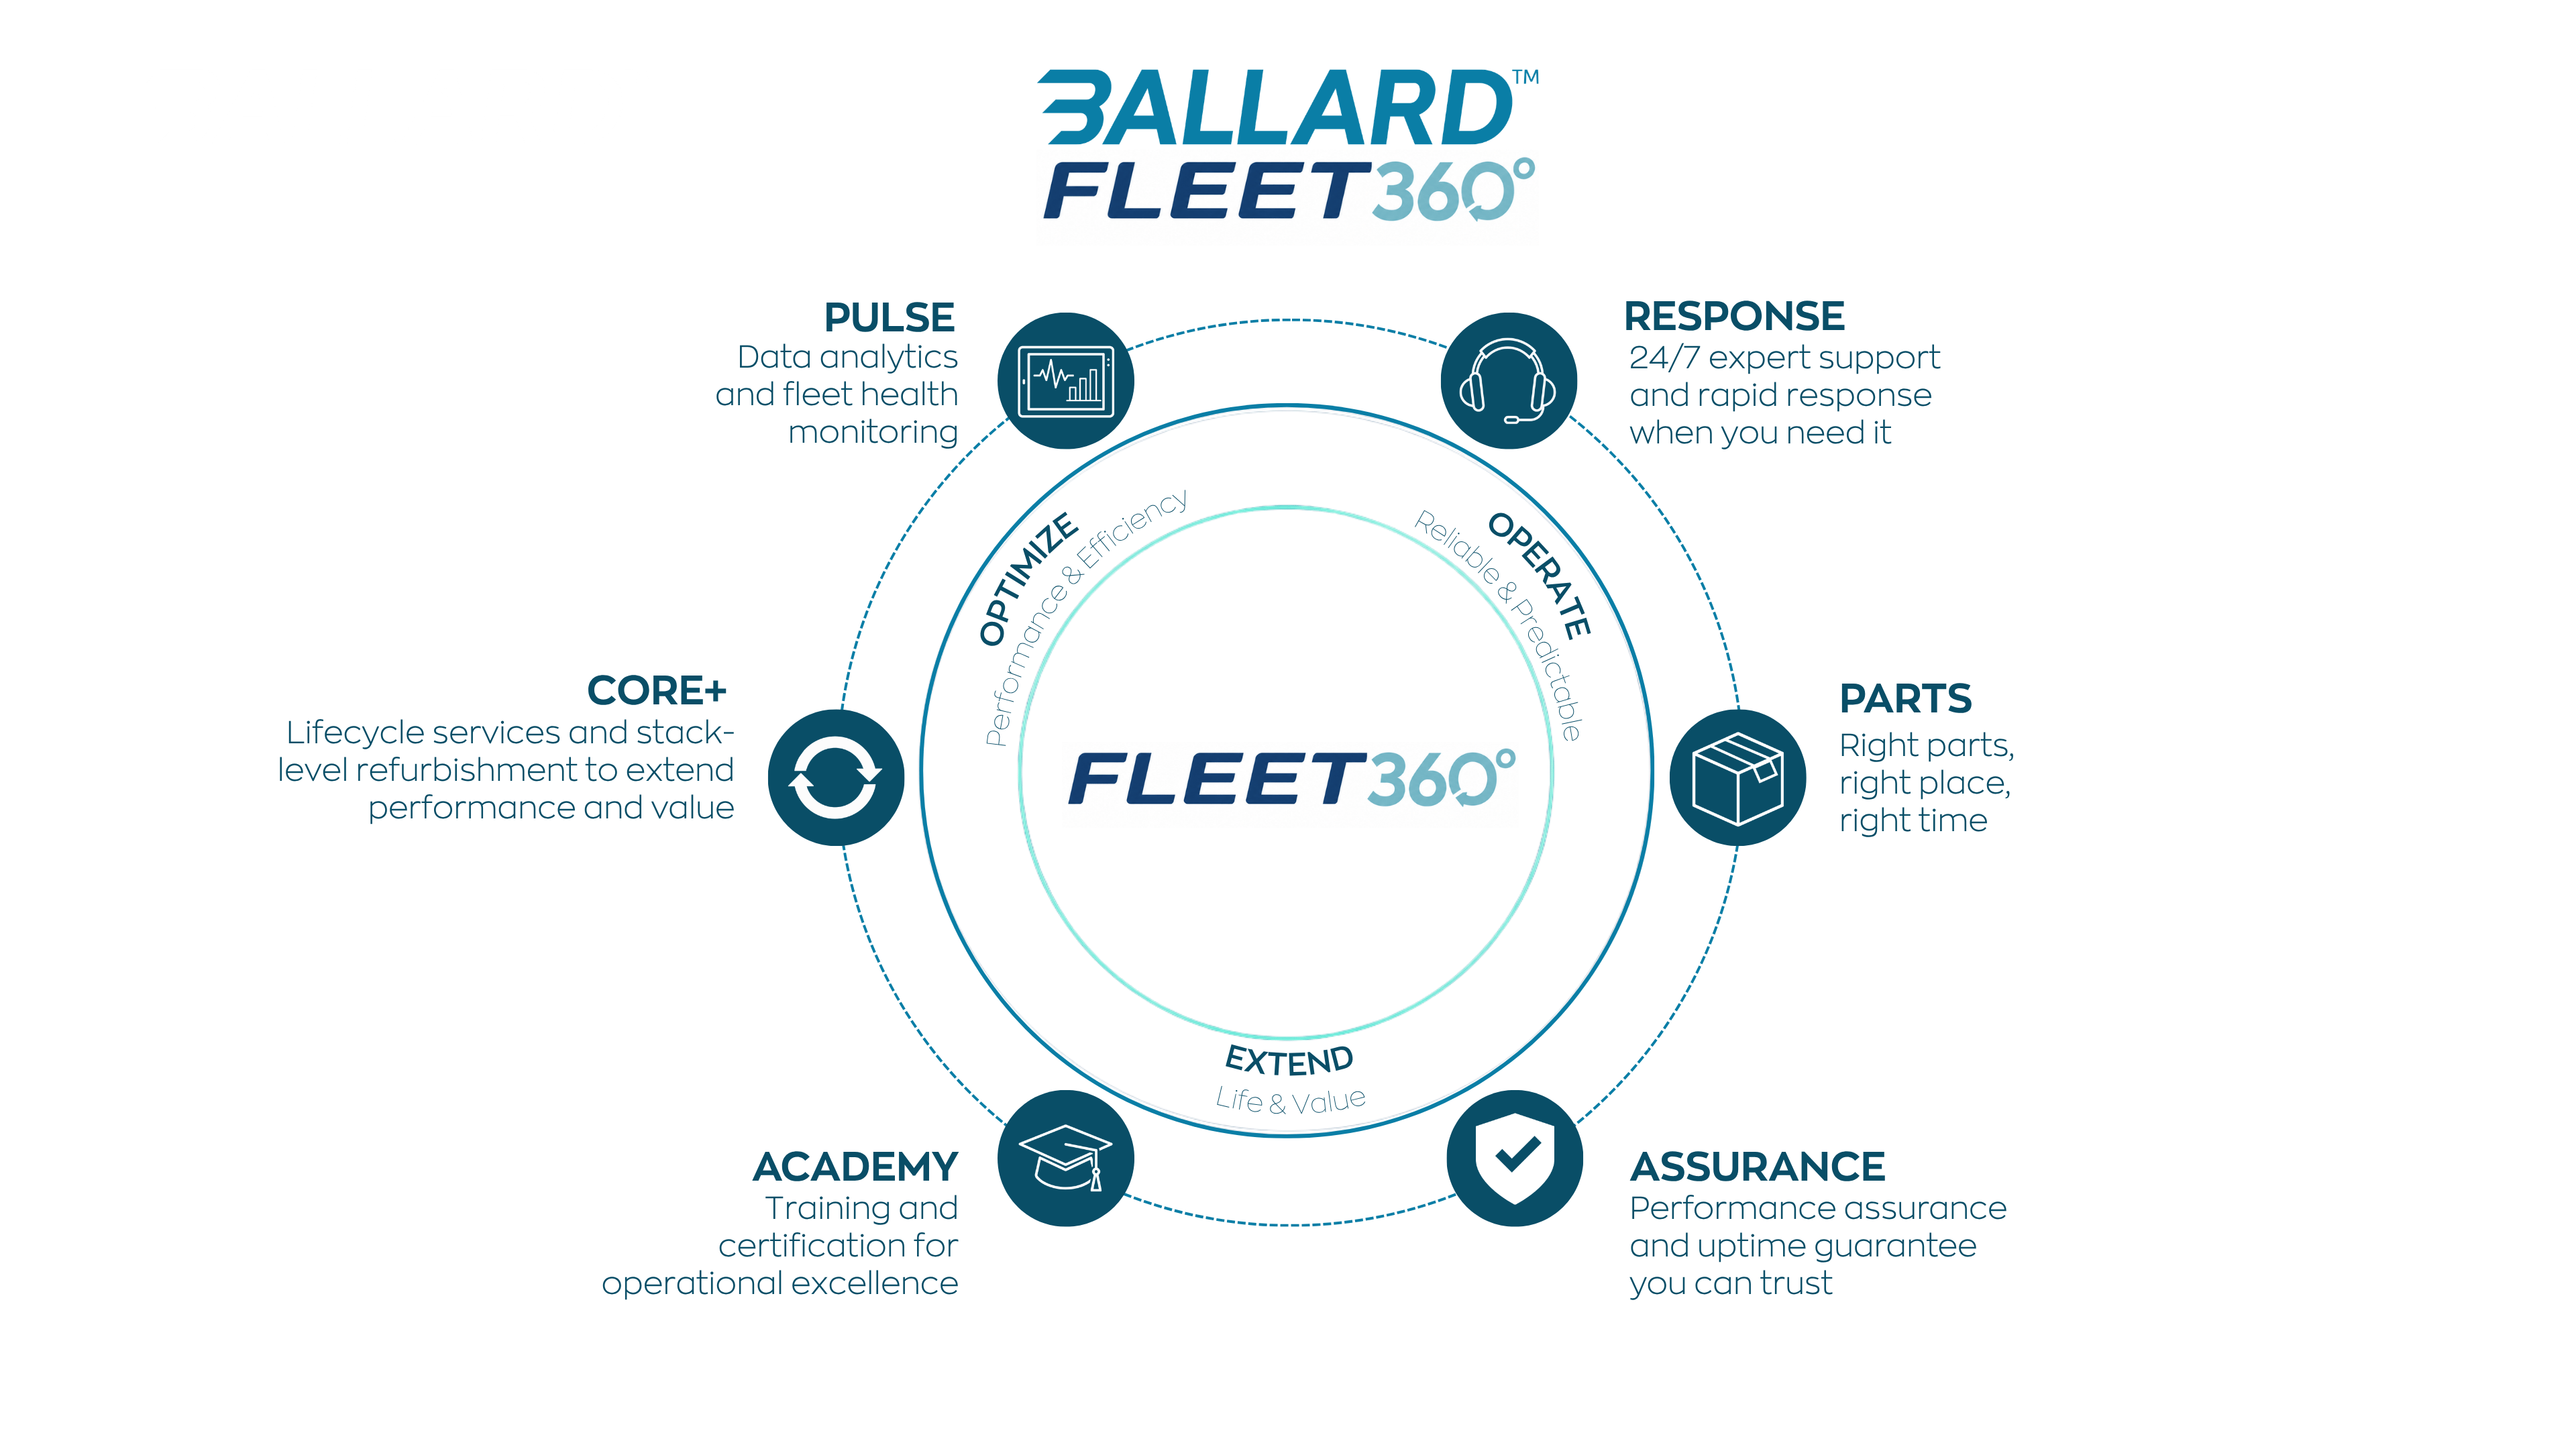
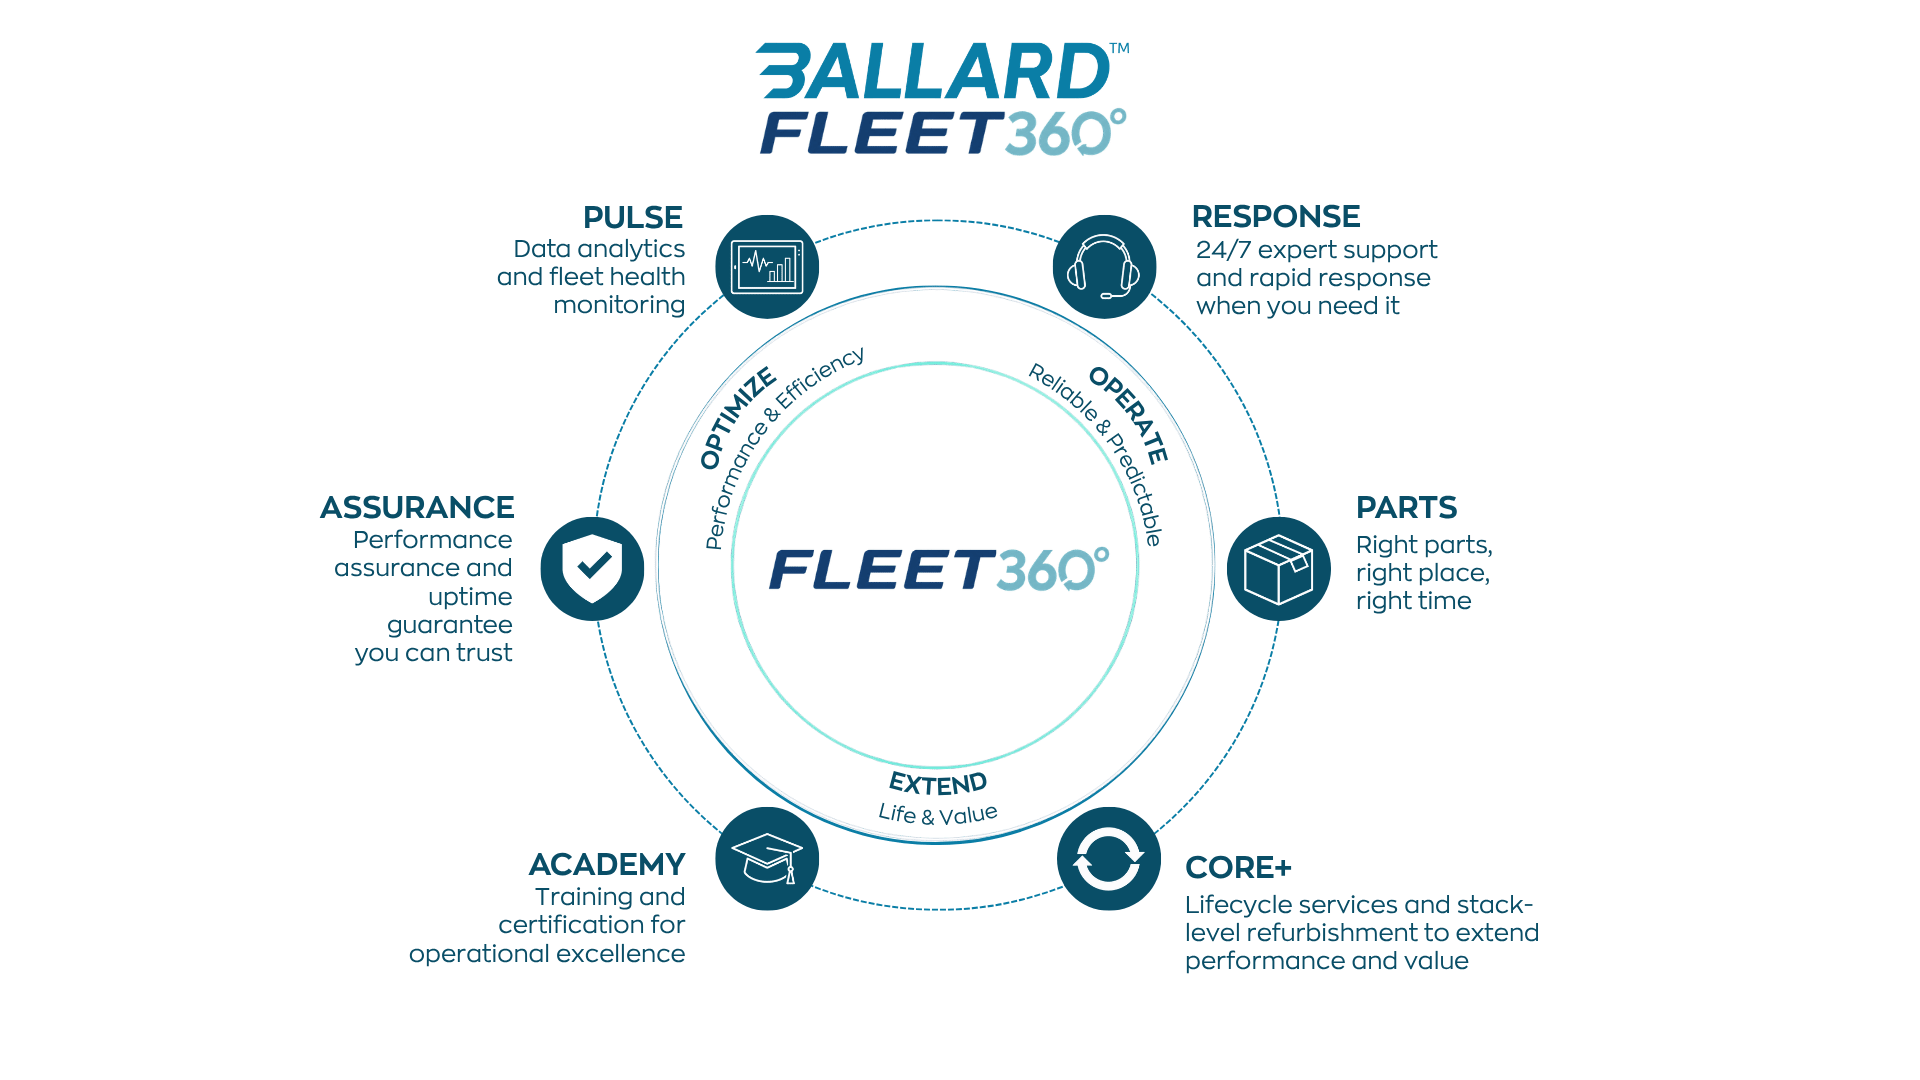
Ballard will also introduce Ballard Fleet360°, a new lifecycle service offering designed to support OEMs and operators in maximizing uptime and lifecycle value of fuel cell fleets. By bringing together remote performance visibility, data analytics, maintenance planning, and access to Ballard's service expertise, Fleet360° is intended to help customers anticipate service needs, reduce unplanned downtime, and manage fleet performance over the vehicle lifecycle.
Together, the FCmove®-XD and Ballard Fleet360° demonstrate Ballard's focus on the complete customer journey - from vehicle integration and deployment to reliable operation throughout the fleet lifecycle.
Informational Materials
Ballard assets
- All
- Videos
- Whitepapers
- Data Sheets
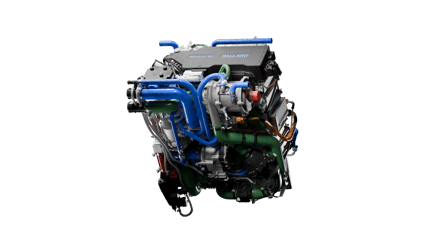
Video: FCmove®-XD 150kW
Watch video
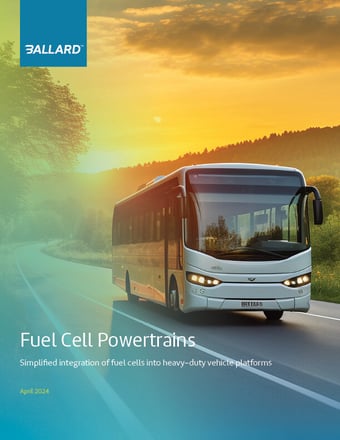
White Paper
Fuel Cell Powertrains: Simplified integrations into heavy-duty vehicles
Download
White Paper
Hydrogen Drives for Long-Haul Trucks: Fuel Cell vs. ICE
Download
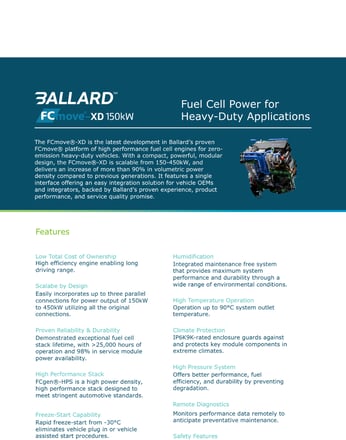
Data Sheet: FCmove®-XD150
Download
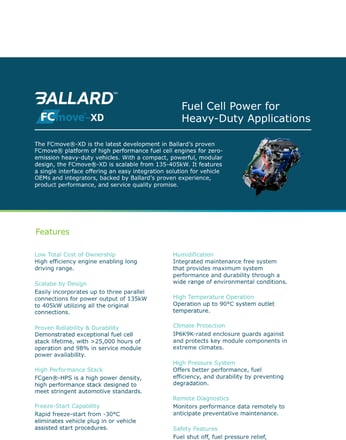
Data Sheet: FCmove®-XD
Download
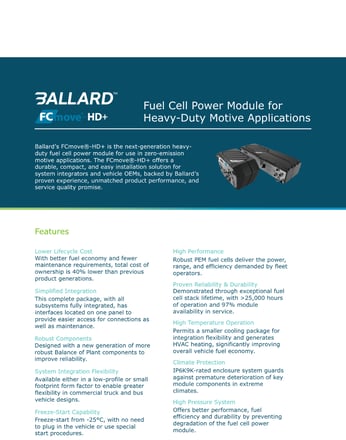
Specsheet: FCgen®-LCS
Download
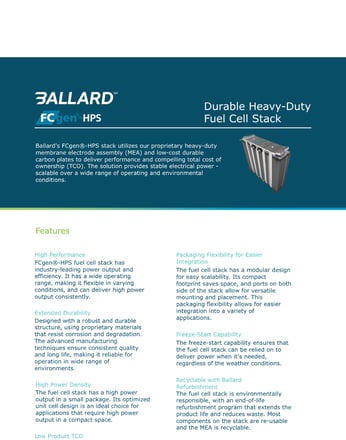
Specsheet: FCgen®-HPS
Download
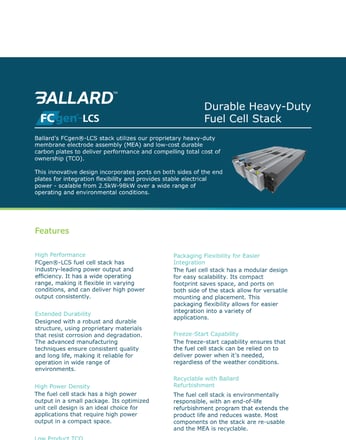
Specsheet: FCgen®-HPS
Download
Image Gallery
High-res images for download
#PoweredByBallard
Applications


× 
Latest Ballard News
See all news

NEWS
TOLL launches hydrogen prime mover trucks in Australia – powered by Ballard
Read more

NEWS
Ballard closes acquisition of GeoPura, becoming an integrated hydrogen energy solutions provider
Read more
NEWS
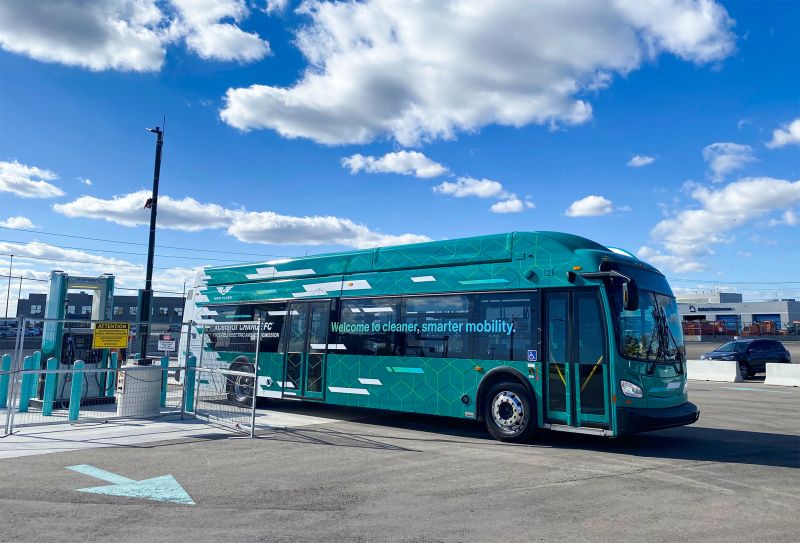
Ballard announces 50MW fuel cell engine agreement with New Flyer
Read more
NEWS
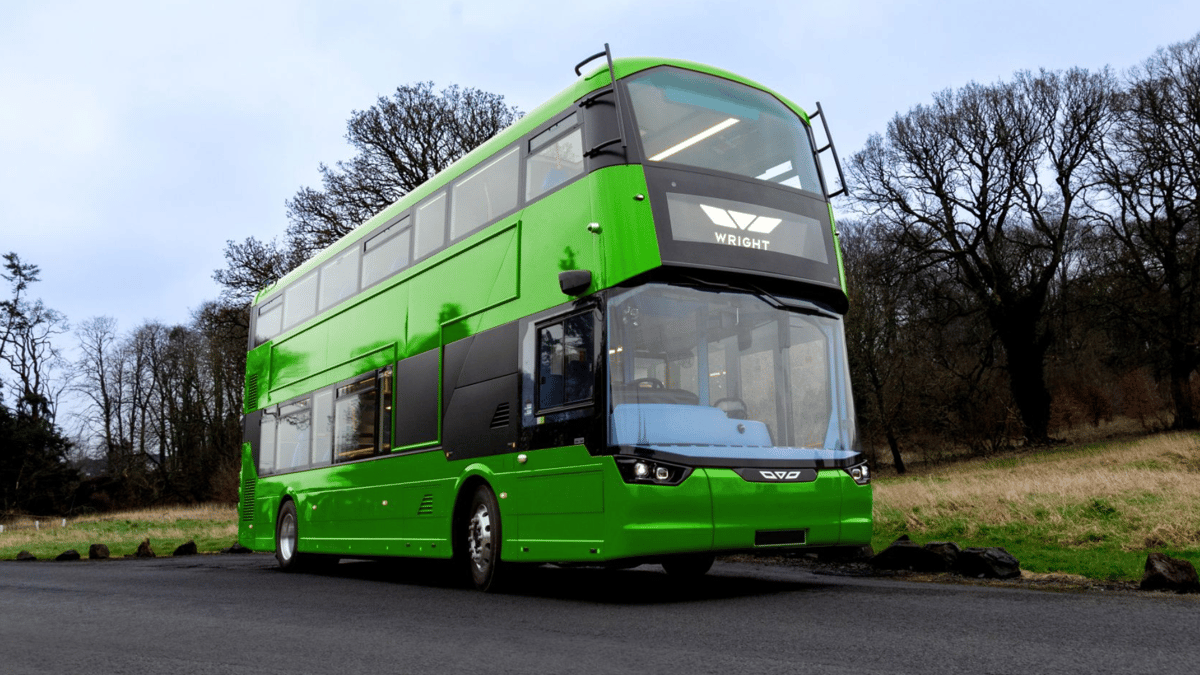
Wrightbus selects Ballard's FCmove®-SC engine to power its next-generation fuel cell bus
Read more
NEWS
Solaris selects Ballard’s FCmove®‑SC engine to power its next‑generation fuel cell bus
Read more


Meet our Team
Oben Uluc
Senior Vice President & Chief Revenue Officer
Mike Byberg
Director, Mobility Sales
Cara Startek
Vice President, Systems Development & PMO
Julien Masson
Account Manager, Sales
Andrew Win
Funding Manager, Sales & Marketing
Media Contact
Jonna Christensen
[email protected]
+44 (0)7833 766461
STAY informed
No spam, notifications only about new products and updates. You can always unsubscribe.
Subscribe


Stay informed
No spam, notifications only about new products and updates. You can always unsubscribe.
Subscribe
Copyright 2025 Ballard Power Systems
We value your privacy
This website stores cookies on your computer. These cookies are used to collect information about how you interact with our website and allow us to remember you. We use this information in order to improve and customize your browsing experience and for analytics and metrics about our visitors both on this website and other media. To find out more about the cookies we use, see our Privacy Policy
.
If you decline, your information won’t be tracked when you visit this website. A single cookie will be used in your browser to remember your preference not to be tracked.
Accept allDecline