Home What is Vitiligo? Test Your Knowledge Sign-up Vitiligo has long been dismissed as cosmetic. The research from the first half of 2026 makes the opposite case — with data on its psychological, professional and physical toll, and early signs of…
Vitiligo has long been dismissed as cosmetic. The research from the first half of 2026 makes the opposite case — with data on its psychological, professional and physical toll, and early signs of real-world change.
For a long time, vitiligo has been treated — by insurers, employers, and sometimes even parts of the medical establishment — as a cosmetic condition: a change in appearance, nothing more. Research published between January and June 2026 makes a different case and backs it with data. Study after study this year measured a condition with real psychological weight, financial cost, and physical risk — and, in places, real institutional recognition starting to catch up to match it.
The burden starts with the condition itself. Five separate studies published this year measured its impact directly — on patients, on their physical health, and on those who care for them.
Psychosocial impact of vitiligo is significant, regardless of disease extent
At the annual Global Vitiligo Foundation’s (GVF) annual scientific symposium in March, Dr Iltefat Hamzavi presented an insightful epidemiological study on non-segmental vitiligo that looked at how body surface area (BSA) correlates with a patient’s lived experience.[1
] Unsurprisingly, the data showed that as we age, the physical footprint of vitiligo tends to expand. The study also confirmed that depigmentation in highly visible areas, such as the face, head, and neck, is what most frequently drives people to seek treatment.
However, the most striking statistic had nothing to do with the skin itself: nearly 48% of the entire patient cohort met the criteria for one or more mental health conditions.
Why this matters: This data proves what many people with vitiligo already know intuitively: the emotional and psychological weight of vitiligo does not depend on the extent of depigmentation. Whether your BSA is 1% or 20%, the burden is deeply felt. This highlights an urgent need for regular mental health screenings and robust emotional support as a standard part of vitiligo care. If you are experiencing this it is worth raising it directly with your care team: ask whether mental health screening is a standard part of your treatment plan, rather than an afterthought.
Additionally, the study noted that roughly 40% of individuals with extensive disease also faced thyroid and cardiometabolic comorbidities, though further research is needed to untangle whether these are directly tied to vitiligo or simply related to ageing. Interestingly, while 80% of study participants were actively pursuing treatment — mostly via topical corticosteroids, topical calcineurin inhibitors, or ruxolitinib — phototherapy remains significantly underutilised.
Non-exposed vitiligo can be just as damaging psychologically as exposed vitiligo
Having vitiligo on exposed areas such as the hands and face can be extremely distressing for individuals. Having a visible skin condition on areas that are difficult to conceal makes people feel exposed, and they can be subjected to stares and comments from others. But what about vitiligo on areas that can be covered? How does that affect an individual’s mental health?
A study in the JEADV asked patients in Korea who had vitiligo affecting only non-exposed areas of the body to complete a number of questionnaires, including the Dermatology Life Quality Index (DLQI) and the Psychosocial Well-being Index Short Form.[2
]The results were surprising: 47% reported a moderate to severe quality of life impairment and 67% were at high-risk stress. Many also reported moderate to severe anxiety and depression. This suggests that the burden of disease among people with vitiligo is high whether or not it is visible.
Why this matters: Focusing on the most visible areas affected by vitiligo can reinforce the notion that this is a cosmetic condition. And while studies have shown that vitiligo on the face, hands, or feet can be more distressing and result in a higher level of stigma, those with non-visible vitiligo should not be dismissed. Every individual’s feelings about their vitiligo are valid, regardless of the extent or location of the areas of depigmentation.
Vitiligo can affect the mental health of caregivers as well as patients
There have been many studies demonstrating the psychosocial impact of vitiligo on the individual themselves, but how does the condition affect their caregivers or families, especially when that the person with vitiligo is a child? A research letter published earlier this year systematically reviewed studies assessing the effect of paediatric vitiligo on caregivers.[3
]
Studies have shown that parents of children with vitiligo report mild depressive and anxiety symptoms. Another study found that having a child with vitiligo affected parent’s sleep, emotional wellbeing and daily functioning. There was also evidence to suggest that parenting a child with vitiligo can have a moderate to high impairment on a caregiver’s quality of life.
While the letter acknowledged the limited number of studies available, and that differing methodologies made direct comparisons difficult, it concluded that there is enough evidence to suggest that caregivers of children with vitiligo do experience a significant mental health burden.
Why this matters: While treating the individual with vitiligo should always be the primary focus, physicians should also be mindful of how the condition may be affecting the wider family, especially when the patient is a child. Where appropriate, support should also be extended to the family.
Vitiligo stigma is costing people (and companies) in the workplace
The psychosocial effects of vitiligo on individuals are well established, but this study looked to assess the effect that the stigma of the condition (whether perceived or enacted) has on work productivity, activity impairment, and the indirect costs among adults with vitiligo in the U.S., UK, Germany, France, Italy, and Spain.[4
]
Of the participants, 73.8% reported mild stigma and 26.2% moderate-to-severe. Interestingly, those who reported higher level of stigma were significantly younger than those reporting mild levels. They had also been living with the condition for a shorter period of time and reported more areas of depigmented skin on the face. This suggests that more visible patches, coupled with less time to adapt to living with the condition, may result in heightened experiences of stigma.
Furthermore, those with moderate-to-severe stigma reported substantially higher impairment at work, compared to their mild-stigma counterparts. This didn’t just affect the individual, but it affected workplaces too, with the moderate-to-severe cohort contributing to an annual indirect cost of over $14,000 compared to the $1,621 of the mild cohort.
Why this matters: This study highlights the real-world implications of vitiligo stigma. It affects the professional lives of people with the condition and carries genuine economic consequences. It reinforces the need for a comprehensive care plan that integrates psychological support and workplace accommodations to mitigate the risk of vitiligo stigma.
If stigma at work is something you’re navigating, this research gives it a name and a number — providing a growing evidence base that HR teams and employers can be pointed to, rather than something you have to manage alone.
People with vitiligo may be more at risk of cardiovascular disease
Many people living with vitiligo may not be aware that the condition is associated with an increased risk of other autoimmune and metabolic disorders. A study published earlier this year sought to assess the extent of these potential comorbidities, and the findings were startling. Adults with vitiligo were found to have an approximately 9%–19% higher relative risk of metabolic and vascular conditions than adults without vitiligo, with the study specifically identifying a higher prevalence of type 2 diabetes and primary hypertension.[5
]
Why this matters: Vitiligo is so much more than just your skin losing its pigment. It can be associated with wider health considerations and people should be aware of the potential complications that can occur. Regular visits with their primary care physician can help identify and monitor cardiovascular risk factors.
Two of this year’s most significant papers didn’t just ask how vitiligo affects people, they asked whether the field is measuring it properly.
Defining severity of vitiligo should no longer be based on clinical factors alone
For decades, the medical community has classified the severity of vitiligo using strict numerical measures: how much pigment has been lost, and and how much of the body is affected. But findings from a new study look to change that rigid framework. Published in JAMA Dermatology in May 2026, the study sought to build a truly international consensus on what “mild”, “moderate”, and “severe” vitiligo actually mean. To define these categories, researchers didn’t just ask doctors, they also consulted specialist nurses, psychologists, patients and caregivers.[6
]
The resulting Vitiligo Severity Algorithm establishes a baseline: mild: <3% body surface area (BSA), moderate: 3% to <10% BSA and severe: >10% BSA or rapidly spreading vitiligo, regardless of BSA.
What makes this algorithm even more important, however, is that it also introduces a pathway to upgrade a person’s vitiligo severity classification. This means that someone with a technically “moderate” classification can be upgraded to “severe” if at least one major criterion or at least two minor criteria are present. The criteria for upgrades are outlined in the table below.
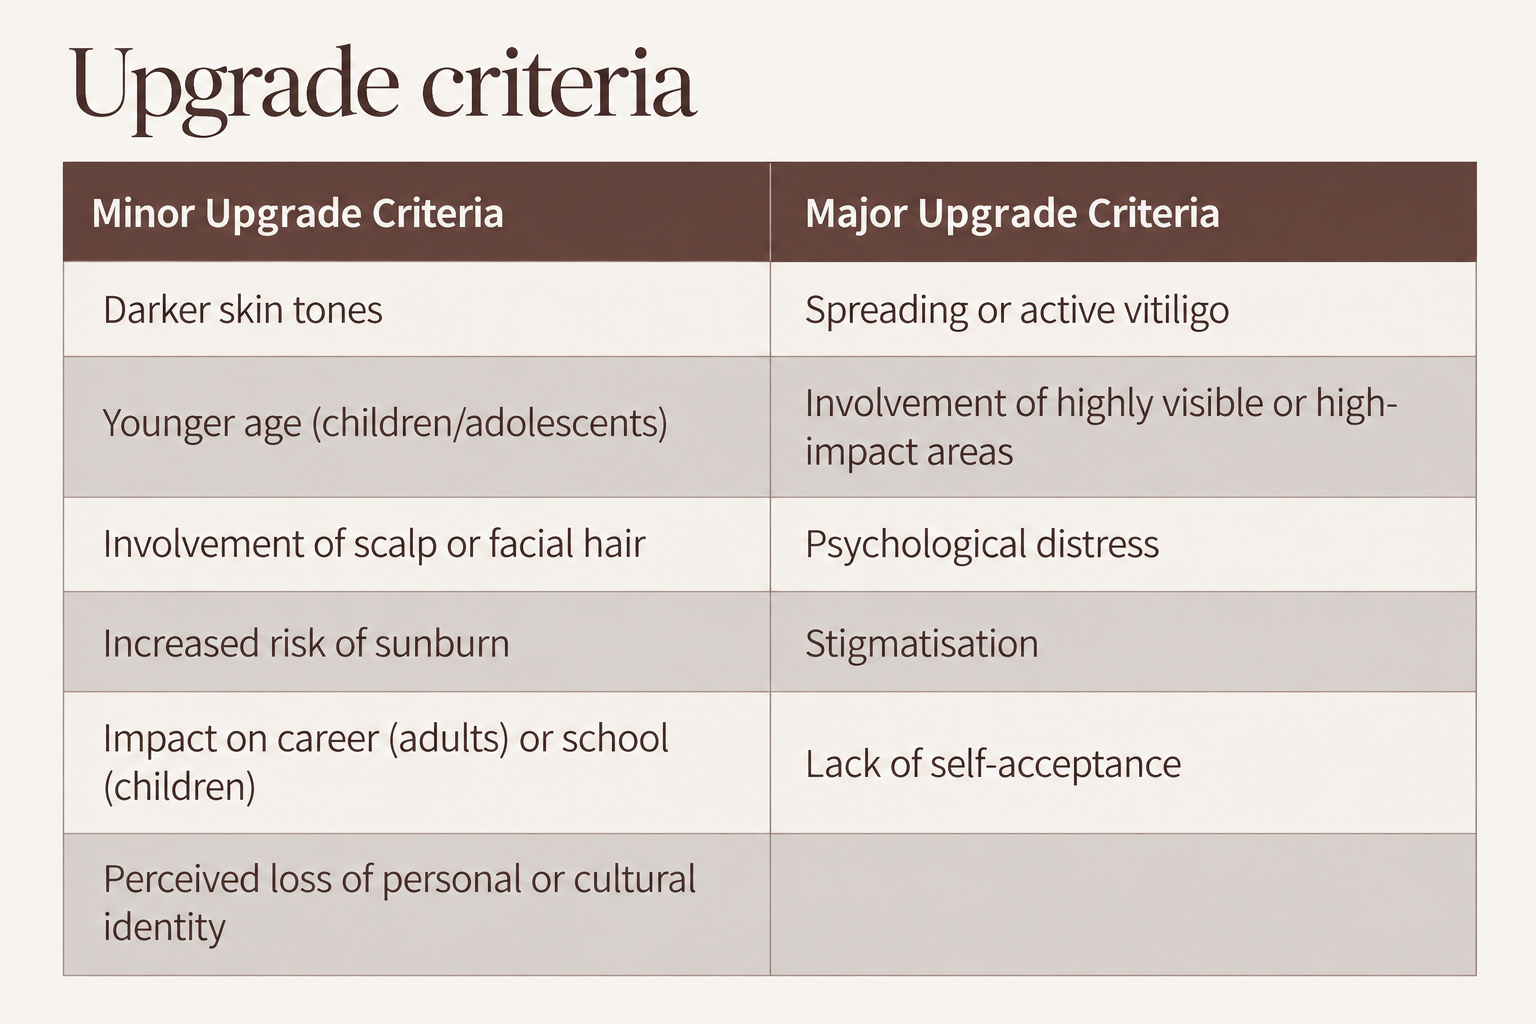
Upgrade criteria for the severity of vitiligo.
When it comes to disease relapse, the study determined relapse as the loss of pigmentation in previously repigmented skin, whether spontaneously or as a result of treatment, within at least three months of stopping treatment. Relapse should also be assessed across multiple domains including patch location and extent, facial/scalp hair involvement, and associated psychological distress.
Why this matters: By taking lived experiences and perceptions into account when measuring severity, physicians can refine treatment pathways and provide a more personalised, patient-centric approach. It can also help identify which individuals may benefit from more systemic treatments over topical treatments where relapse rates are high. The study concludes that every vitiligo patient’s journey is different. Questionnaire scores alone should not determine severity grading; it requires clinical judgement, alongside shared decision-making that reflects each individual’s lived experience. This is the first internationally agreed, patient-informed definition of vitiligo severity and relapse, designed to support trial design, clinical practice and regulatory submissions around the world.
Progress is being made in recognising vitiligo as more than a cosmetic condition, but there is still work to be done!
At the GVF scientific symposium, Dr Victor Huang, MD, shared an encouraging update on the GVF Advocacy Committee’s ongoing work to change the perception of vitiligo as a cosmetic condition, particularly among insurance companies across the U.S. Because many insurers still classify vitiligo as a purely cosmetic issue, countless families are left facing huge out-of-pocket costs for treatments.
With the support of evidence from studies such as the Global VALIANT Study, which documented the significant mental health and quality-of-life burden of the condition, the GVF Advocacy Committee is working to improve coverage throughout the country. Its efforts have resulted in a series of state-level Medicaid coverage approvals in Colorado (Jul 2024), Iowa (Jan 2025), Vermont (Jan 2025), Hawaii (Jul 2025), and most recently, North Dakota and West Virginia (Jan 2026). These are hard-won policy changes that have expanded access to care for families in those states — but the work is not finished. A number of states still have no Medicaid coverage for vitiligo.
The advocacy doesn’t stop there. After a January 2024 coding revision inadvertently restricted excimer phototherapy coverage by limiting its description to ‘psoriasis’, a successful push led by Drs Lebwohl, Grimes, and Huggins restored explicit coverage for inflammatory and autoimmune skin conditions such as vitiligo.
Now, the committee is setting its sights on Washington, lobbying Congress to amend Section 1927(d)(2) of the Social Security Act. Their goal? A federal mandate ensuring vitiligo treatments are legally recognised as medically necessary, stripping away the “cosmetic” label once and for all.
Why this matters: People with vitiligo in the US should be able to access treatment without facing financial hardship. Studies demonstrating the psychosocial impact of the condition have long proven that it is more than just a cosmetic condition, and insurers in all states need to acknowledge this.
We still have a long way to go, but the tide is undeniably turning. Piece by piece, scientific evidence and advocacy are helping to build a world where people with vitiligo are better seen, heard, and supported.
It’s been a busy six months for vitiligo research. Taken together, these studies tell one consistent story: this isn’t a cosmetic condition, and the evidence for that is only getting harder to ignore. The people making decisions about your care, your coverage, and your workplace are starting to catch up with what you’ve long known. That’s something concrete to point to — in a conversation with your doctor, your employer, or your insurer — the next time it matters.
-
- Hamzavi I, Coulter J, Darnell S, Balaji A, Law EH, Kurosky SK, Adiri R, Elbuluk NM, Watt SJ, Hauber B. Treatment priorities and unmet needs according to adults and adolescents with nonsegmental vitiligo in the United States. J Dermatolog Treat. 2026 Dec;37(1):2645479. doi: 10.1080/09546634.2026.2645479. PMID: 41869734.
- Ju HJ, Bang YS, Shin JH, Lee S, Jung JM, Kwon SH, Chung BY, Lee SH, Jeong KH, Bae JM, Kim JE, Lee S, Ryu HJ, Oh SH, Shin J, Kang HY, Chang SE, Lee D, Choi GS. Hidden burden of non-exposed vitiligo: Psychological and quality of life impact in 283 patients. J Eur Acad Dermatol Venereol. 2026 Feb 2. doi: 10.1111/jdv.70339. PMID: 41623219.
- Ju HJ, Seo JM, Kim SH, Bae JM, Lee YB. Quality of Life in Parents of Children and Adolescents with Vitiligo: A Qualitative Study. Ann Dermatol. 2023 Dec;35(6):472-475. doi: 10.5021/ad.22.150.
- Perceived and Enacted Stigma and the Association with Clinical Characteristics, Work Productivity, Activity Impairment, and Indirect Costs in Adults with Vitiligo in the United States and Europe. J of Skin. 2026;10(2):s750. doi:10.25251/qgjbzr67
- Verma KK, Robertson OT, Nguyen KT, Kapur S, Sidhu KS, Goldstein DR, Tarbox MB, Desai SR, Friedmann DP, Ahmed AM. Association of Vitiligo With Metabolic and Cardiovascular Comorbidities: A Multicenter Propensity-Matched Cohort Analysis. Int J Dermatol. 2026 Jul;65(7):1484-1486. doi: 10.1111/ijd.70299.
- Eleftheriadou V, Desai S, Bae JM, et al. Definition of Severity and Relapse for Vitiligo: An International Consensus Statement. JAMA Dermatol. 2026;162(5):515–524. doi:10.1001/jamadermatol.2026.0294
We’ll keep tracking the research that’s reshaping how vitiligo is understood and treated. Sign up below to stay ahead of it.

Sign up to the Vitiligo Hub Newsletter
Email address*
Confirm Email address*
First name*
Last name*
My interest in Vitiligo is*
Please selectPatient with VitiligoCaregiver of someone with VitiligoDermatologistPhysicianGeneral interest
Location*
Please selectArubaAfghanistanAngolaAnguillaÅland IslandsAlbaniaAndorraUnited Arab EmiratesArgentinaArmeniaAmerican SamoaAntarcticaFrench Southern TerritoriesAntigua and BarbudaAustraliaAustriaAzerbaijanBurundiBelgiumBeninBonaire, Sint Eustatius and SabaBurkina FasoBangladeshBulgariaBahrainBahamasBosnia and HerzegovinaSaint BarthélemyBelarusBelizeBermudaBolivia, Plurinational State ofBrazilBarbadosBrunei DarussalamBhutanBouvet IslandBotswanaCentral African RepublicCanadaCocos (Keeling) IslandsSwitzerlandChileChinaCôte d'IvoireCameroonCongo, Democratic Republic of theCongoCook IslandsColombiaComorosCabo VerdeCosta RicaCubaCuraçaoChristmas IslandCayman IslandsCyprusCzechiaGermanyDjiboutiDominicaDenmarkDominican RepublicAlgeriaEcuadorEgyptEritreaWestern SaharaSpainEstoniaEthiopiaFinlandFijiFalkland Islands (Malvinas)FranceFaroe IslandsMicronesia, Federated States ofGabonUnited Kingdom of Great Britain and Northern IrelandGeorgiaGuernseyGhanaGibraltarGuineaGuadeloupeGambiaGuinea-BissauEquatorial GuineaGreeceGrenadaGreenlandGuatemalaFrench GuianaGuamGuyanaHong KongHeard Island and McDonald IslandsHondurasCroatiaHaitiHungaryIndonesiaIsle of ManIndiaBritish Indian Ocean TerritoryIrelandIran, Islamic Republic ofIraqIcelandIsraelItalyJamaicaJerseyJordanJapanKazakhstanKenyaKyrgyzstanCambodiaKiribatiSaint Kitts and NevisKorea, Republic ofKuwaitLao People's Democratic RepublicLebanonLiberiaLibyaSaint LuciaLiechtensteinSri LankaLesothoLithuaniaLuxembourgLatviaMacaoSaint Martin (French part)MoroccoMonacoMoldova, Republic ofMadagascarMaldivesMexicoMarshall IslandsNorth MacedoniaMaliMaltaMyanmarMontenegroMongoliaNorthern Mariana IslandsMozambiqueMauritaniaMontserratMartiniqueMauritiusMalawiMalaysiaMayotteNamibiaNew CaledoniaNigerNorfolk IslandNigeriaNicaraguaNiueNetherlands, Kingdom of theNorwayNepalNauruNew ZealandOmanPakistanPanamaPitcairnPeruPhilippinesPalauPapua New GuineaPolandPuerto RicoKorea, Democratic People's Republic ofPortugalParaguayPalestine, State ofFrench PolynesiaQatarRéunionRomaniaRussian FederationRwandaSaudi ArabiaSudanSenegalSingaporeSouth Georgia and the South Sandwich IslandsSaint Helena, Ascension and Tristan da CunhaSvalbard and Jan MayenSolomon IslandsSierra LeoneEl SalvadorSan MarinoSomaliaSaint Pierre and MiquelonSerbiaSouth SudanSao Tome and PrincipeSurinameSlovakiaSloveniaSwedenEswatiniSint Maarten (Dutch part)SeychellesSyrian Arab RepublicTurks and Caicos IslandsChadTogoThailandTajikistanTokelauTurkmenistanTimor-LesteTongaTrinidad and TobagoTunisiaTürkiyeTuvaluTaiwan, Province of ChinaTanzania, United Republic ofUgandaUkraineUnited States Minor Outlying IslandsUruguayUnited States of AmericaUzbekistanHoly SeeSaint Vincent and the GrenadinesVenezuela, Bolivarian Republic ofVirgin Islands, BritishVirgin Islands, U.S.Viet NamVanuatuWallis and FutunaSamoaYemenSouth AfricaZambiaZimbabwe
By checking this box, you acknowledge and agree that your information will be transferred to Mailchimp and CLINUVEL to process your information in order to provide you the Vitiligo Hub Newsletter. You must check this box in order to subscribe to this newsletter. Learn more about Mailchimp’s privacy practices here.
*
By checking this box, you acknowledge and agree that your information may be used by CLINUVEL and its third party vendors to contact you with information about clinical trial activities and drug development from CLINUVEL, or other information that may benefit you. You may unsubscribe at anytime by clicking the unsubscribe button in the email of these communications or contact us at [email protected]
.
This site is protected by Turnstile and the Cloudflare Turnstile privacy policy
applies.
+ Newsletter Signup
+ Contact
+ FAQs
+ Glossary
+ Disclaimer
+ Privacy Policy
+ Cookie Policy
© CLINUVEL PHARMACEUTICALS LTD 2026 All rights reserved.
To report suspected adverse reactions, contact CLINUVEL via [email protected]
or (US only) the FDA at 1-800-FDA-1088 or www.fda.gov/medwatch
.
Go To Top