Zimmer Biomet Announces Fourth Quarter and Full-Year 2025 Financial Results •Fourth quarter net sales of $2.244 billion increased 10.9% on a reported basis, 9.2% on a constant currency 1 basis and 5.4% on an organic constant currency 1 basis…
Zimmer Biomet Announces
Fourth Quarter and Full-Year 2025 Financial Results
•Fourth quarter net sales of $2.244 billion increased 10.9% on a reported basis, 9.2% on a
constant currency
1
basis and 5.4% on an organic constant currency
1
basis
•Fourth quarter diluted earnings per share were $0.70, a decrease of 41.7%; adjusted
1
diluted
earnings per share were $2.42, an increase of 4.8%
•Full-year net sales of $8.232 billion increased 7.2% on a reported basis, 6.4% on a constant
currency
1
basis and 3.9% on an organic constant currency
1
basis
•Full-year diluted earnings per share were $3.55, a decrease of 19.9%; adjusted
1
diluted earnings
per share were $8.20, an increase of 2.5%
•Company provides full-year 2026 financial guidance
(WARSAW, IN)February 10, 2026—Zimmer Biomet Holdings, Inc. (NYSE and SIX: ZBH) today
reported financial results for the quarter and year ended December 31, 2025. The Company reported
fourth quarter net sales of $2.244 billion, an increase of 10.9% over the prior year period, an increase of
9.2% on a constant currency
1
basis and an increase of 5.4% on an organic constant currency
1
basis. Net
sales for the full year were $8.232 billion, an increase of 7.2% over the prior year, an increase of 6.4% on
a constant currency
1
basis and an increase of 3.9% on an organic constant currency
1
basis. Net earnings
for the fourth quarter were $139.3 million, or $479.7 million on an adjusted
1
basis. For the full year, net
earnings were $705.1 million, or $1.629 billion on an adjusted
1
basis.
Page2 of 25
Diluted earnings per share were $0.70 for the fourth quarter, a decrease of 41.7%, andadjusted
1
diluted
earnings per share were $2.42, an increase of 4.8%. Full-year diluted earnings per share were $3.55, a
decrease of 19.9%, and adjusted
1
diluted earnings per share were $8.20, an increase of 2.5%. Zimmer
Biomet generated $1.697 billion in operating cash flow and $1.172 billion of free cash flow for the year.
Additionally, on February 9, 2026, Zimmer Biomet's Board of Directors approved a new stock repurchase
authorization, granting the Company authority to repurchase up to $1.5 billion in common stock. The new
authorization commences on February 9, 2026 and has no expiration date. Under the program, which is
designed to return value to Zimmer Biomet's shareholders and minimize dilution from stock issuances,
the Company may repurchase shares in the open market and enter into structured repurchase
agreements with third parties.
"We made significant strategic and financial progress in 2025, delivering on our initial revenue growth,
EPS and free cash flow commitments and integrating three acquisitions, all while navigating tariff
headwinds,”said Ivan Tornos, Chairman, President and CEO of Zimmer Biomet.“Weclosed the year
strong with meaningful revenue acceleration and two consecutive quarters of mid-single digit organic
growth fueled by our new product innovation cycle. As we enter 2026, we are excited about our transition
to a predominantly direct and specialized sales organization in the U.S. While this bold action tempers
our 2026 sales guidance, we are confident that it will drive durable long-term growth and solidify our
position as the undisputed market leader. Against this backdrop, we are committed to delivering EPS and
free cash flow growth while continuing to return capital to shareholders in a meaningful way."
Recent Highlights
•Completed $250 million of share repurchases during the fourth quarter of fiscal 2025.
•Received board authorization to repurchase up to $1.5 billion in shares.
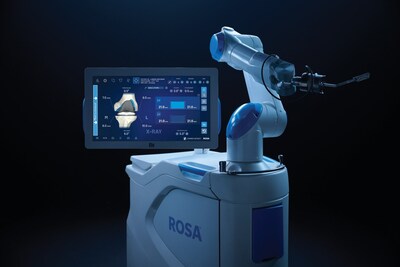
•ReceivedU.S. FDA clearance for ROSA
®
Knee with OptimiZe
TM
, the most advanced upgrade
to theCompany’sflagship robotic knee system since its launch in 2019.
•Enabled theworld’sfirst iodine-treated hip procedure to be performed in Japanusing
iTaperloc
®
Complete and iG7
™
Acetabular Hip Systems to address infection management by
inhibiting biofilm formation.
•LaunchedBrachiator™Mini-Rail External Fixation Systemthrough Paragon 28 subsidiary to
address complex, small bone reconstruction in the foot and ankle.
•Announced two new mymobility
®
data analytics collaborations: (1)OneStep to improve
mobility data capture through smartphones; and (2)PatientIQ to seamlessly integrate
orthopedic recovery data and patient reported outcomes in electronic health records.
Page3 of 25
•Named toForbes’2026 list ofAmerica’sBest Companies, honoring organizations that lead the
way in corporate trust, innovation, customer sentiment, employee satisfaction and workplace
culture.
1
Reconciliations of these measures to the corresponding U.S. generally accepted accounting principles
measures are included in this press release.
Page4 of 25
Geographic and Product Category Sales
The following sales tables provide results by geography and product category for the three-month period
and year ended December 31, 2025, as well as the percentage change compared to the applicable prior
year period, on both a reported basis and a constant currency basis. Percentage change is also
presented on an organic constant currency basis to exclude the impact on net sales from the April 2025
acquisition of Paragon 28, Inc. ("Paragon 28").
NET SALES - THREE MONTHS ENDED DECEMBER 31, 2025
(in millions, unaudited)
Organic
ConstantConstant
NetCurrencyCurrency
Sales% Change% Change% Change
Geographic Results
United States$1,312.611.1%11.1%5.7%
International931.210.66.65.0
Total$2,243.810.9%9.2%5.4%
Product Categories
Knees
United States$519.66.0%6.0%6.0%
International391.412.18.28.2
Total911.08.66.96.9
Hips
United States293.27.97.97.9
International262.25.61.61.6
Total555.46.84.94.9
S.E.T. *587.620.118.72.9
Technology & Data, Bone Cement and
Surgical189.88.76.66.6
Total$2,243.810.9%9.2%5.4%
- Sports Medicine, Extremities, Trauma, Craniomaxillofacial and Thoracic
Page5 of 25
NET SALES - YEAR ENDED DECEMBER 31, 2025
(in millions, unaudited)
Organic
ConstantConstant
NetCurrencyCurrency
Sales% Change% Change% Change
Geographic Results
United States$4,764.07.3%7.3%3.7%
International3,467.57.05.24.1
Total$8,231.57.2%6.4%3.9%
Product Categories
Knees
United States$1,867.52.9%2.9%2.9%
International1,454.87.15.55.5
Total3,322.34.74.04.0
Hips
United States1,094.65.35.35.3
International998.84.12.22.2
Total2,093.54.73.83.8
S.E.T. *2,150.215.214.64.1
Technology & Data, Bone Cement and
Surgical665.64.02.92.9
Total$8,231.57.2%6.4%3.9%
- Sports Medicine, Extremities, Trauma, Craniomaxillofacial and Thoracic
Amounts reported in millions are computed based on the actual amounts. As a result, the sum of the
components reported in millions may not equal the total amount reported in millions due to rounding.
Percentages presented are calculated from the underlying unrounded amounts.
Page6 of 25
Financial Guidance
The Company is providing the following full-year 2026 financial guidance:
Projected Year Ending December 31, 2026
2026 Reported Revenue Change2.5% - 4.5%
Foreign Currency Exchange Impact+0.50%
2026 Constant Currency Revenue Change2.0% - 4.0%
2026 Organic Constant Currency Revenue Change
(1)
1.0% - 3.0%
Adjusted Diluted EPS
(2)
$8.30 - $8.45
(1)
Excludes the projected impact of the Paragon 28 acquisition through the one-year anniversary of the
acquisition date, which is estimated to be approximately 100bps.
(2)
This measure is a non-GAAP financial measure for which a reconciliation to the most directly
comparable GAAP financial measure is not available without unreasonable efforts. See“Forward-
Looking Non-GAAP FinancialMeasures”below, which identifies the information that is unavailable
without unreasonable efforts and provides additional information. It is probable that this forward-
looking non-GAAP financial measure may be materially different from the corresponding GAAP
financial measure.
Conference Call
The Company will conduct its fourth quarter and full-year 2025 investor conference call today, February
10, 2026, at 8:30 a.m. ET. The audio webcast can be accessed via Zimmer Biomet's Investor Relations
website athttps://investor.zimmerbiomet.com. It will be archived for replay following the conference call.
About the Company
Zimmer Biomet is a global medical technology leader with a comprehensive portfolio designed to
maximize mobility and improve health. We seamlessly transform the patient experience through our
innovative products and suite of integrated digital and robotic technologies that leverage data, data
analytics and artificial intelligence.
With 90+ years of trusted leadership and proven expertise, Zimmer Biomet is positioned to deliver the
highest quality solutions to patients and providers. Our legacy continues to come to life today through our
progressive culture of evolution and innovation.
For more information about our product portfolio, our operations in 25+ countries and sales in 100+
countries or about joining our team, visitwww.zimmerbiomet.comor follow on LinkedIn at
www.linkedin.com/company/zimmerbiometor X / Twitter atwww.x.com/zimmerbiomet.
Page7 of 25
Website Information
We routinely post important information for investors on our website,www.zimmerbiomet.com, in the
“InvestorRelations”section. We use this website as a means of disclosing material, non-public
information and for complying with our disclosure obligations under Regulation FD. Accordingly,
investors should monitor the Investor Relations section of our website, in addition to following our press
releases, SEC filings, public conference calls, presentations and webcasts.
The information contained on, or that may be accessed through, our website or any other website
referenced herein is not incorporated by reference into, and is not a part of, this document.
Note on Non-GAAP Financial Measures
This press release and our commentary in our investor conference call today include non-GAAP financial
measures that differ from financial measures calculated in accordance with U.S. generally accepted
accounting principles(“GAAP”).These non-GAAP financial measures may not be comparable to similar
measures reported by other companies and should be considered in addition to, and not as a substitute
for, or superior to, other measures prepared in accordance with GAAP.
Net sales change information for the three-month period and year ended December 31, 2025 is
presented on a GAAP (reported) basis and on a constant currency basis. Net sales change for those
periods is also presented on an organic constant currency basis to exclude the impact on net sales from
the April 2025 acquisition of Paragon 28. Constant currency percentage changes exclude the effects of
foreign currency exchange rates. They are calculated by translating current and prior-period sales at the
same predetermined exchange rate. The translated results are then used to determine year-over-year
percentage increases or decreases. Projected revenue change information for the year ending
December 31, 2026, is also presented on an organic constant currency basis. In addition to excluding the
projected effects of foreign currency exchange rates, projected 2026 organic constant currency revenue
change also excludes the projected impact on net sales from the April 2025 acquisition of Paragon 28
through the one-year anniversary of the acquisition date in April 2026.
Net earnings and diluted earnings per share for the three-month periods and years ended December 31,
2025 and 2024 are presented on a GAAP (reported) basis and on an adjusted basis. These adjusted
financial measures exclude the effects of certain items, which are detailed in the reconciliations of these
non-GAAP financial measures to the most directly comparable GAAP financial measures presented later
in the press release.
Free cash flow is an additional non-GAAP measure that is presented in this press release. Free cash
flow is computed by deducting additions to instruments and other property, plant and equipment from net
cash provided by operating activities.
Page8 of 25
Reconciliations of these non-GAAP financial measures to the most directly comparable GAAP financial
measures are included in this press release. This press release also contains supplemental
reconciliations of additional non-GAAP financial measures that the Company presents in other contexts.
These additional non-GAAP financial measures are computed from the most directly comparable GAAP
financial measure as indicated in the applicable reconciliation.
Management uses non-GAAP financial measures internally to evaluate the performance of the business.
Additionally, management believes these non-GAAP measures provide meaningful incremental
information to investors to consider when evaluating the performance of the Company. Management
believes these measures offer the ability to make period-to-period comparisons that are not impacted by
certain items that can cause dramatic changes in reported income but that do not impact the
fundamentals of our operations. The non-GAAP measures enable the evaluation of operating results and
trend analysis by allowing a reader to better identify operating trends that may otherwise be masked or
distorted by these types of items that are excluded from the non-GAAP measures. In addition, constant
currency revenue change, adjusted operating profit, adjusted diluted earnings per share and free cash
flow are used as performance metrics in our incentive compensation programs.
Forward-Looking Non-GAAP Financial Measures
This press release and our commentary in our investor conference call today also include certain forward-
looking non-GAAP financial measures for the year ending December 31, 2026. We calculate forward-
looking non-GAAP financial measures based on internal forecasts that omit certain amounts that would
be included in GAAP financial measures. For instance, we exclude the impact of restructuring and other
cost reduction initiatives; acquisition, integration, divestiture and related; and certain legal and tax
matters. We have not provided quantitative reconciliations of these forward-looking non-GAAP financial
measures (other than projected 2026 organic constant currency revenue change) to the most directly
comparable forward-looking GAAP financial measures because the excluded items are not available on a
prospective basis without unreasonable efforts. For example, the timing of certain transactions is difficult