As previously reported by The Western Union Company (the “Company”), in the Current Report on Form 8-K filed with the Securities and Exchange Commission (the “SEC”) on June 28, 2024, the Company entered into a delayed draw term loan credit agreement, dated as of June 25, 2024, with the lenders party thereto and Bank of America, N.A., as administrative agent (the “2024 Term Loan Agreement”). The material terms of the 2024 Term Loan Agreement are described in such Current Report and are incorporated herein by reference. The information set forth in Item 2.03 below regarding the 2024 Term Loan Agreement is incorporated herein by reference. The 2024 Term Loan Agreement will terminate upon the repayment described in Item 2.03 below, which the Company expects to occur on or about November 17, 2026. The Company will not incur any material early termination penalties in connection with such repayment and termination.
|
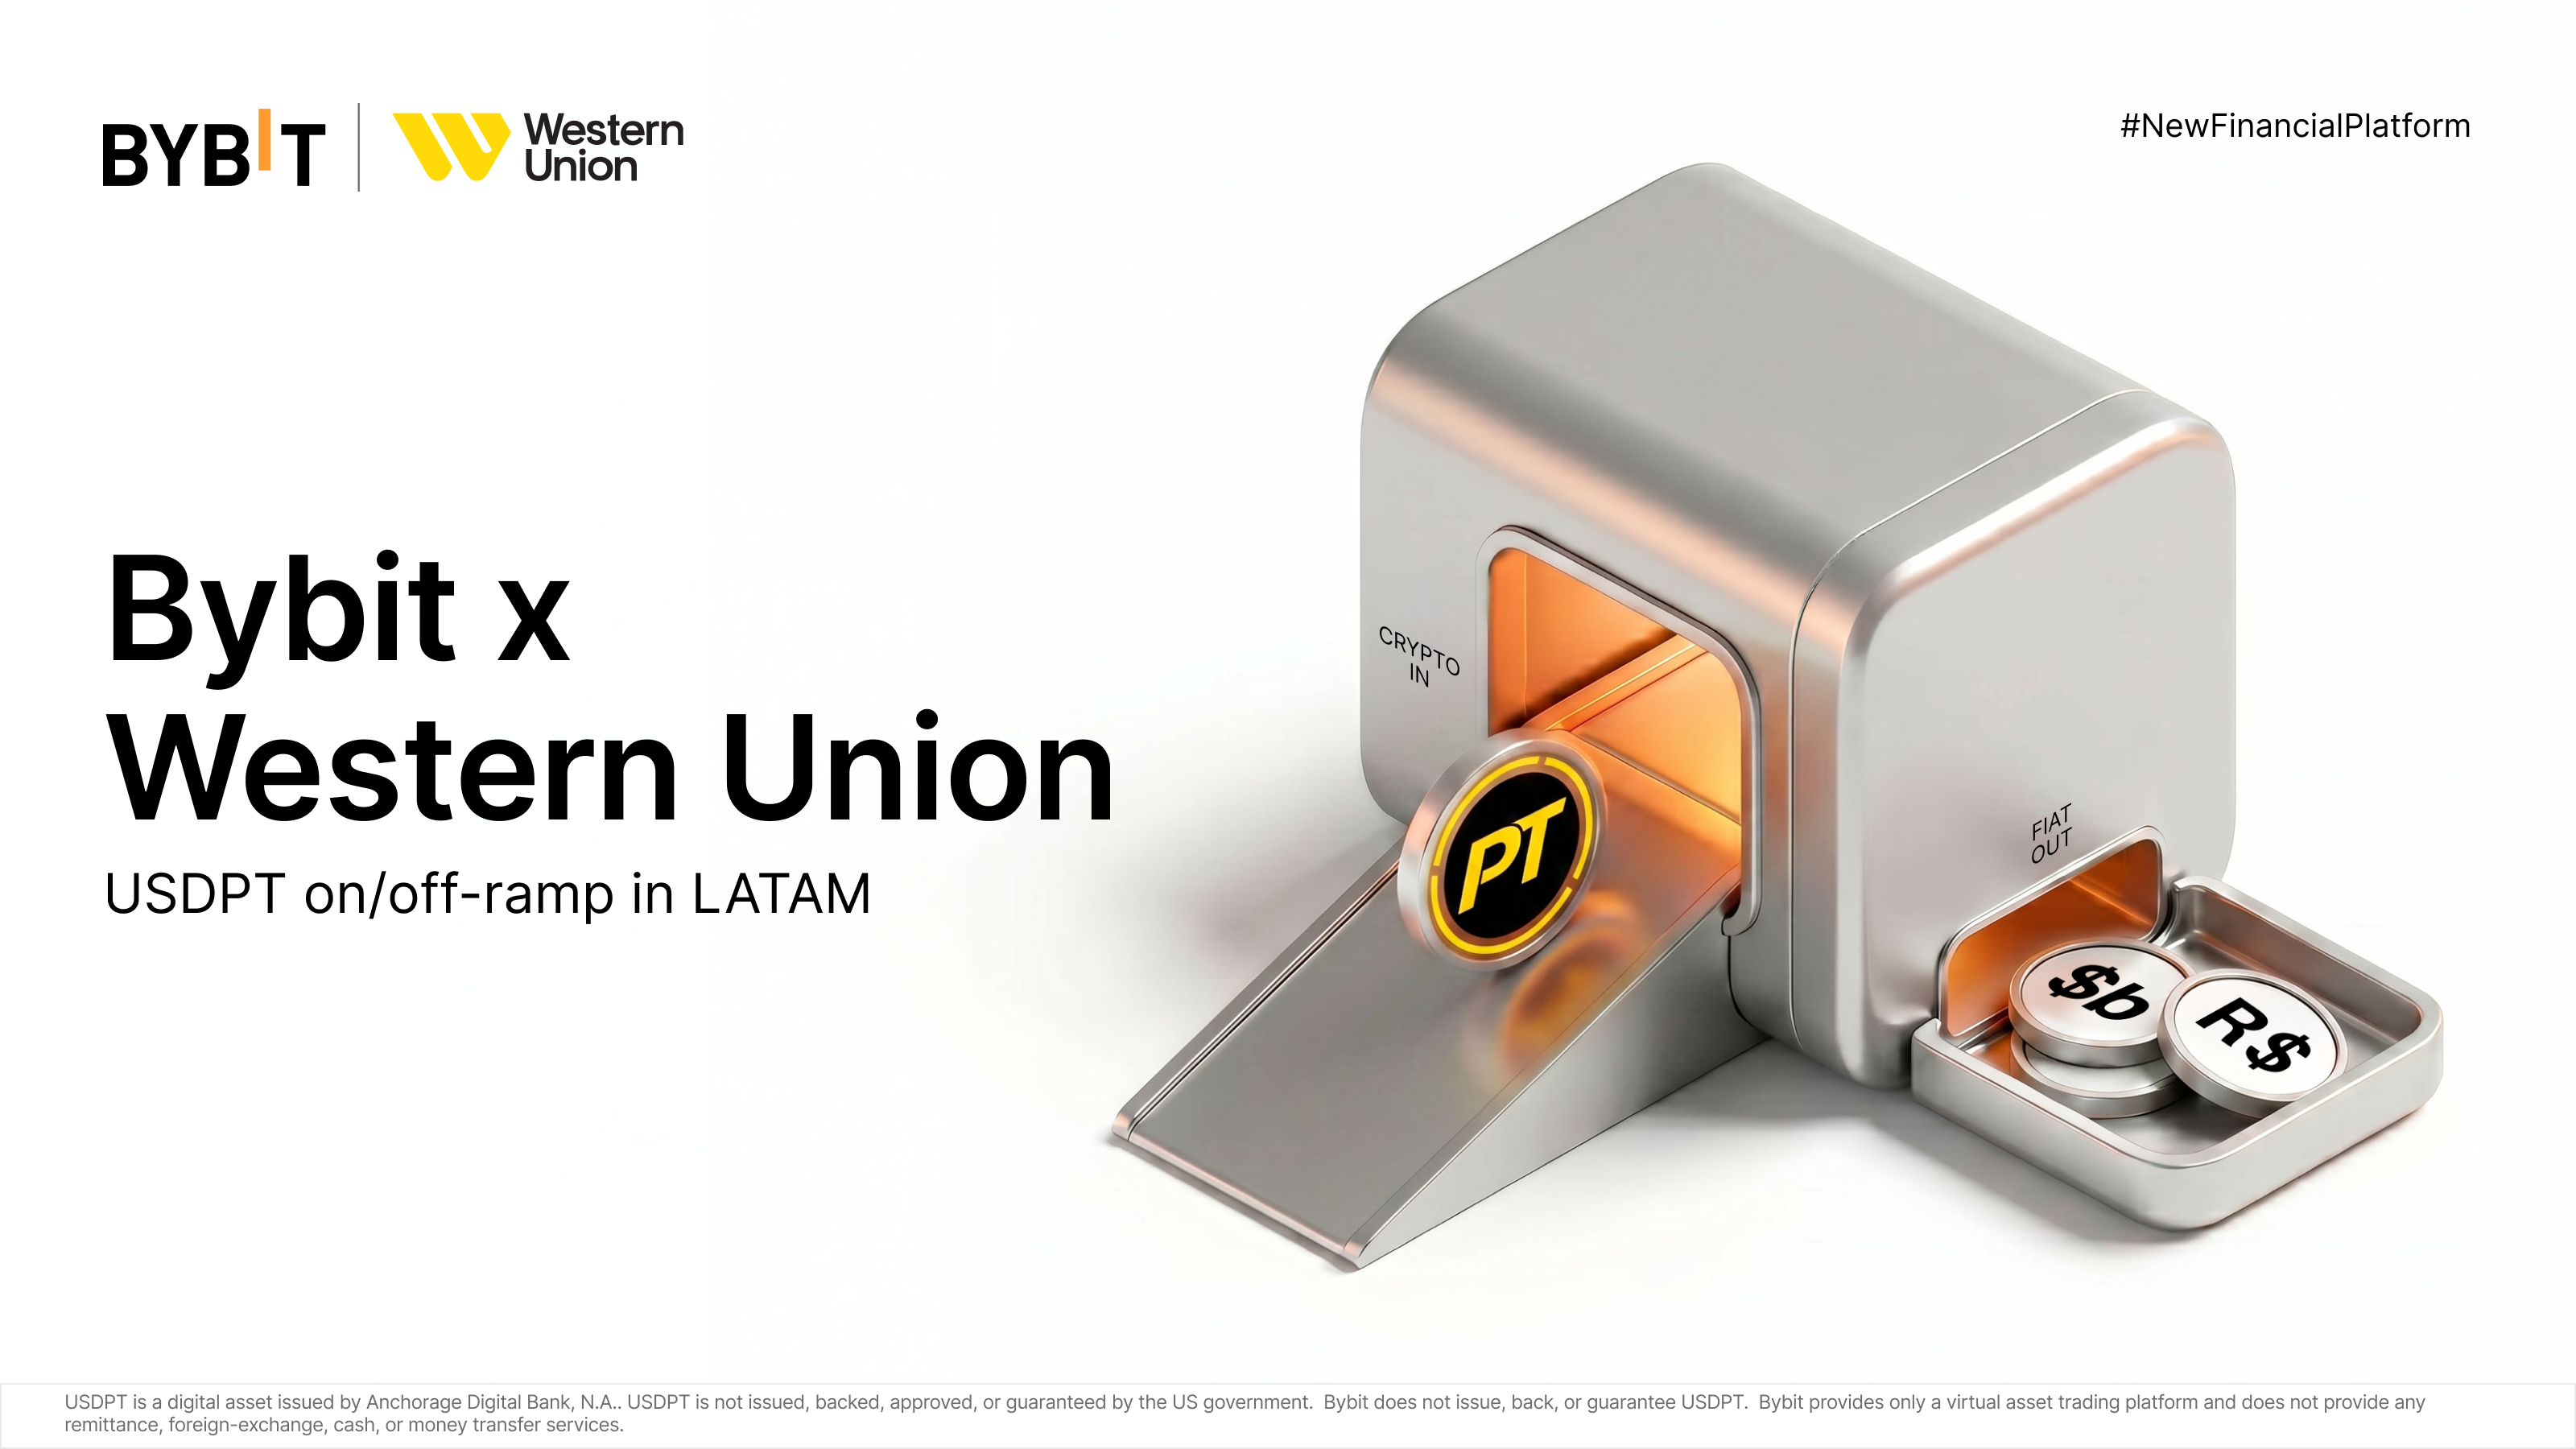
The Western Union Company is a global provider of cross-border money movement, payments, and digital financial services. The company operates through two primary segments: Consumer Money Transfer and Consumer Services. Consumer Money Transfer involves facilitating peer-to-peer remittances via a global network of retail agent locations, company-operated stores, websites, and mobile applications. Consumer Services includes bill payment, money orders, travel money, check acceptance, prepaid cards, lending partnerships, and digital wallets. The company serves consumers, businesses, financial institutions, and governments worldwide. In 2025, the company announced the launch of the U.S. Dollar Payment Token (USDPT), a stablecoin issued on the Solana blockchain by Anchorage Digital Bank, and a Digital Asset Network integrating with licensed cryptocurrency exchanges. The company also agreed to acquire International Money Express, Inc. (Intermex), an omnichannel money transfer provider focused on U.S. to Latin America and Caribbean corridors. Western Union’s strategy emphasizes expanding digital channels, including digital wallets and consumer financial services, alongside its physical agent network. Summarised from the company's own disclosures, fiscal year ended Feb 2026 |
Industry Financial Data & Stock Exchanges | Homepage westernunion.com |
| Sector Financial Services | IR page ir.westernunion.com | |
|
Tags
money transfer, remittances, digital wallets, stablecoins, bill payment, prepaid cards, cross-border payments, financial services, Western Union, Intermex, International Money Express Inc., USDPT, U.S. Dollar Payment Token, Anchorage Digital Bank, Solana, Digital Asset Network
|
Press page — |
Metrics
| Valuation | |
|---|---|
| Market cap | $ 1.841B |
| Market cap (USD) | $ 1.841B |
| P/E | 5.62 |
| PEG | — |
| P/BV | 2.07 |
| P/S | 0.48 |
| P/OCF | 4.03 |
| P/FCF | 4.46 |
| Dividend yield | 15.9% |
| Turnover / mcap | — |
| Returns | |
|---|---|
| ROE | 51.9% |
| ROI | 11.7% |
| ROIC | 14.1% |
| Profit margin | 12.9% |
| Growth | |
|---|---|
| Revenue growing | No |
| Profits growing | No |
| Revenue up 3y | No |
| Revenue up 5y | No |
| Earnings growth 3y (net profit CAGR) | -18.1% |
| Quality | |
|---|---|
| Profitable | Yes |
| Margin expanding | No |
| Buying back stock | Yes |
| Diluting (TTM) | No |
| Debt/Equity | 280.8% |
| Podcast bulls (TTM) | Sign up |
| Podcast bears (TTM) | Sign up |
| Podcast sentiment (TTM) | Sign up |
| Podcast sentiment % (TTM) | Sign up |
| News sentiment (TTM) | 7 |
| Quality score | 21.1% |
| Insiders | |
|---|---|
| Buys, 1w | Sign up |
| Buys, 1m | Sign up |
| Buys, 1y | Sign up |
| Sells, 1w | Sign up |
| Sells, 1m | Sign up |
| Sells, 1y | Sign up |
Sign up to see this company's insider trades
| Figure | FY 2025 | FY 2024 | FY 2023 | FY 2022 | FY 2021 | FY 2020 | FY 2019 | FY 2018 | FY 2017 | FY 2016 | FY 2015 | FY 2014 | FY 2013 | FY 2012 | FY 2011 | FY 2010 | FY 2009 | FY 2008 | FY 2007 | FY 2006 | FY 2005 |
|---|---|---|---|---|---|---|---|---|---|---|---|---|---|---|---|---|---|---|---|---|---|
| Revenue | 3.88B | 4.027B | 4.158B | 4.254B | 4.866B | 4.625B | 5.033B | 5.383B | 5.524B | 5.423B | 5.484B | 5.607B | 5.542B | 5.665B | 5.491B | 5.193B | 5.084B | 5.282B | 4.9B | 4.47B | 3.988B |
| Net profit | 499.6M | 934.2M | 626M | 910.6M | 805.8M | 744.3M | 1.058B | 851.9M | -557.1M | 253.2M | 837.8M | 852.4M | 798.4M | 1.026B | 1.165B | 909.9M | 848.8M | 919M | 857.3M | 914M | 927.4M |
| Free cash flow | 505.2M | 368.9M | 760.2M | 549.7M | 1.008B | 841M | 866.5M | 684.6M | 666.7M | 973.1M | 976.7M | 978.1M | 1.008B | 1.124B | 1.122B | 941.1M | 1.158B | 1.2B | 1.02B | 1.045B | 968M |
| Figure | FY 2025 | FY 2024 | FY 2023 | FY 2022 | FY 2021 | FY 2020 | FY 2019 | FY 2018 | FY 2017 | FY 2016 | FY 2015 | FY 2014 | FY 2013 | FY 2012 | FY 2011 | FY 2010 | FY 2009 | FY 2008 | FY 2007 | FY 2006 | FY 2005 |
|---|---|---|---|---|---|---|---|---|---|---|---|---|---|---|---|---|---|---|---|---|---|
| Share price | 9.31 | 10.6 | 11.92 | 13.77 | 17.84 | 21.94 | 26.78 | 17.06 | 19.01 | 21.72 | 17.91 | 17.91 | 17.25 | 13.61 | 18.26 | 18.57 | 18.85 | 14.34 | 21.69 | 23.58 | — |
| Price performance 12m | -0.12 | -0.11 | -0.13 | -0.23 | -0.19 | -0.18 | 0.57 | -0.1 | -0.12 | 0.21 | 0 | 0.04 | 0.27 | -0.25 | -0.02 | -0.01 | 0.31 | -0.34 | -0.08 | — | — |
Filed figures
Lines the statements and their notes report beside the headline figures, read from the filings' XBRL as filed (no restatement applied), with figures computed from one filing's own lines. Cash-flow lines carry their cash direction: an outflow is negative. Each period links to its filing; a figure's period, report date and tag are in its tooltip.
| Figure | Dec 2016 | Dec 2017 | Dec 2018 | Dec 2019 | Dec 2020 | Dec 2021 | Dec 2022 | Dec 2023 | Dec 2024 | Dec 2025 |
|---|---|---|---|---|---|---|---|---|---|---|
| Balance sheet detail | ||||||||||
| Lease liabilities (USD) | — | — | — | 242M | 235M | 203M | 161M | 162M | 191M | 226M |
| Cash and deposits (USD) | 878M | 838M | 973M | 1.45B | 1.43B | 1.21B | 1.29B | 1.27B | 1.47B | 1.23B |
| Intangible assets (USD) | 664M | 586M | 598M | 495M | 505M | 417M | 458M | 380M | 315M | 356M |
| Right-of-use assets (USD) | — | — | — | 200M | 189M | 165M | 122M | 127M | 161M | 195M |
| Cash flow detail | ||||||||||
| Operating cash flow (USD) | 1.04B | 736M | 821M | 915M | 878M | 1.05B | 582M | 783M | 406M | 544M |
| Purchases of property, plant and equipment (USD) | -68.8M | -69.1M | -137M | -48.1M | -36.5M | -37.7M | -31.9M | -22.9M | -37.4M | -38.5M |
| Purchases of intangible assets (USD) | -161M | -108M | -202M | -79.6M | -120M | -177M | -176M | -125M | -93.2M | -112M |
| Change in payables (cash effect) (USD) | 523M | -418M | -127M | 94.3M | -96.6M | -24.8M | 42.6M | -22.4M | -46.4M | -39.4M |
| Dividends paid (cash effect) (USD) | -312M | -326M | -342M | -341M | -370M | -382M | -364M | -349M | -322M | -309M |
| Share buybacks (cash effect) (USD) | -502M | -503M | -412M | -553M | -240M | -410M | -370M | -308M | -186M | -235M |
| Interest paid (cash effect) (USD) | -159M | -128M | -143M | -151M | -110M | -102M | -97.2M | -102M | -114M | -148M |
| Income taxes paid (cash effect) (USD) | -68.4M | 11.6M | -339M | -319M | -187M | -186M | -280M | -197M | -325M | -296M |
| Share-based compensation (USD) | 41.8M | 43.9M | 47.7M | 48.9M | 41.7M | 44.3M | 45.5M | 35.9M | 38.9M | 46.6M |
| Free cash flow (OCF - PPE - intangibles) (USD) | 812M | 559M | 482M | 787M | 721M | 831M | 373M | 635M | 276M | 393M |
| Income detail | ||||||||||
| Total comprehensive income (USD) | 234M | -622M | 880M | 1.08B | 794M | 913M | 795M | 627M | 961M | 489M |
| Provision for credit losses (USD) | 63.9M | 60.6M | 43.9M | 47.1M | — | — | — | — | — | — |
| Reported | Feb 22, 2017 | Feb 22, 2018 | Feb 21, 2019 | Feb 20, 2020 | Feb 19, 2021 | Feb 24, 2022 | Feb 23, 2023 | Feb 22, 2024 | Feb 20, 2025 | Feb 20, 2026 |
Sign up to see institutional holdings
Sign UpPodcast Mentions
Sign up to see podcast mentions and sentiment
Sign UpMaterial events reported to the SEC on Form 8-K or 6-K, newest first. The link opens the filing itself on EDGAR. Press releases from the company's own website, newest first.
DENVER, November 10, 2026 – The Western Union Company (“Western Union”) (NYSE: WU) today announced that it has delivered a notice of termination of its agreement to acquire International Money Express, Inc. (“Intermex”) (NASDAQ: IMXI).
Since entering into the Merger Agreement, Western Union has worked diligently with Intermex and the relevant regulatory authorities to obtain the approvals necessary to complete the transaction. Despite these efforts, the parties were unable to obtain an acceptable approval. Instead, on the evening of November 10, 2026, California’s Department of Financial Protection & Innovation (DFPI) delivered unacceptable final Conditions of Approval that would have required material changes to Western Union’s business model, its agent relationships and execution of its long-term business strategy. Western Union viewed these conditions as substantial and not in the best interests of Western Union, its agents or its shareholders.
Western Union is committed to maintaining robust compliance programs and meeting its regulatory obligations globally, while advancing its longstanding mission of making financial services accessible to people everywhere.
•GAAP revenue of $1.0 billion, down 2% versus the prior year period; adjusted revenue down 1%
•Branded Digital revenue grew 8% on both GAAP and on an adjusted basis
•Consumer Services GAAP revenue declined 2%; or grew 5% on an adjusted basis
•GAAP EPS of $0.25, or adjusted EPS of $0.42
DENVER, November 4, 2026 – The Western Union Company (the “Company” or “Western Union”) (NYSE: WU) today reported third quarter 2026 financial results.
The Company’s third-quarter revenue of $1.0 billion decreased 2% on a reported basis, while adjusted revenue declined 1% compared to the prior year period. The decline in adjusted revenue was largely driven by a slowdown in the North America retail business partially offset by growth in our Branded Digital and Consumer Services businesses.
“As we move through the second half of the year, we continue to make progress against our Beyond strategy,” said Devin McGranahan, President and Chief Executive Officer. “Importantly, the initiatives we launched in the second quarter are streamlining our cost structure and have begun to materialize in our financial results.










Prompts
Click prompts to add them under the company line, click again to take one out, then copy the result into your AI chat. Shared by Asian Century Stocks and Uncovered Thai Stocks. Thank you.
ETFs Holding Western Union Company (The)
Exchange-traded funds whose newest published daily portfolio holds one of the company's listings, largest weight first.
| ETF | Weight in ETF | Shares | Market value | As of |
|---|---|---|---|---|
| LSAT | 2.70% | 269,933 | $ 1.717M | Jul 31, 2026 |
| DWSH short | -0.95% | -9,650 | $ -59.058K | Nov 17, 2026 |
| SCAP | 0.89% | 24,887 | $ 178.191K | Aug 31, 2026 |
| SYLD | 0.84% | 1,308,837 | $ 8.324M | Jul 31, 2026 |
| MYLD | 0.83% | 44,386 | $ 282.295K | Jul 31, 2026 |
| COPY | 0.46% | 271,981 | $ 1.947M | Aug 31, 2026 |
| SQLV | 0.42% | 15,597 | $ 120.097K | Jun 30, 2026 |
| PAPI | 0.42% | 217,149 | $ 1.672M | Jun 30, 2026 |
| HIDV | 0.39% | 113,064 | $ 809.538K | Aug 31, 2026 |
| BSVO | 0.28% | 1,107,873 | $ 6.78M | Nov 18, 2026 |
| GMOV | 0.22% | 32,646 | $ 233.745K | Aug 31, 2026 |
| SEIV | 0.16% | 311,962 | $ 2.402M | Jun 30, 2026 |
| ORR short | -0.15% | -92,171 | $ -560K | Nov 18, 2026 |
| FTHI | 0.13% | 522,139 | $ 3.368M | Nov 16, 2026 |
| AVSC | 0.11% | 565,291 | $ 3.646M | Nov 16, 2026 |
| FLCG | 0.10% | 86,581 | $ 619.92K | Aug 31, 2026 |
| VFMF | 0.08% | 106,971 | $ 765.912K | Aug 31, 2026 |
| FLCC | 0.06% | 11,811 | $ 84.567K | Aug 31, 2026 |
| DDDD | 0.05% | 582 | $ 3,753.90 | Nov 17, 2026 |
| EBI | 0.05% | 46,335 | $ 331.759K | Aug 31, 2026 |
| DFAT | 0.05% | 2,192,690 | $ 14.581M | Nov 12, 2026 |
| FTLS short | -0.04% | -160,604 | $ 0.00 | Nov 16, 2026 |
| AFMC | 0.03% | 12,633 | $ 81.483K | Nov 16, 2026 |
| AFSM | 0.03% | 6,539 | $ 42.177K | Nov 16, 2026 |
| DFAS | 0.03% | 1,390,285 | $ 9.245M | Nov 12, 2026 |
| SFGV | 0.02% | 31,055 | $ 190K | Nov 18, 2026 |
| DXUV | 0.01% | 129,067 | $ 858.296K | Nov 12, 2026 |
| DFSU | 0.01% | 41,861 | $ 278.376K | Nov 12, 2026 |
| AVSU | 0.01% | 5,053 | $ 32.592K | Nov 16, 2026 |
| VSLU | 0.01% | 6,778 | $ 52.191K | Jun 30, 2026 |
| DFAC | 0.01% | 974,384 | $ 6.48M | Nov 12, 2026 |
| DCOR | 0.01% | 460,830 | $ 3.065M | Nov 12, 2026 |
| DFAU | 0.00% | 81,133 | $ 539.534K | Nov 12, 2026 |
| DFUV | 0.00% | 88,732 | $ 590.068K | Nov 12, 2026 |
| DFUS | 0.00% | 95,231 | $ 633.286K | Nov 12, 2026 |
| AVUS | 0.00% | 62,341 | $ 402.099K | Nov 16, 2026 |