October 29, 2026 PDF Version Raising Full-Year Net Sales and Adjusted-Diluted EPS guidance EXTON, Pa., Oct. 29, 2026 /PRNewswire/ -- West Pharmaceutical Services, Inc. (NYSE: WST), a leading provider of innovative, high-quality injectable solutions…
October 29, 2026
PDF Version
Raising Full-Year Net Sales and Adjusted-Diluted EPS guidance
EXTON, Pa., Oct. 29, 2026 /PRNewswire/ -- West Pharmaceutical Services, Inc. (NYSE: WST), a leading provider of innovative, high-quality injectable solutions and services, today announced its financial results for the third quarter of 2026.
Third-Quarter 2026 Summary (comparisons to prior-year period)
-
Net sales of $874.5 million increased 8.7%; organic growth was 11.9%.
-
Diluted earnings per share ("EPS") of $3.02 increased 57.3%.
-
Adjusted-diluted EPS of $2.66 increased 35.7%.
-
The Company repurchased $231 million of stock in the quarter, bringing the year-to-date total to $685 million.
-
Year-to-date operating cash flow was $403 million. Capital expenditures were $125 million.
-
The Company also announced on October 19, 2026, that its Board of Directors declared a fourth-quarter dividend of $0.26 per share, an increase of 18% over the $0.22 per share paid in the prior quarter.
Outlook for Full-Year 2026
-
Full-year 2026 net sales guidance increased to a range of $3.41 billion to $3.42 billion, up from the previous range of $3.345 billion to $3.380 billion.
-
Full-year 2026 adjusted-diluted EPS guidance increased to a range of $9.38 to $9.48, up from the previous range of $8.85 to $9.05.
Michel Lagarde, President and Chief Executive Officer, commented: "I am pleased to report strong third-quarter 2026 results, with net sales and adjusted EPS exceeding our expectations. Our results were again led by our High-Value Product (HVP) Components business. The robust sales performance drove strong operating income margin expansion and EPS growth. As a result of our team's strong execution in the third quarter, we are increasing our full-year 2026 guidance."
Mr. Lagarde concluded: "I want to thank our global teams for their relentless focus on execution to deliver products and services for our customers and the patients they serve. West is a critical primary containment and drug delivery partner for pharmaceutical companies, biotechs and CDMOs around the world. We are grateful for the trust our customers put in us, and we remain committed to driving continuous improvement to even better serve their current and future needs."
Proprietary Products SegmentNet sales of $728.8 million grew by 12.6% and increased 16.6% on an organic basis.
-
High-Value Product ("HVP") Components net sales of $466.7 million increased 19.7% and rose 20.3% on an organic basis. HVP Components accounted for 53% of total company net sales in the quarter.
-
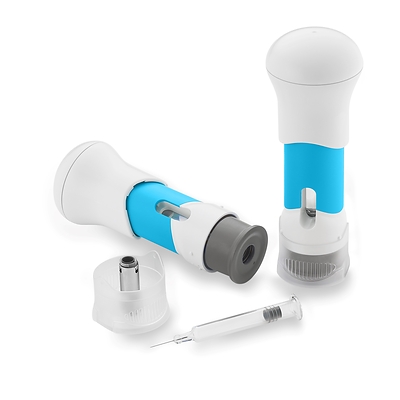
HVP Delivery Devices net sales of $99.1 million were flat, and were up 26.4% on an organic basis excluding foreign currency translation effects and the impact of the divestiture of SmartDose® 3.5mL. HVP Delivery Devices accounted for 11% of total company net sales in the quarter.
-
SmartDose® 3.5mL net sales represented $11.8 million in the quarter and $29.8 million in the prior-year quarter and are excluded from both periods to calculate organic growth.
-
Standard Products net sales of $163.0 million increased by 2.9% and rose 3.1% on an organic basis. Standard Products accounted for 19% of total company net sales this quarter.
West Vantage SegmentNet sales of $145.7 million decreased by 7.3% and declined 6.6% on an organic basis. West Vantage accounted for 17% of total company net sales in the quarter.
Full-Year 2026 Financial Guidance
-
The Company is increasing its full-year 2026 net sales guidance range to $3.41 billion to $3.42 billion, up from the previous range of $3.345 billion to $3.380 billion.
-
Organic net sales growth guidance increased to a range of 11.3% to 11.6%, up from the prior range of 10% to 11%.
-
SmartDose® 3.5mL generated $55.3 million in net sales in the second half of 2025 and generated $11.8 million in net sales in the third quarter of 2026. No additional SmartDose® 3.5mL product sales are expected for the remainder of the year. These net sales are excluded in both periods to calculate full-year 2026 organic growth.
-
The Company is increasing its full-year 2026 adjusted-diluted EPS guidance range to $9.38 to $9.48, up from the previous range of $8.85 to $9.05.
-
Full-year 2026 capital spending guidance is updated to a range of $215 million to $220 million, down from the prior range of $250 million to $275 million.
Third-Quarter 2026 Conference CallManagement will host a conference call at 8 a.m. EDT today. The live webcast can be accessed in the "Investors" section of the Company's website by clicking here.
To participate in the Q&A portion of the conference call, please register in advance by clicking here.
Registered telephone participants will receive the dial-in number along with a unique PIN number that will enable them to ask questions on the call.
An accompanying slide presentation will be posted in the "Investors" section of the Company's website.
A replay of the webcast will be available on the Company's website for approximately 90 days after the event.
About WestWest Pharmaceutical Services, Inc. is a leading provider of innovative, high-quality injectable solutions and services. As a trusted partner to established and emerging drug developers, West helps ensure the safe, effective containment and delivery of life-saving and life-enhancing medicines for patients. With over 10,000 team members across 50 sites including 26 manufacturing facilities worldwide, West helps support our customers by delivering over 41 billion components and devices each year. Headquartered in Exton, Pennsylvania, West in its fiscal year 2025 generated $3.07 billion in net sales. West is traded on the New York Stock Exchange (NYSE: WST) and is included in the Standard & Poor's 500 index. For more information, visit www.westpharma.com.
All trademarks and registered trademarks used in this release are the property of West Pharmaceutical Services, Inc. or its subsidiaries, in the United States and other jurisdictions, unless otherwise noted.
Daikyo®, Daikyo Crystal Zenith® and Daikyo CZ® are registered trademarks of Daikyo Seiko, Ltd. Daikyo Crystal Zenith technologies are licensed from Daikyo Seiko, Ltd.
Forward-Looking StatementsThis press release contains forward-looking statements within the meaning of the Private Securities Litigation Reform Act of 1995, including, but not limited to, statements regarding the Company's expectations regarding future events, financial guidance and financial or operational performance. Forward-looking statements may be identified by words such as "believe," "expect," "intend," "estimate," "plan," "anticipate," "project," "forecast," "guidance," "target," "may," "will," "continue" and similar expressions.
These statements are based on current expectations and assumptions and are subject to risks and uncertainties that could cause actual results to differ materially from those expressed or implied by such forward-looking statements. For additional information regarding these risks as well as other risks, uncertainties and factors that could affect our forward-looking statements, please refer to Part I Item 1A, entitled "Risk Factors," of the Company's most recent Annual Report on Form 10-K and any amendments thereto, as well as the Company's most recently filed Quarterly Reports on Form 10-Q and other filings the Company makes with the Securities and Exchange Commission.
Forward-looking statements speak only as of the date of this press release. Except as required by law or regulation, West Pharmaceutical Services, Inc. undertakes no obligation to update or revise any forward-looking statements, whether as a result of new information, future events or otherwise.
Non-U.S. GAAP Financial MeasuresThe Company reports its financial results in accordance with U.S. generally accepted accounting principles ("U.S. GAAP"). However, management also uses certain non-U.S. GAAP financial measures in evaluating our results of operations. Management believes that this information provides users with a valuable insight into our overall performance and financial position. As a result, this release contains certain non-GAAP financial measures, including organic net sales, adjusted-diluted EPS and adjusted operating profit. Organic net sales exclude the impact from acquisitions and/or divestitures and translate the current-period reported sales of subsidiaries whose functional currency is other than the U.S. Dollar at the applicable foreign currency exchange rates in effect during the comparable prior-year period. We may also refer to financial results, such as adjusted-diluted EPS and adjusted operating profit, that exclude the effects of unallocated items. The unallocated items are not representative of ongoing operations, and generally include restructuring and related charges, certain asset impairments, and other specifically identified income or expense items. These non-U.S. GAAP financial measures should be viewed in addition to, and not as an alternative for, the Company's results prepared in accordance with U.S. GAAP. A reconciliation of these non-U.S. GAAP measures to the comparable U.S. GAAP financial measures is included in the accompanying tables.
| WEST PHARMACEUTICAL SERVICES, INC. CONSOLIDATED STATEMENTS OF INCOME (UNAUDITED) (in millions, except per share data) |
| |
| | Three Months Ended September 30, | | Nine Months Ended September 30, |
| | 2026 | | 2025 | | 2026 | | 2025 |
| Net sales | $ 874.5 | | 100 % | | $ 804.6 | | 100 % | | $ 2,591.7 | | 100 % | | $ 2,269.1 | | 100 % |
| Cost of goods and services sold | 527.1 | | 60 | | 510.3 | | 63 | | 1,618.7 | | 62 | | 1,469.0 | | 65 |
| Gross profit | 347.4 | | 40 | | 294.3 | | 37 | | 973.0 | | 38 | | 800.1 | | 35 |
| Research and development | 18.3 | | 2 | | 17.1 | | 2 | | 53.8 | | 2 | | 52.5 | | 2 |
| Selling, general and administrative expenses | 112.9 | | 13 | | 102.7 | | 13 | | 330.0 | | 13 | | 286.6 | | 13 |
| Other expense (income), net | (51.2) | | (6) | | 6.9 | | 1 | | (34.4) | | (1) | | 32.7 | | 1 |
| Operating profit | 267.4 | | 31 | | 167.6 | | 21 | | 623.6 | | 24 | | 428.3 | | 19 |
| Interest (income) expense, net | (0.5) | | — | | (4.5) | | — | | (4.9) | | — | | (11.7) | | — |
| Other nonoperating expense (income) | 0.2 | | — | | 0.2 | | — | | 0.6 | | — | | 0.6 | | — |
| Income before income taxes and equity in net income of affiliated companies | 267.7 | | 31 | | 171.9 | | 21 | | 627.9 | | 24 | | 439.4 | | 19 |
| Income tax expense | 58.0 | | 7 | | 34.0 | | 4 | | 134.9 | | 5 | | 88.3 | | 4 |
| Equity in net income of affiliated companies | (4.3) | | — | | (2.1) | | — | | (13.8) | | (1) | | (10.5) | | (1) |
| Net income | $ 214.0 | | 24 % | | $ 140.0 | | 17 % | | $ 506.8 | | 20 % | | $ 361.6 | | 16 % |
| | | | | | | | | | | | | | | | |
| Net income per share: | | | | | | | | | | | | | | | |
| Basic | $ 3.04 | | | | $ 1.94 | | | | $ 7.13 | | | | $ 5.00 | | |
| Diluted | $ 3.02 | | | | $ 1.92 | | | | $ 7.09 | | | | $ 4.97 | | |
| | | | | | | | | | | | | | | | |
| Average common shares outstanding | 70.4 | | | | 72.2 | | | | 71.1 | | | | 72.3 | | |
| Average shares assuming dilution | 70.8 | | | | 72.6 | | | | 71.5 | | | | 72.7 | | |
| | | | | | | | | | | | | | | | |
| WEST PHARMACEUTICAL SERVICES REPORTING SEGMENT INFORMATION (UNAUDITED) (in millions) |
| |
| | Three Months Ended September 30, | | Nine Months Ended September 30, |
| Net Sales: | 2026 | | 2025 | | 2026 | | 2025 |
| Proprietary Products | $ 728.8 | | $ 647.5 | | $ 2,145.7 | | $ 1,830.3 |
| West Vantage | 145.7 | | 157.1 | | 446.0 | | 438.8 |
| Consolidated Total | $ 874.5 | | $ 804.6 | | $ 2,591.7 | | $ 2,269.1 |
| | | | | | | | |
| Gross Profit: | | | | | | | |
| Proprietary Products | $ 323.4 | | $ 264.0 | | $ 904.5 | | $ 722.5 |
| West Vantage | 24.0 | | 30.3 | | 68.5 | | 77.6 |
| Gross Profit | $ 347.4 | | $ 294.3 | | $ 973.0 | | $ 800.1 |
| Gross Profit Margin | 39.7 % | | 36.6 % | | 37.5 % | | 35.3 % |
| | | | | | | | |
| Operating Profit (Loss): | | | | | | | |
| Proprietary Products | $ 230.6 | | $ 175.2 | | $ 631.7 | | $ 467.5 |
| West Vantage | 15.5 | | 22.3 | | 44.0 | | 53.6 |
| Stock-based compensation expense | (4.3) | | (8.4) | | (21.8) | | (17.1) |
| General corporate costs | 25.6 | | (21.5) | | (30.3) | | (75.7) |
| Reported Operating Profit | $ 267.4 | | $ 167.6 | | $ 623.6 | | $ 428.3 |
| Reported Operating Profit Margin | 30.6 % | | 20.8 % | | 24.1 % | | 18.9 % |
| | | | | | | | |
| Unallocated items | (45.9) | | 2.5 | | (23.7) | | 22.1 |
| Adjusted Operating Profit | $ 221.5 | | $ 170.1 | | $ 599.9 | | $ 450.4 |
| Adjusted Operating Profit Margin | 25.3 % | | 21.1 % | | 23.1 % | | 19.8 % |
| WEST PHARMACEUTICAL SERVICES RECONCILIATION OF NON-U.S. GAAP MEASURES (UNAUDITED) Please refer to "Non-U.S. GAAP Financial Measures" for more information (in millions, except per share data) Reconciliation of Reported and Adjusted Operating Profit, Net Income and Diluted EPS |
| |
| Three Months ended September 30, 2026 | Operating profit | | Income tax expense | | Net income | | Diluted EPS |
| Reported (U.S. GAAP) | $267.4 | | $58.0 | | $214.0 | | $3.02 |
| Unallocated Items: | | | | | | | |
| Restructuring and other charges(1) | 6.3 | | 1.4 | | 4.9 | | 0.06 |
| M&A activities, including SmartDose® 3.5mL sale(2) | (54.0) | | (22.0) | | (31.9) | | (0.45) |
| Amortization of acquisition-related intangible assets(4) | — | | — | | 0.5 | | 0.01 |
| Other(5) | 1.8 | | 0.4 | | 1.3 | | 0.02 |
| Adjusted (Non-U.S. GAAP) | $221.5 | | $37.8 | | $188.8 | | $2.66 |
| |
| Nine Months ended September 30, 2026 | Operating profit | | Income tax expense | | Net income | | Diluted EPS |
| Reported (U.S. GAAP) | $623.6 | | $134.9 | | $506.8 | | $7.09 |
| Unallocated Items: | | | | | | | |
| Restructuring and other charges(1) | 9.3 | | (9.9) | | 19.1 | | 0.26 |
| M&A activities, including SmartDose® 3.5mL sale(2) | (45.7) | | (20.2) | | (25.5) | | (0.36) |
| Cost-method investment activity(3) | 3.5 | | — | | 3.5 | | 0.05 |
| Amortization of acquisition-related intangible assets(4) | — | | — | | 1.4 | | 0.02 |
| Other(5) | 9.2 | | 2.1 | | 7.2 | | 0.10 |
| Adjusted (Non-U.S. GAAP) | $599.9 | | $106.9 | | $512.5 | | $7.16 |
| |
| Three Months ended September 30, 2025 | Operating profit | | Income tax expense | | Net income | | Diluted EPS |
| Reported (U.S. GAAP) | $167.6 | | $34.0 | | $140.0 | | $1.92 |
| Unallocated items: | | | | | | | |
| Restructuring and other charges(1) | 2.5 | | 0.6 | | 2.0 | | 0.03 |
| Amortization of acquisition-related intangible assets(4) | — | | — | | 0.4 | | 0.01 |
| Adjusted (Non-U.S. GAAP) | $170.1 | | $34.6 | | $142.4 | | $1.96 |
| |
| Nine Months ended September 30, 2025 | Operating profit | | Income tax expense | | Net income | | Diluted EPS |
| Reported (U.S. GAAP) | $428.3 | | $88.3 | | $361.6 | | $4.97 |
| Unallocated items: | | | | | | | |
| Restructuring and other charges(1) | 21.9 | | 3.0 | | 19.0 | | 0.26 |
| Amortization of acquisition-related intangible assets(4) | 0.2 | | — | | 1.5 | | 0.02 |
| Adjusted (Non-U.S. GAAP) | $450.4 | | $91.3 | | $382.1 | | $5.25 |
| (1) | During the three and nine months ended September 30, 2026, the Company recorded pre-tax charges of $6.3 million and $9.3 million, respectively, related to our two existing restructuring programs: (i) $5.8 million and $7.7 million, respectively, within other expense (income), related to severance and retention benefit charges and the acceleration of depreciation and lease costs in connection with the Company's January 2025 restructuring plan and (ii) $0.5 million and $1.6 million, respectively, within selling, general and administrative expenses, for professional services relating to our 2024 plan to optimize the legal structure of the Company and its subsidiaries. In addition, we recorded a one-time tax cost of $12.0 million associated with an internal legal entity restructuring which occurred in the first quarter of 2026. During the three and nine months ended September 30, 2025, the Company recorded pre-tax charges of $2.5 million and $21.9 million, respectively, related to our two existing restructuring programs: (i) $0.9 million and $17.5 million, respectively, within other expense (income), related to severance, acceleration of depreciation and lease costs in connection with the Company's January 2025 restructuring plan and (ii) $1.6 million and $4.4 million, respectively, within selling, general and administrative expenses, for professional services relating to our 2024 plan to optimize the legal structure of the Company and its subsidiaries. In addition, we recorded income tax charges of $2.0 million in the first quarter of 2025, related primarily to withholding tax and capital gains incurred in executing our plan to optimize our legal structure. |
| (2) | During the three and nine months ended September 30, 2026, the Company recorded pre-tax benefit of $54.0 million and $45.7 million, respectively, related to M&A activities, primarily related to the Company's agreement to sell its SmartDose® 3.5mL On-Body Delivery System and associated facilities to AbbVie. The net benefit is composed of a net gain on the sale of its SmartDose® 3.5mL On-Body Delivery System assets of $55.7 million for the three and nine months ended September 30, 2026 within other expense (income). The Company recorded a one-time tax cost of $22.4 million associated with the gain on the sale of SmartDose® 3.5mL On-Body Delivery System. The Company recorded a net benefit of $1.9 million and net charges of $0.3 million, respectively, within other expense (income), related to employee benefits in connection with the sale agreement. The Company recorded the remaining $3.6 million and $9.7 million, respectively, within selling, general and administrative expenses, relating to professional services in connection with other M&A activities. |
| (3) | During the nine months ended September 30, 2026, the Company recorded cost-method investment impairment charges of $3.5 million within other expense (income). |
| (4) | During the three and nine months ended September 30, 2026, the Company recorded $0.5 million and $1.4 million, respectively, of amortization expense in association with an acquisition of increased ownership interest in Daikyo. During the three and nine months ended September 30, 2025, the Company recorded $0.0 million and $0.2 million, respectively, of amortization expense within selling, general and administrative expenses associated with an intangible asset acquired during the second quarter of 2020. During the three and nine months ended September 30, 2025, the Company recorded $0.4 million and $1.3 million, respectively, of amortization expense in association with an acquisition of increased ownership interest in Daikyo. |
| (5) | Other includes nonrecurring professional fees associated with various items including certain legal matters and our cybersecurity incident from May 2026. These charges are recorded within selling, general and administrative expenses. |
| WEST PHARMACEUTICAL SERVICES RECONCILIATION OF NON-U.S. GAAP FINANCIAL MEASURES (UNAUDITED) Please refer to "Non-U.S. GAAP Financial Measures" for more information (in millions, except per share data) Reconciliation of Reported Net Sales to Organic Net Sales by Segment**(6)** |
| |
| The following table presents net sales, consolidated and by reportable segment, for the three months ended September 30, 2026 and 2025: |
| |
| Consolidated Net Sales | 2026 | | 2025 | | Change | | Percentage Change |
| Reported net sales | $ 874.5 | | $ 804.6 | | $ 69.9 | | 8.7 % |
| Less: Foreign exchange | (4.0) | | — | | (4.0) | | |
| SmartDose® 3.5mL transaction | (11.8) | | (29.8) | | 18.0 | | |
| Organic net sales(6) | $ 866.7 | | $ 774.8 | | $ 91.9 | | 11.9 % |
| | | | | | | | |
| Proprietary Products Net Sales | 2026 | | 2025 | | Change | | Percentage Change |
| Reported net sales | $ 728.8 | | $ 647.5 | | $ 81.3 | | 12.6 % |
| Less: Foreign exchange | (3.0) | | — | | (3.0) | | |
| SmartDose® 3.5mL transaction | (11.8) | | (29.8) | | 18.0 | | |
| Organic net sales(6) | $ 720.0 | | $ 617.7 | | $ 102.3 | | 16.6 % |
| | | | | | | | |
| West Vantage Net Sales | 2026 | | 2025 | | Change | | Percentage Change |
| Reported net sales | $ 145.7 | | $ 157.1 | | $ (11.4) | | (7.3) % |
| Less: Foreign exchange | (1.0) | | — | | (1.0) | | |
| Organic net sales(6) | $ 146.7 | | $ 157.1 | | $ (10.4) | | (6.6) % |
| The following table presents net sales, consolidated and by reportable segment, for the nine months ended September 30, 2026 and 2025: |
| |
| Consolidated Net Sales | 2026 | | 2025 | | Change | | Percentage Change |
| Reported net sales | $ 2,591.7 | | $ 2,269.1 | | $ 322.6 | | 14.2 % |
| Less: Foreign exchange | 44.5 | | — | | 44.5 | | |
| SmartDose® 3.5mL transaction | (11.8) | | (29.8) | | 18.0 | | |
| Organic net sales(6) | $ 2,535.4 | | $ 2,239.3 | | $ 296.1 | | 13.2 % |
| | | | | | | | |
| Proprietary Products Net Sales | 2026 | | 2025 | | Change | | Percentage Change |
| Reported net sales | $ 2,145.7 | | $ 1,830.3 | | $ 315.4 | | 17.2 % |
| Less: Foreign exchange | 36.5 | | — | | 36.5 | | |
| SmartDose® 3.5mL transaction | (11.8) | | (29.8) | | 18.0 | | |
| Organic net sales(6) | $ 2,097.4 | | $ 1,800.5 | | $ 296.9 | | 16.5 % |
| | | | | | | | |
| West Vantage Net Sales | 2026 | | 2025 | | Change | | Percentage Change |
| Reported net sales | $ 446.0 | | $ 438.8 | | $ 7.2 | | 1.6 % |
| Less: Foreign exchange | 8.0 | | — | | 8.0 | | |
| Organic net sales(6) | $ 438.0 | | $ 438.8 | | $ (0.8) | | (0.2) % |
| Reconciliation of Proprietary Products Segment Organic Net Sales by Product Category (6) |
| |
| The following table presents net sales within the Proprietary Products reportable segment by product category, for the three months ended September 30, 2026 and 2025: |
| |
| HVP Components | 2026 | | 2025 | | Change | | Percentage Change |
| Reported net sales | $ 466.7 | | $ 390.0 | | $ 76.7 | | 19.7 % |
| Less: Foreign exchange | (2.4) | | — | | (2.4) | | |
| Organic net sales(6) | $ 469.1 | | $ 390.0 | | $ 79.1 | | 20.3 % |
| | | | | | | | |
| HVP Delivery Devices | 2026 | | 2025 | | Change | | Percentage Change |
| Reported net sales | $ 99.1 | | $ 99.1 | | $ — | | — % |
| Less: Foreign exchange | (0.3) | | — | | (0.3) | | |
| SmartDose® 3.5mL transaction | (11.8) | | (29.8) | | 18.0 | | |
| Organic net sales(6) | $ 87.6 | | $ 69.3 | | $ 18.3 | | 26.4 % |
| | | | | | | | |
| Standard Products | 2026 | | 2025 | | Change | | Percentage Change |
| Reported net sales | $ 163.0 | | $ 158.4 | | $ 4.6 | | 2.9 % |
| Less: Foreign exchange | (0.3) | | — | | (0.3) | | |
| Organic net sales(6) | 163.3 | | $ 158.4 | | $ 4.9 | | 3.1 % |
| The following table presents net sales within the Proprietary Products reportable segment by product category, for the nine months ended September 30, 2026 and 2025: |
| |
| HVP Components | 2026 | | 2025 | | Change | | Percentage Change |
| Reported net sales | $ 1,300.1 | | $ 1,061.2 | | $ 238.9 | | 22.5 % |
| Less: Foreign exchange | 22.9 | | — | | 22.9 | | |
| Organic net sales(6) | $ 1,277.2 | | $ 1,061.2 | | $ 216.0 | | 20.4 % |
| | | | | | | | |
| HVP Delivery Devices | 2026 | | 2025 | | Change | | Percentage Change |
| Reported net sales | $ 353.9 | | $ 296.0 | | $ 57.9 | | 19.6 % |
| Less: Foreign exchange | 1.6 | | — | | 1.6 | | |
| SmartDose® 3.5mL transaction | (11.8) | | (29.8) | | 18.0 | | |
| Organic net sales(6) | $ 340.5 | | $ 266.2 | | $ 74.3 | | 27.9 % |
| | | | | | | | |
| Standard Products | 2026 | | 2025 | | Change | | Percentage Change |
| Reported net sales | $ 491.7 | | $ 473.1 | | $ 18.6 | | 3.9 % |
| Less: Foreign exchange | 12.0 | | — | | 12.0 | | |
| Organic net sales(6) | $ 479.7 | | $ 473.1 | | $ 6.6 | | 1.4 % |
| Reconciliation of Proprietary Products Segment Organic Net Sales by Market Group (6) |
| |
| The following table presents net sales within the Proprietary Products reportable segment by market group, for the three months ended September 30, 2026 and 2025: |
| |
| Biologics | 2026 | | 2025 | | Change | | Percentage Change |
| Reported net sales | $ 379.3 | | $ 329.1 | | $ 50.2 | | 15.3 % |
| Less: Foreign exchange | (1.2) | | — | | (1.2) | | |
| SmartDose® 3.5mL transaction | (11.8) | | (29.8) | | 18.0 | | |
| Organic net sales(6) | $ 368.7 | | $ 299.3 | | $ 69.4 | | 23.2 % |
| | | | | | | | |
| Generics | 2026 | | 2025 | | Change | | Percentage Change |
| Reported net sales | $ 128.2 | | $ 135.9 | | $ (7.7) | | (5.7) % |
| Less: Foreign exchange | (1.6) | | — | | (1.6) | | |
| Organic net sales(6) | $ 129.8 | | $ 135.9 | | $ (6.1) | | (4.5) % |
| | | | | | | | |
| Pharma | 2026 | | 2025 | | Change | | Percentage Change |
| Reported net sales | $ 221.3 | | $ 182.5 | | $ 38.8 | | 21.3 % |
| Less: Foreign exchange | (0.2) | | — | | (0.2) | | |
| Organic net sales(6) | $ 221.5 | | $ 182.5 | | $ 39.0 | | 21.4 % |
| The following table presents net sales within the Proprietary Products reportable segment by market group, for the nine months ended September 30, 2026 and 2025: |
| |
| Biologics | 2026 | | 2025 | | Change | | Percentage Change |
| Reported net sales | $ 1,108.6 | | $ 886.1 | | $ 222.5 | | 25.1 % |
| Less: Foreign exchange | 17.4 | | — | | 17.4 | | |
| SmartDose® 3.5mL transaction | (11.8) | | (29.8) | | 18.0 | | |
| Organic net sales(6) | $ 1,079.4 | | $ 856.3 | | $ 223.1 | | 26.1 % |
| | | | | | | | |
| Generics | 2026 | | 2025 | | Change | | Percentage Change |
| Reported net sales | $ 400.2 | | $ 382.6 | | $ 17.6 | | 4.6 % |
| Less: Foreign exchange | 3.7 | | — | | 3.7 | | |
| Organic net sales(6) | $ 396.5 | | $ 382.6 | | $ 13.9 | | 3.6 % |
| | | | | | | | |
| Pharma | 2026 | | 2025 | | Change | | Percentage Change |
| Reported net sales | $ 636.9 | | $ 561.6 | | $ 75.3 | | 13.4 % |
| Less: Foreign exchange | 15.4 | | — | | 15.4 | | |
| Organic net sales(6) | $ 621.5 | | $ 561.6 | | $ 59.9 | | 10.7 % |
| Reconciliation of Reported Net Sales to Organic Net Sales by Geography (6) |
| |
| The following table presents net sales, consolidated and by geographic region, for the three months ended September 30, 2026 and 2025: |
| |
| Americas | 2026 | | 2025 | | Change | | Percentage Change |
| Reported net sales | $ 401.3 | | $ 375.3 | | $ 26.0 | | 6.9 % |
| Less: Foreign exchange | 1.3 | | — | | 1.3 | | |
| SmartDose® 3.5mL transaction | (11.8) | | (29.8) | | 18.0 | | |
| Organic net sales(6) | $ 388.2 | | $ 345.5 | | $ 42.7 | | 12.4 % |
| | | | | | | | |
| Europe, Middle East, Africa ("EMEA") | 2026 | | 2025 | | Change | | Percentage Change |
| Reported net sales | $ 376.1 | | $ 361.1 | | $ 15.0 | | 4.2 % |
| Less: Foreign exchange | (5.6) | | — | | (5.6) | | |
| Organic net sales(6) | $ 381.7 | | $ 361.1 | | $ 20.6 | | 5.7 % |
| | | | | | | | |
| Asia Pacific | 2026 | | 2025 | | Change | | Percentage Change |
| Reported net sales | $ 97.1 | | $ 68.2 | | $ 28.9 | | 42.4 % |
| Less: Foreign exchange | 0.3 | | — | | 0.3 | | |
| Organic net sales(6) | $ 96.8 | | $ 68.2 | | $ 28.6 | | 41.9 % |
| The following table presents net sales, consolidated and by reportable segment, for the nine months ended September 30, 2026 and 2025: |
| |
| Americas | 2026 | | 2025 | | Change | | Percentage Change |
| Reported net sales | $ 1,167.3 | | $ 1,063.9 | | $ 103.4 | | 9.7 % |
| Less: Foreign exchange | 5.1 | | — | | 5.1 | | |
| SmartDose® 3.5mL transaction | (11.8) | | (29.8) | | 18.0 | | |
| Organic net sales(6) | $ 1,150.4 | | $ 1,034.1 | | $ 116.3 | | 11.2 % |
| | | | | | | | |
| Europe, Middle East, Africa ("EMEA") | 2026 | | 2025 | | Change | | Percentage Change |
| Reported net sales | $ 1,175.3 | | $ 1,017.7 | | $ 157.6 | | 15.5 % |
| Less: Foreign exchange | 39.7 | | — | | 39.7 | | |
| Organic net sales(6) | $ 1,135.6 | | $ 1,017.7 | | $ 117.9 | | 11.6 % |
| | | | | | | | |
| Asia Pacific | 2026 | | 2025 | | Change | | Percentage Change |
| Reported net sales | $ 249.1 | | $ 187.5 | | $ 61.6 | | 32.9 % |
| Less: Foreign exchange | (0.3) | | — | | (0.3) | | |
| Organic net sales(6) | $ 249.4 | | $ 187.5 | | $ 61.9 | | 33.0 % |
| (6) | Organic net sales exclude the impact from acquisitions and/or divestitures and translate the current-period reported sales of subsidiaries whose functional currency is other than the U.S. Dollar at the applicable foreign currency exchange rates in effect during the comparable prior-year period. |
| WEST PHARMACEUTICAL SERVICES RECONCILIATION OF NON-U.S. GAAP FINANCIAL MEASURES (UNAUDITED) Please refer to "Non-U.S. GAAP Financial Measures" for more information (in millions, except per share data) Reconciliation of Reported-Diluted EPS Guidance to Adjusted-Diluted EPS Guidance |
| |
| | 2025 Actual | | 2026 Guidance | | % Change |
| Reported-diluted EPS (U.S. GAAP) | $6.79 | | $9.31 to $9.41 | | 37.1% to 38.6% |
| Restructuring and other charges | 0.31 | | 0.26 | | |
| M&A activities, including SmartDose® 3.5mL sale | 0.09 | | (0.36) | | |
| Cost-method investment activity | 0.06 | | 0.05 | | |
| Amortization of acquisition-related intangible assets | 0.03 | | 0.02 | | |
| Other | 0.01 | | 0.10 | | |
| Adjusted-diluted EPS (Non-U.S. GAAP) | $7.29 | | $9.38 to $9.48 | | 28.7% to 30.0% |
| WEST PHARMACEUTICAL SERVICES CONDENSED CONSOLIDATED BALANCE SHEETS (UNAUDITED) |
| |
| (in millions, except per share data) | September 30, 2026 | | December 31, 2025 |
| ASSETS | | | |
| Current assets: | | | |
| Cash and cash equivalents | $ 464.1 | | $ 791.3 |
| Accounts receivable, net | 748.2 | | 574.4 |
| Inventories | 464.7 | | 443.9 |
| Other current assets | 139.5 | | 168.6 |
| Total current assets | 1,816.5 | | 1,978.2 |
| Property, plant and equipment | 3,266.1 | | 3,223.4 |
| Less: accumulated depreciation and amortization | 1,594.1 | | 1,497.0 |
| Property, plant and equipment, net | 1,672.0 | | 1,726.4 |
| Operating lease right-of-use assets | 98.4 | | 117.0 |
| Investments in affiliated companies | 215.8 | | 212.3 |
| Goodwill | 108.7 | | 109.9 |
| Intangible assets, net | 6.2 | | 7.7 |
| Deferred income taxes | 60.2 | | 38.4 |
| Other noncurrent assets | 82.9 | | 80.1 |
| Total Assets | $ 4,060.7 | | $ 4,270.0 |
| | | | |
| LIABILITIES AND EQUITY | | | |
| Current liabilities: | | | |
| Accounts payable | $ 249.4 | | $ 253.7 |
| Accrued salaries, wages and benefits | 124.3 | | 135.9 |
| Income taxes payable | 56.2 | | 28.1 |
| Operating lease liabilities | 19.5 | | 22.7 |
| Accrued commissions, rebates and royalties | 38.6 | | 39.2 |
| Other current liabilities | 156.3 | | 175.3 |
| Total current liabilities | 644.3 | | 654.9 |
| Long-term debt | 202.9 | | 202.8 |
| Deferred income taxes | 23.0 | | 23.0 |
| Pension and other postretirement benefits | 28.6 | | 29.0 |
| Operating lease liabilities | 82.6 | | 95.6 |
| Deferred compensation benefits | 14.0 | | 13.5 |
| Other long-term liabilities | 97.1 | | 75.2 |
| Total Liabilities | 1,092.5 | | 1,094.0 |
| | | | |
| Equity: | | | |
| Preferred stock, 3.0 million shares authorized; 0 shares issued and outstanding | — | | — |
| Common stock, par value $0.25 per share; 200.0 million shares authorized; shares issued: September 30, 2026 - 75.3 million, December 31, 2025 - 75.3 million; shares outstanding: September 30, 2026 - 69.8 million, December 31, 2025 - 72.0 million | 18.8 | | 18.8 |
| Capital in excess of par value | — | | — |
| Retained earnings | 4,816.8 | | 4,374.9 |
| Accumulated other comprehensive loss | (137.0) | | (105.5) |
| Treasury stock, at cost (September 30, 2026 - 5.5 million shares, December 31, 2025 - 3.3 million shares) | (1,730.4) | | (1,112.2) |
| Total Equity | 2,968.2 | | 3,176.0 |
| Total Liabilities and Equity | $ 4,060.7 | | $ 4,270.0 |
| WEST PHARMACEUTICAL SERVICES CONDENSED CONSOLIDATED STATEMENTS OF CASH FLOWS (UNAUDITED) (in millions) |
| |
| | Nine Months Ended September 30, |
| | 2026 | | 2025 |
| Cash flows from operating activities: | | | |
| Net income | $ 506.8 | | $ 361.6 |
| Adjustments to reconcile net income to net cash provided by operating activities: | | | |
| Depreciation | 136.0 | | 122.2 |
| Amortization | 1.3 | | 2.2 |
| Stock-based compensation | 21.8 | | 17.1 |
| Gain on sale of SmartDose® 3.5mL On-Body Delivery System | (55.7) | | — |
| Non-cash restructuring charges | 3.8 | | 2.5 |
| Asset impairments | 4.6 | | 4.4 |
| Other non-cash items, net | (7.0) | | (4.4) |
| Changes in assets and liabilities | (208.2) | | (1.9) |
| Net cash provided by operating activities | 403.4 | | 503.7 |
| | | | |
| Cash flows from investing activities: | | | |
| Capital expenditures | (125.0) | | (209.8) |
| Proceeds from sale of assets | 126.9 | | — |
| Disbursement associated with the sale of assets | (8.9) | | — |
| Net cash used in investing activities | (7.0) | | (209.8) |
| | | | |
| Cash flows from financing activities: | | | |
| Borrowings under revolving credit agreements | 50.0 | | — |
| Repayments under revolving credit agreements | (50.0) | | — |
| Principal repayments on finance leases | (1.2) | | (0.8) |
| Excise tax payments | (0.8) | | (4.2) |
| Dividend payments | (47.0) | | (45.4) |
| Proceeds from stock-based compensation awards | 17.0 | | 8.2 |
| Employee stock purchase plan contributions | 5.8 | | 5.4 |
| Shares purchased under share repurchase programs | (685.3) | | (134.0) |
| Shares repurchased for employee tax withholdings | (3.8) | | (2.6) |
| Net cash used in financing activities | (715.3) | | (173.4) |
| Effect of exchange rates on cash | (8.3) | | 23.4 |
| Net (decrease) increase in cash and cash equivalents | (327.2) | | 143.9 |
| | | | |
| Cash, including cash equivalents at beginning of period | 791.3 | | 484.6 |
| Cash, including cash equivalents at end of period | $ 464.1 | | $ 628.5 |
| | | | |
| Supplemental cash flow information: | | | |
| Accrued capital expenditures | $ 28.3 | | $ 38.1 |
 View original content to download multimedia:https://www.prnewswire.com/news-releases/west-reports-third-quarter-2026-results-302922802.html
SOURCE West Pharmaceutical Services, Inc.
Michele Polinsky, Vice President, Global Communications, (610) 594-3054, [email protected]
Contact Investor Relations 


 View original content to download multimedia:https://www.prnewswire.com/news-releases/west-to-participate-in-upcoming-investor-conference-302928095.html
 View original content to download multimedia:
 View original content to download multimedia:
 View original content to download multimedia:
 View original content to download multimedia:
 View original content to download multimedia:
 View original content to download multimedia:
 View original content to download multimedia:


 Overview
 Financial
 Events & Presentations
 Corporate Governance
 Stock Information
 Transfer Agent


 View original content to download multimedia:
 View original content to download multimedia:
 View original content to download multimedia:
 View original content to download multimedia:

 View original content to download multimedia:

 View original content to download multimedia:
 View original content to download multimedia:
 View original content to download multimedia:
 View original content to download multimedia:
 View original content to download multimedia: