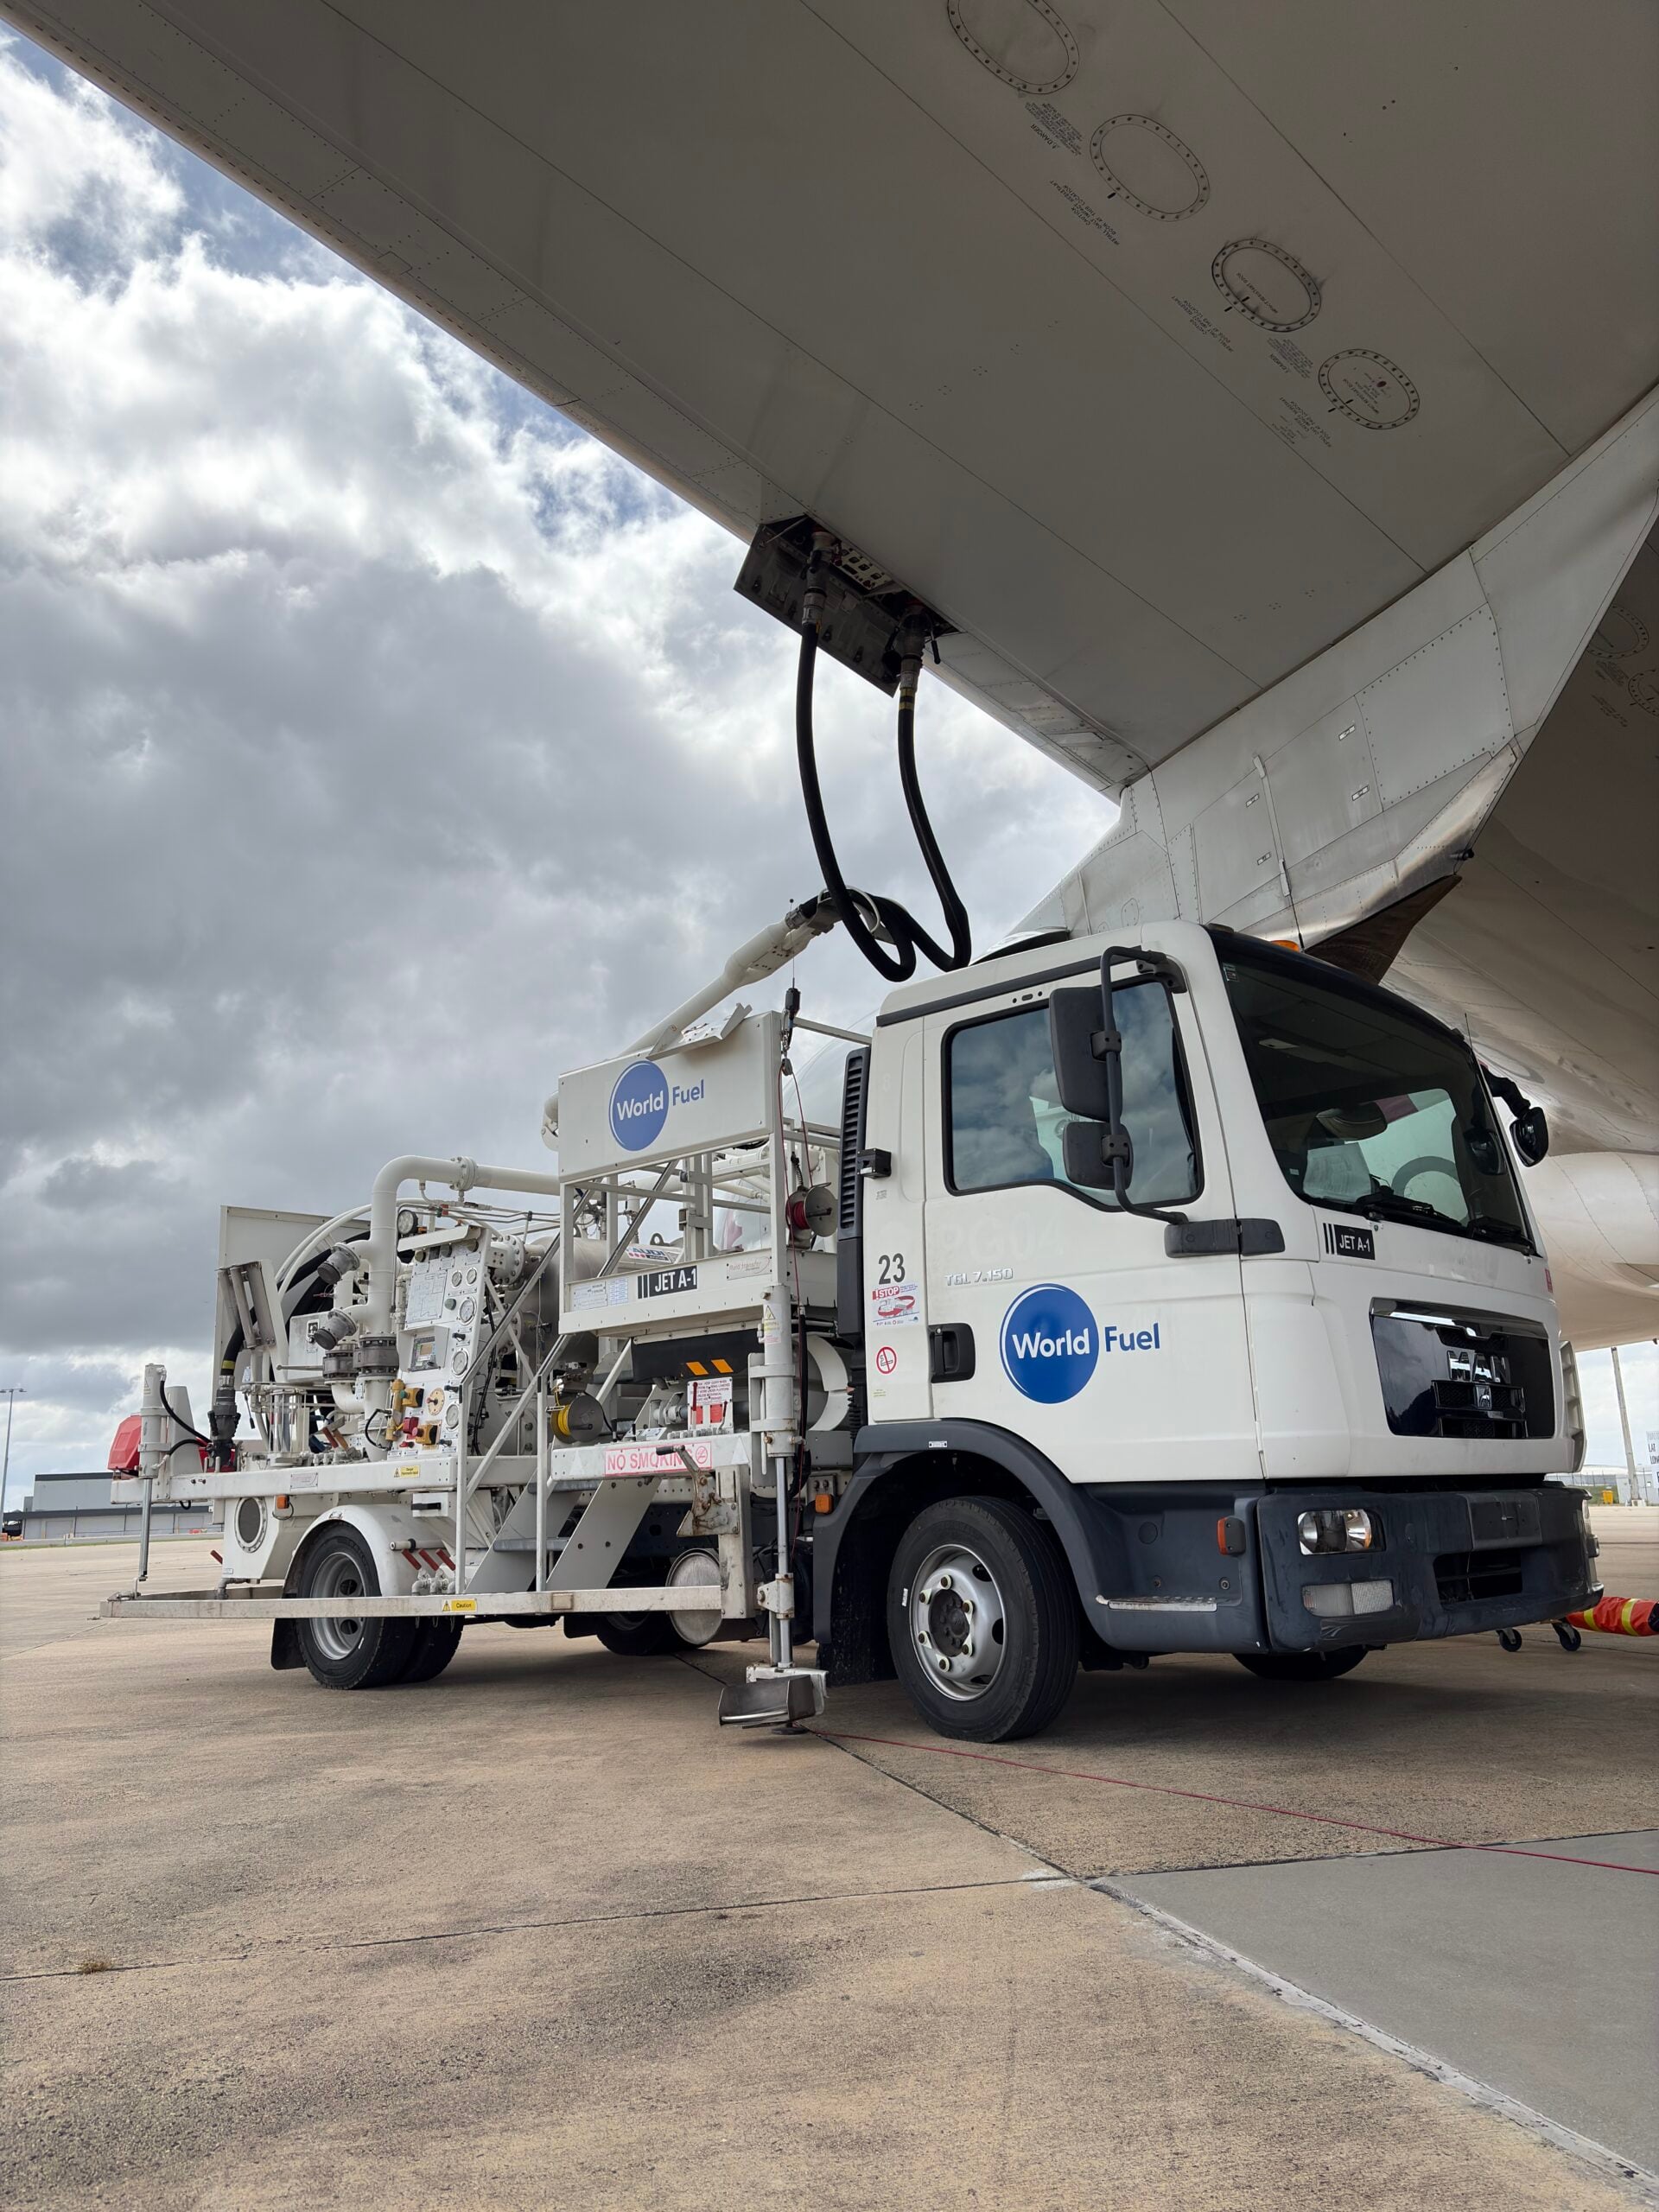
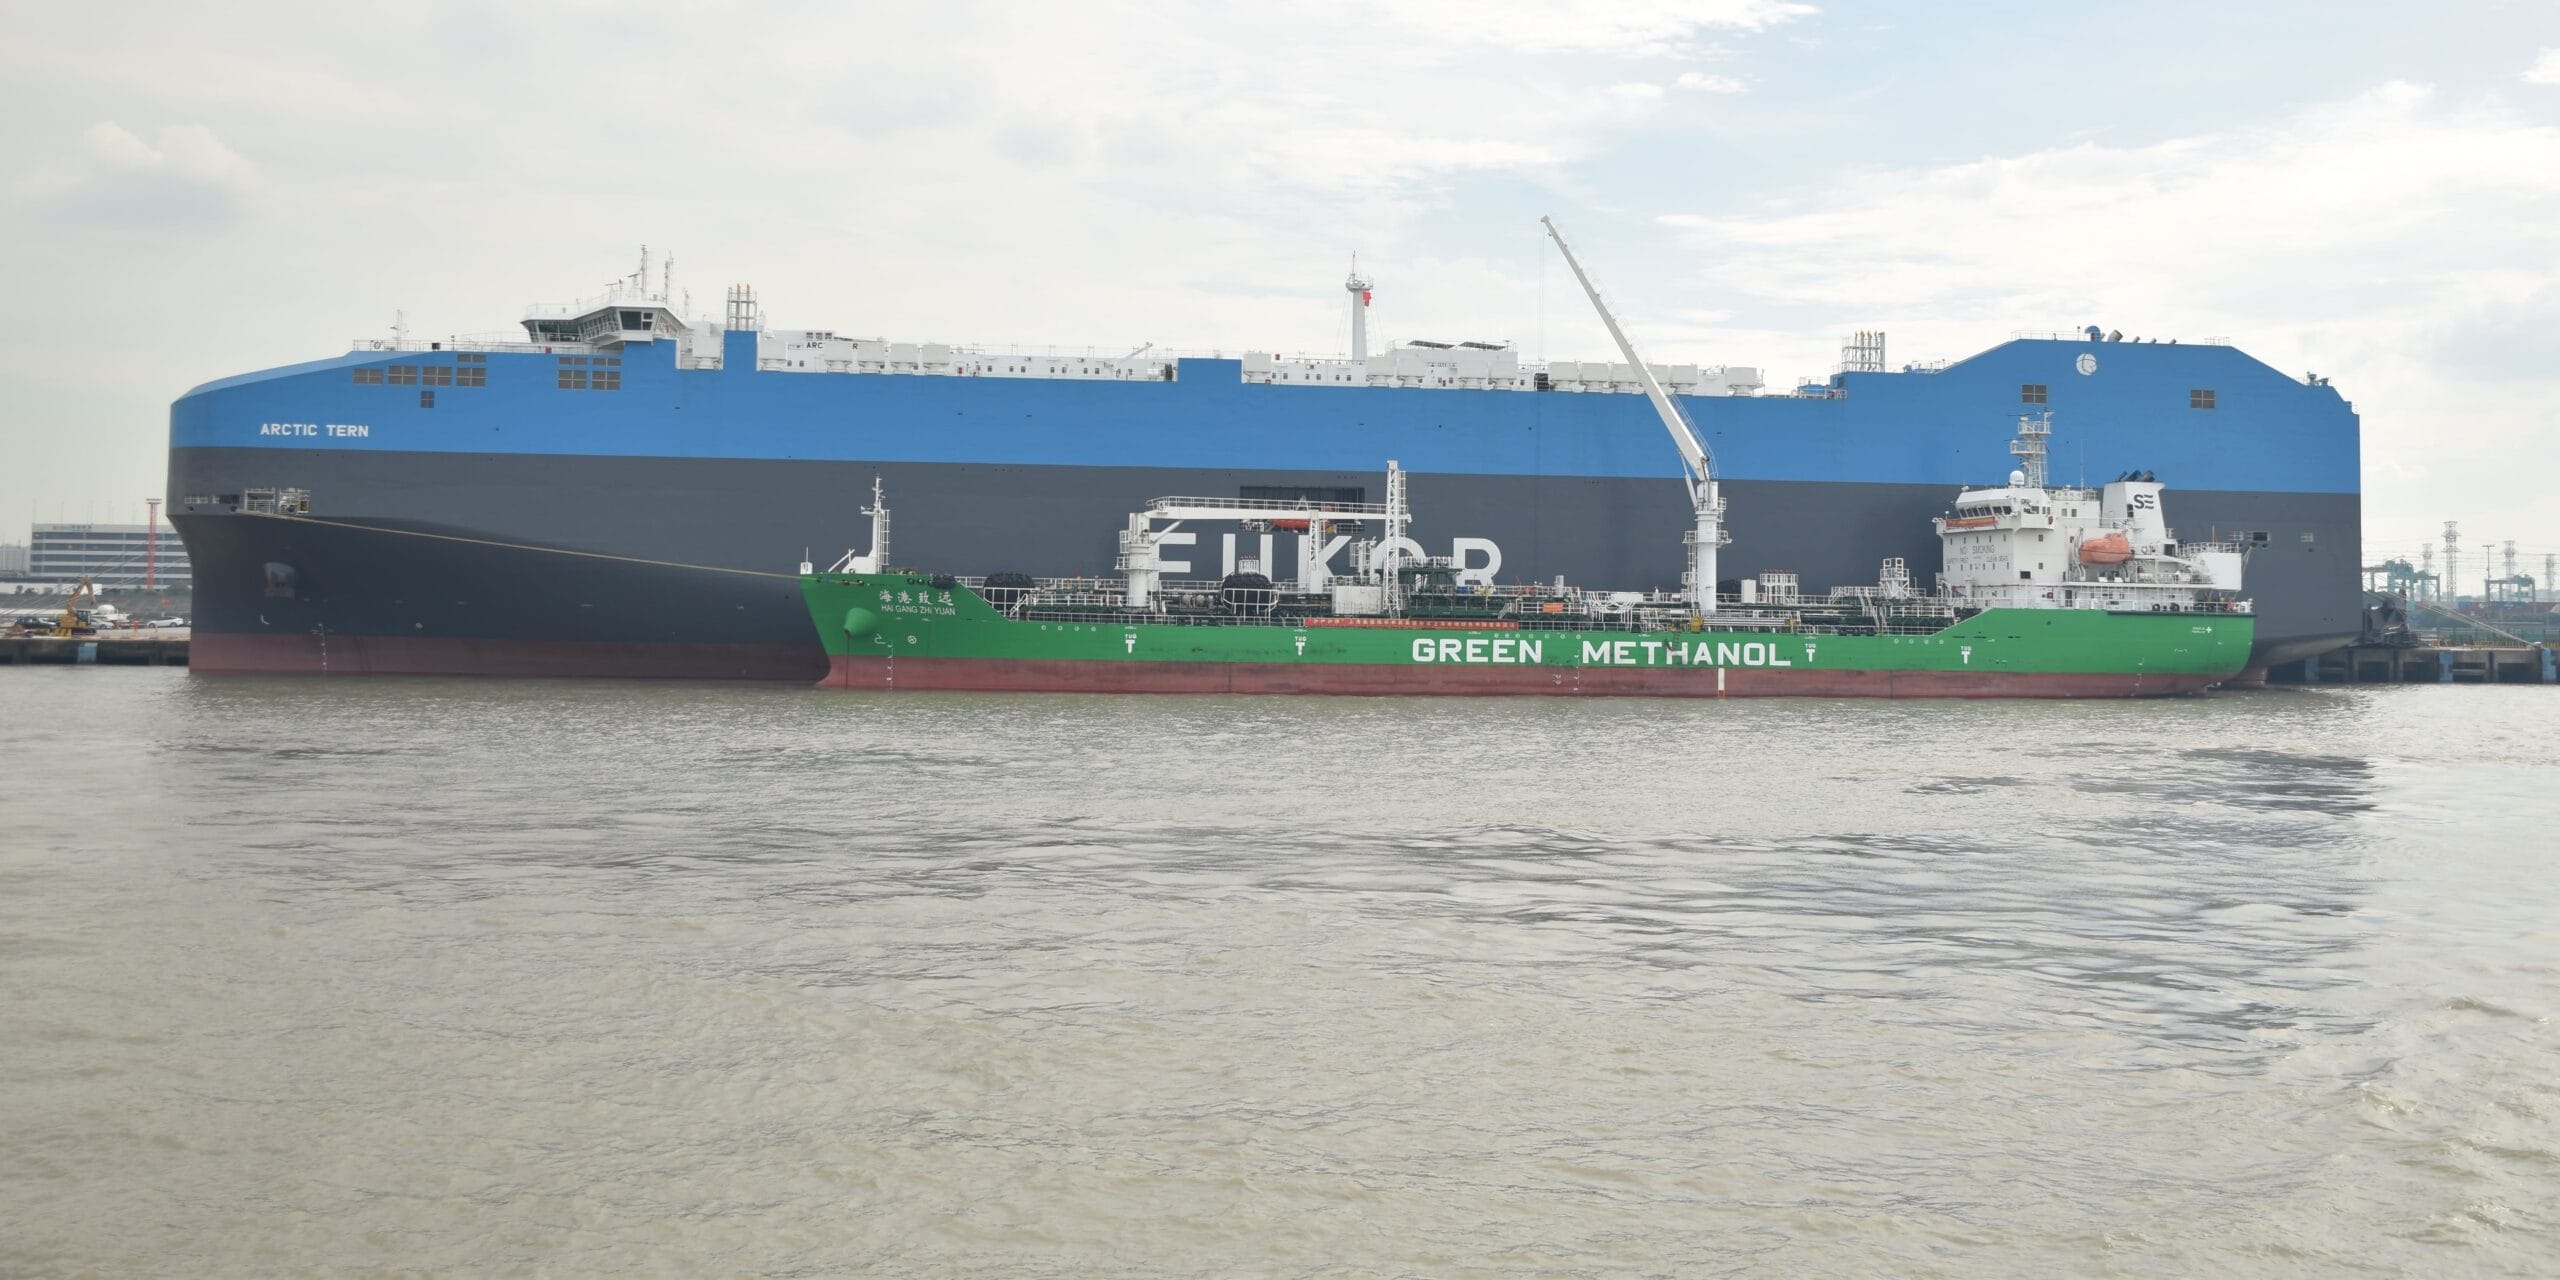
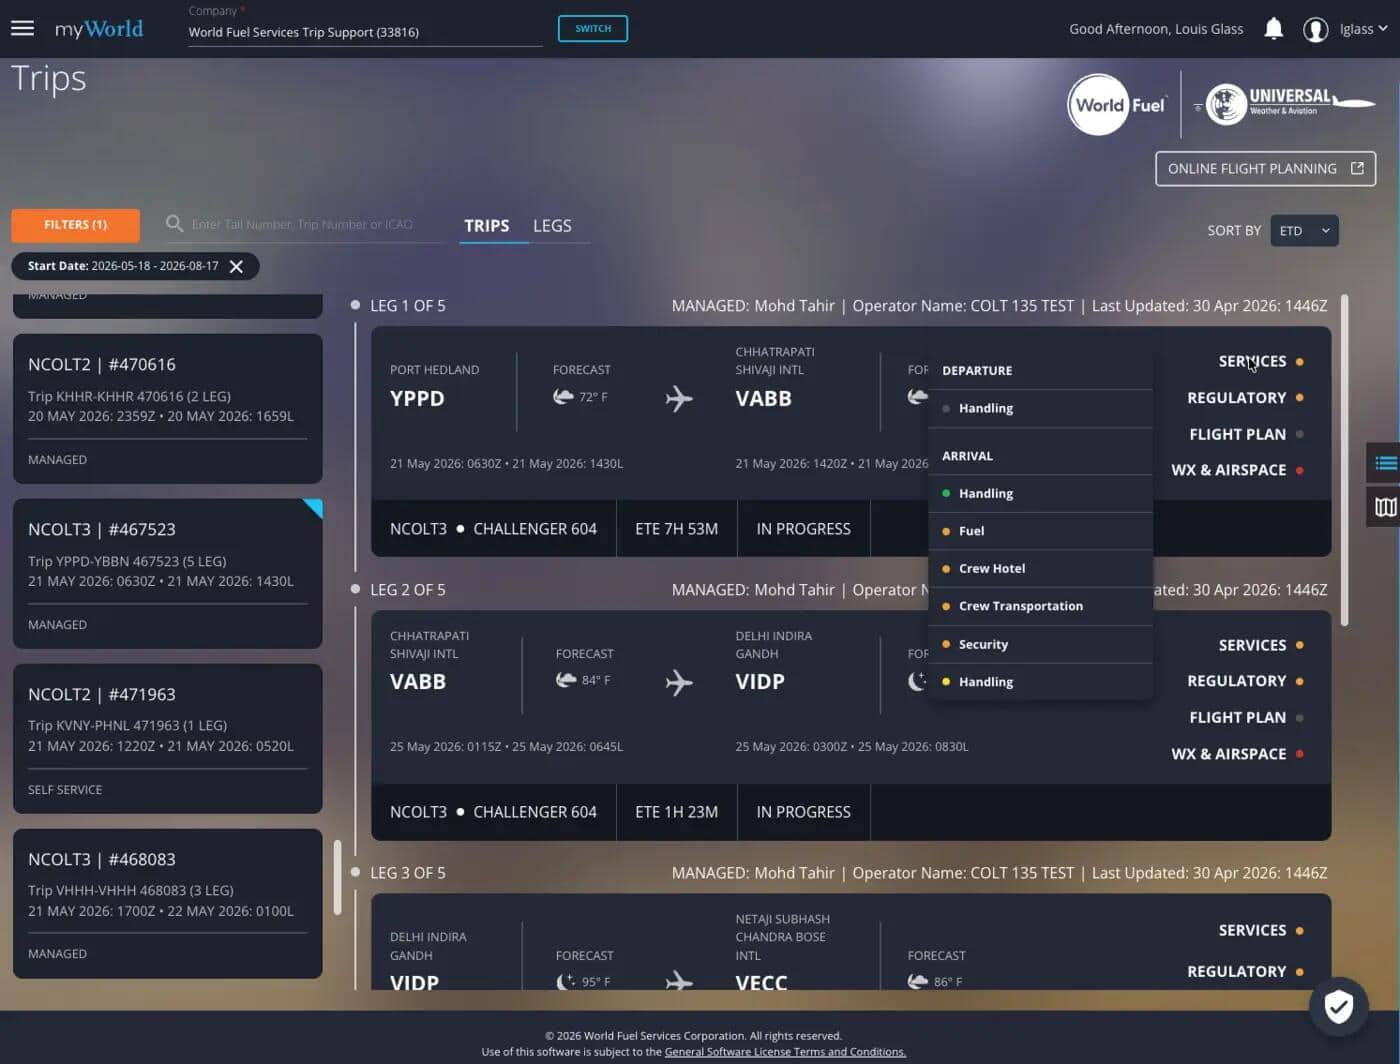
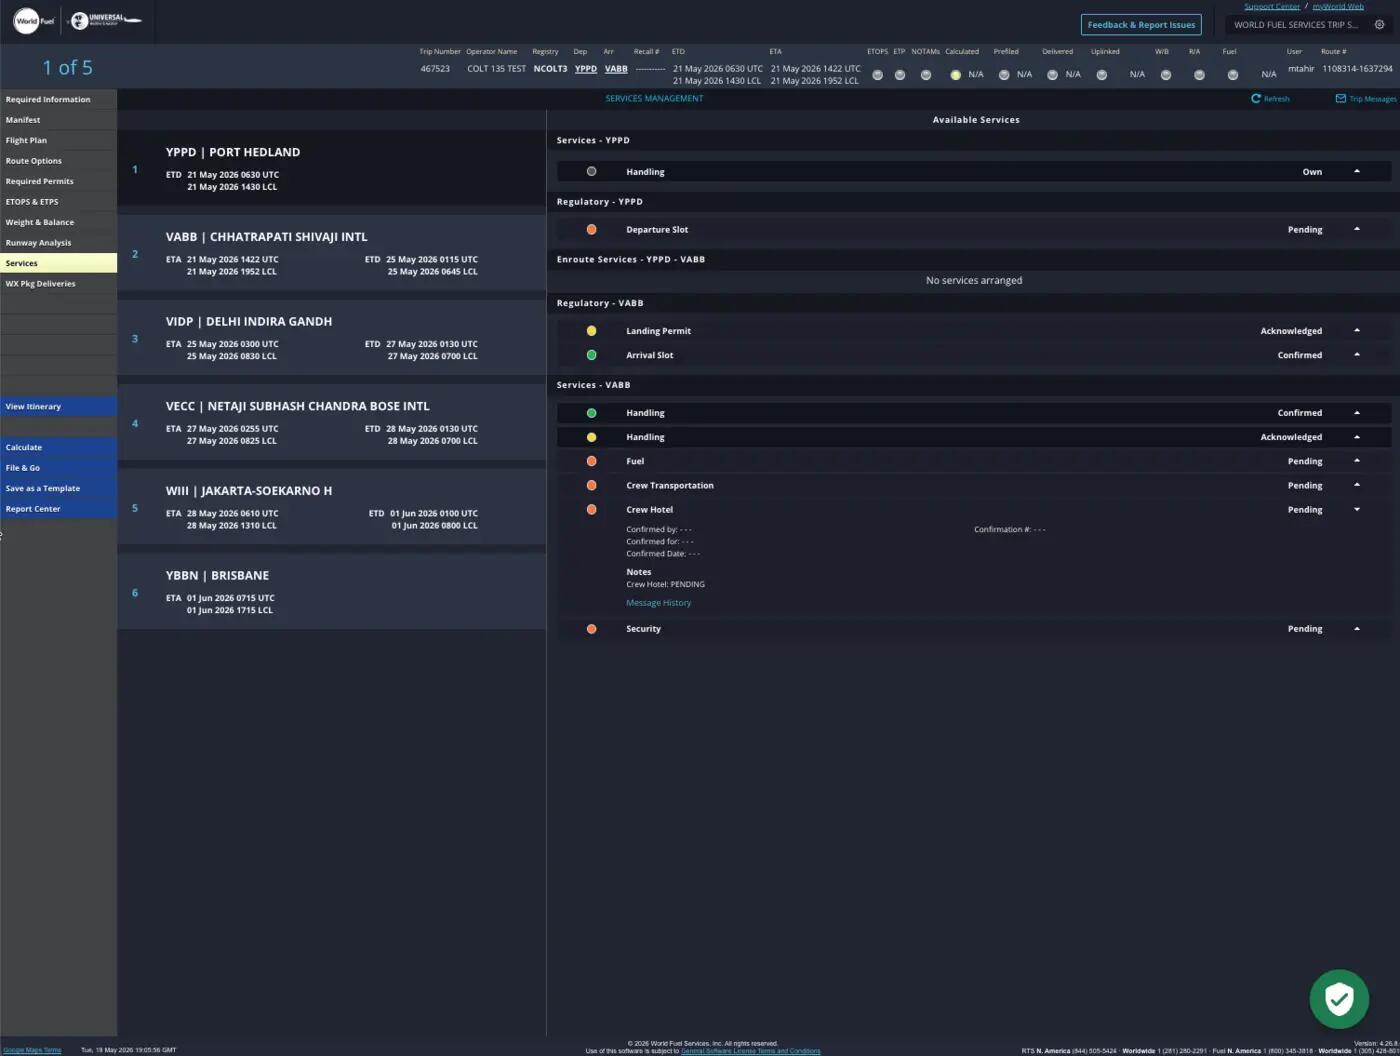
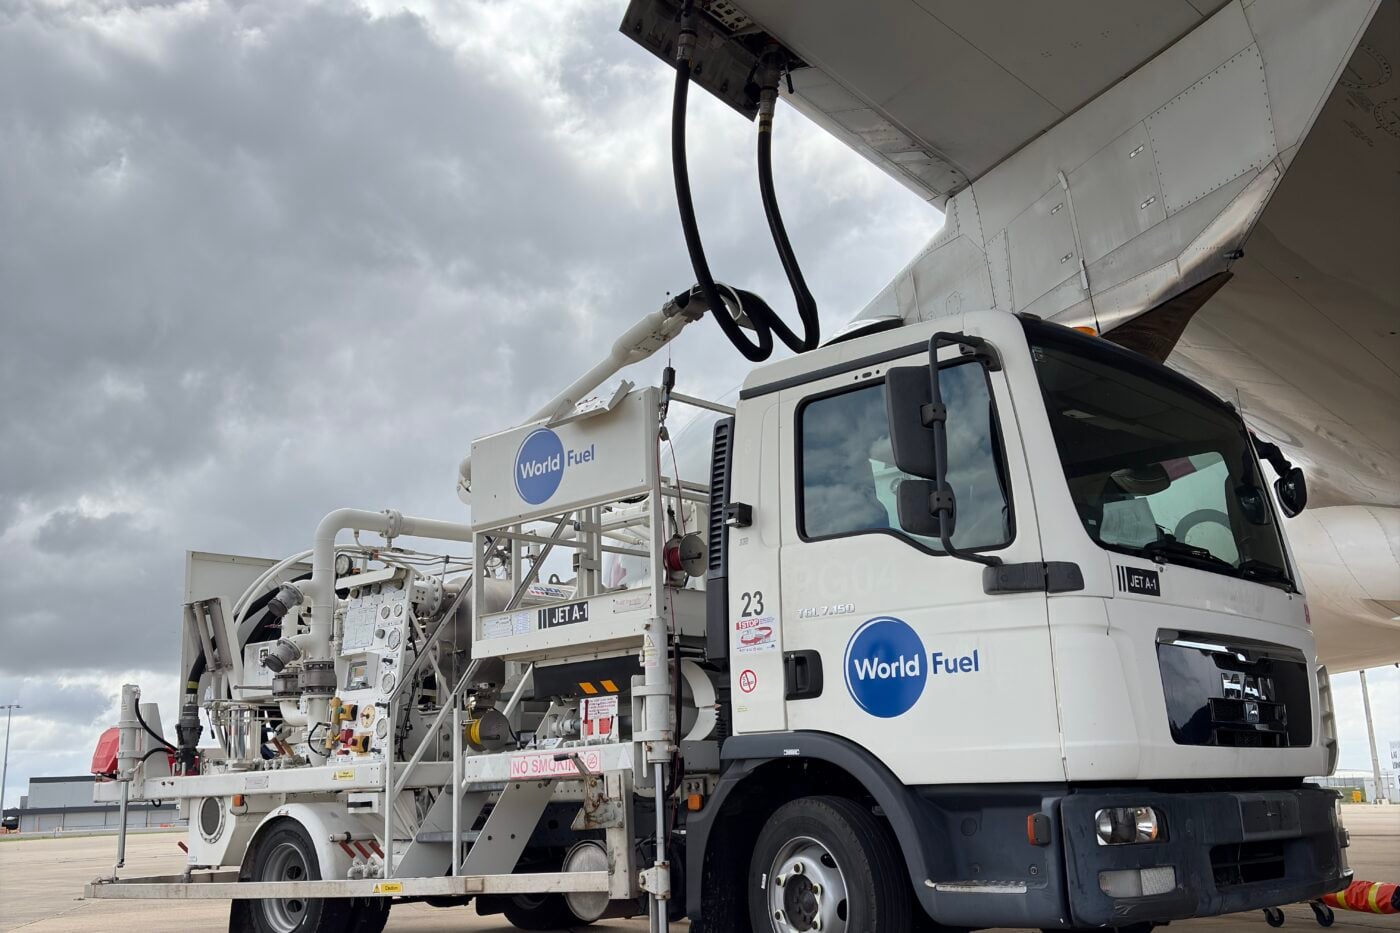
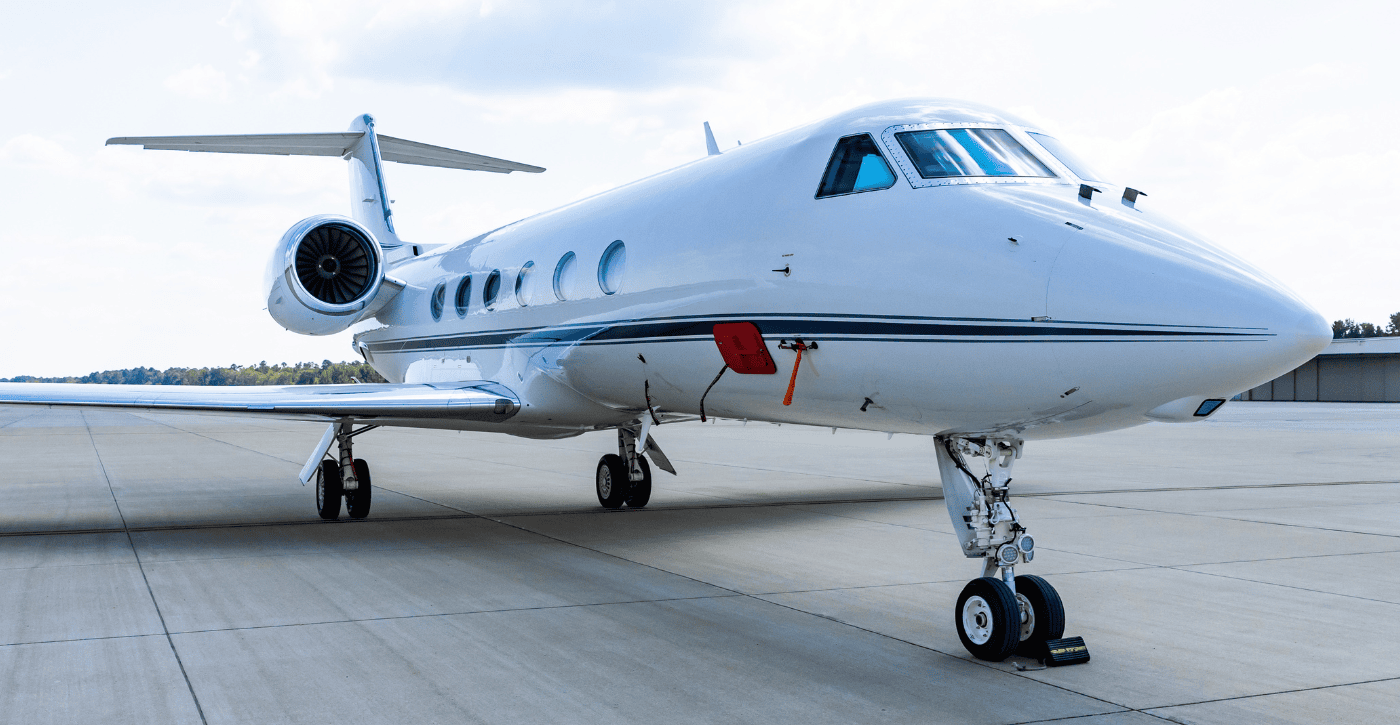
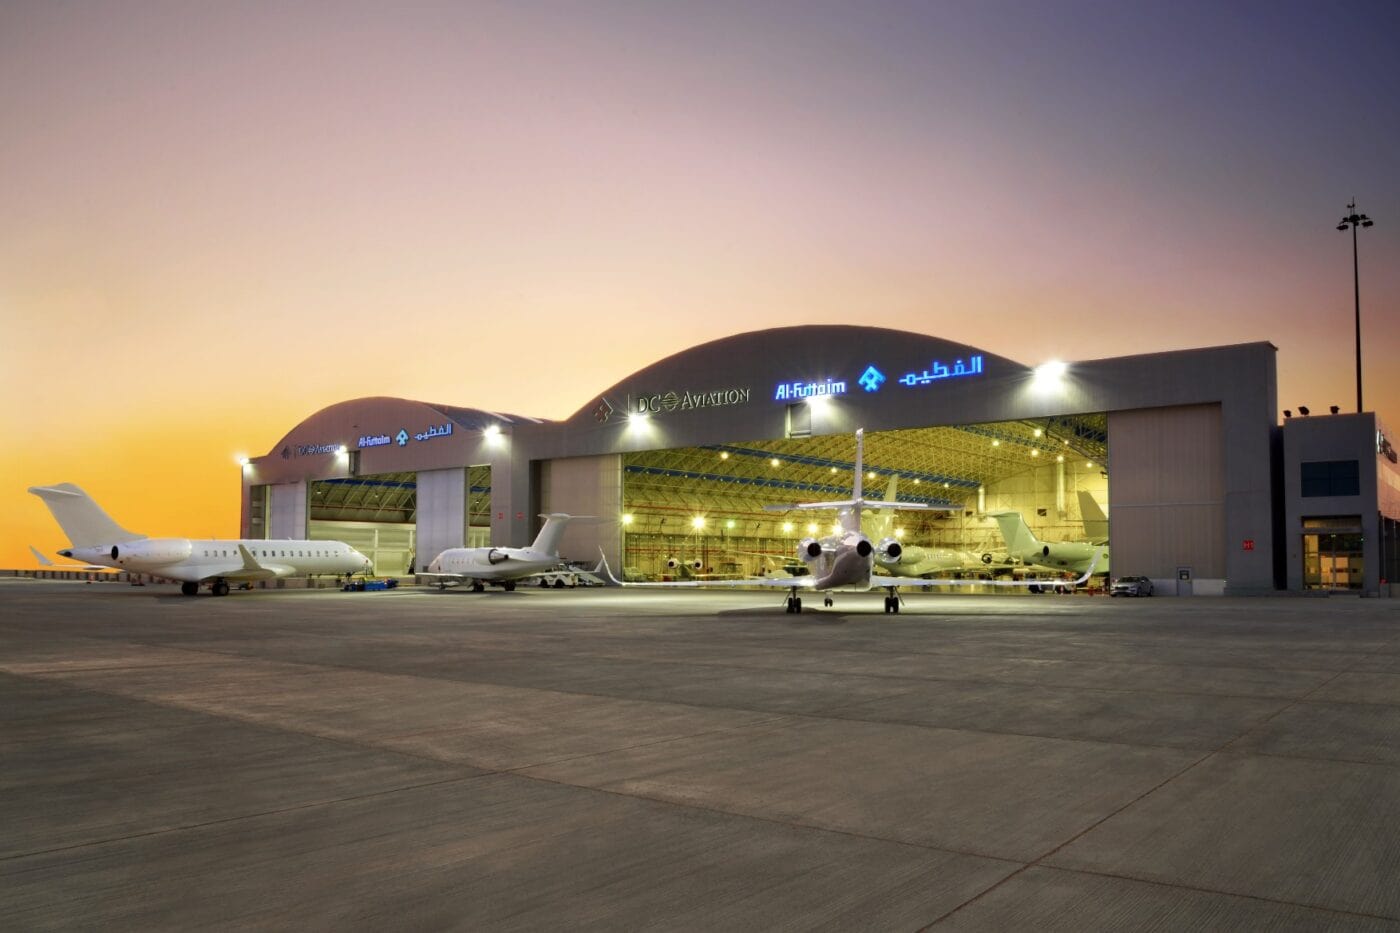
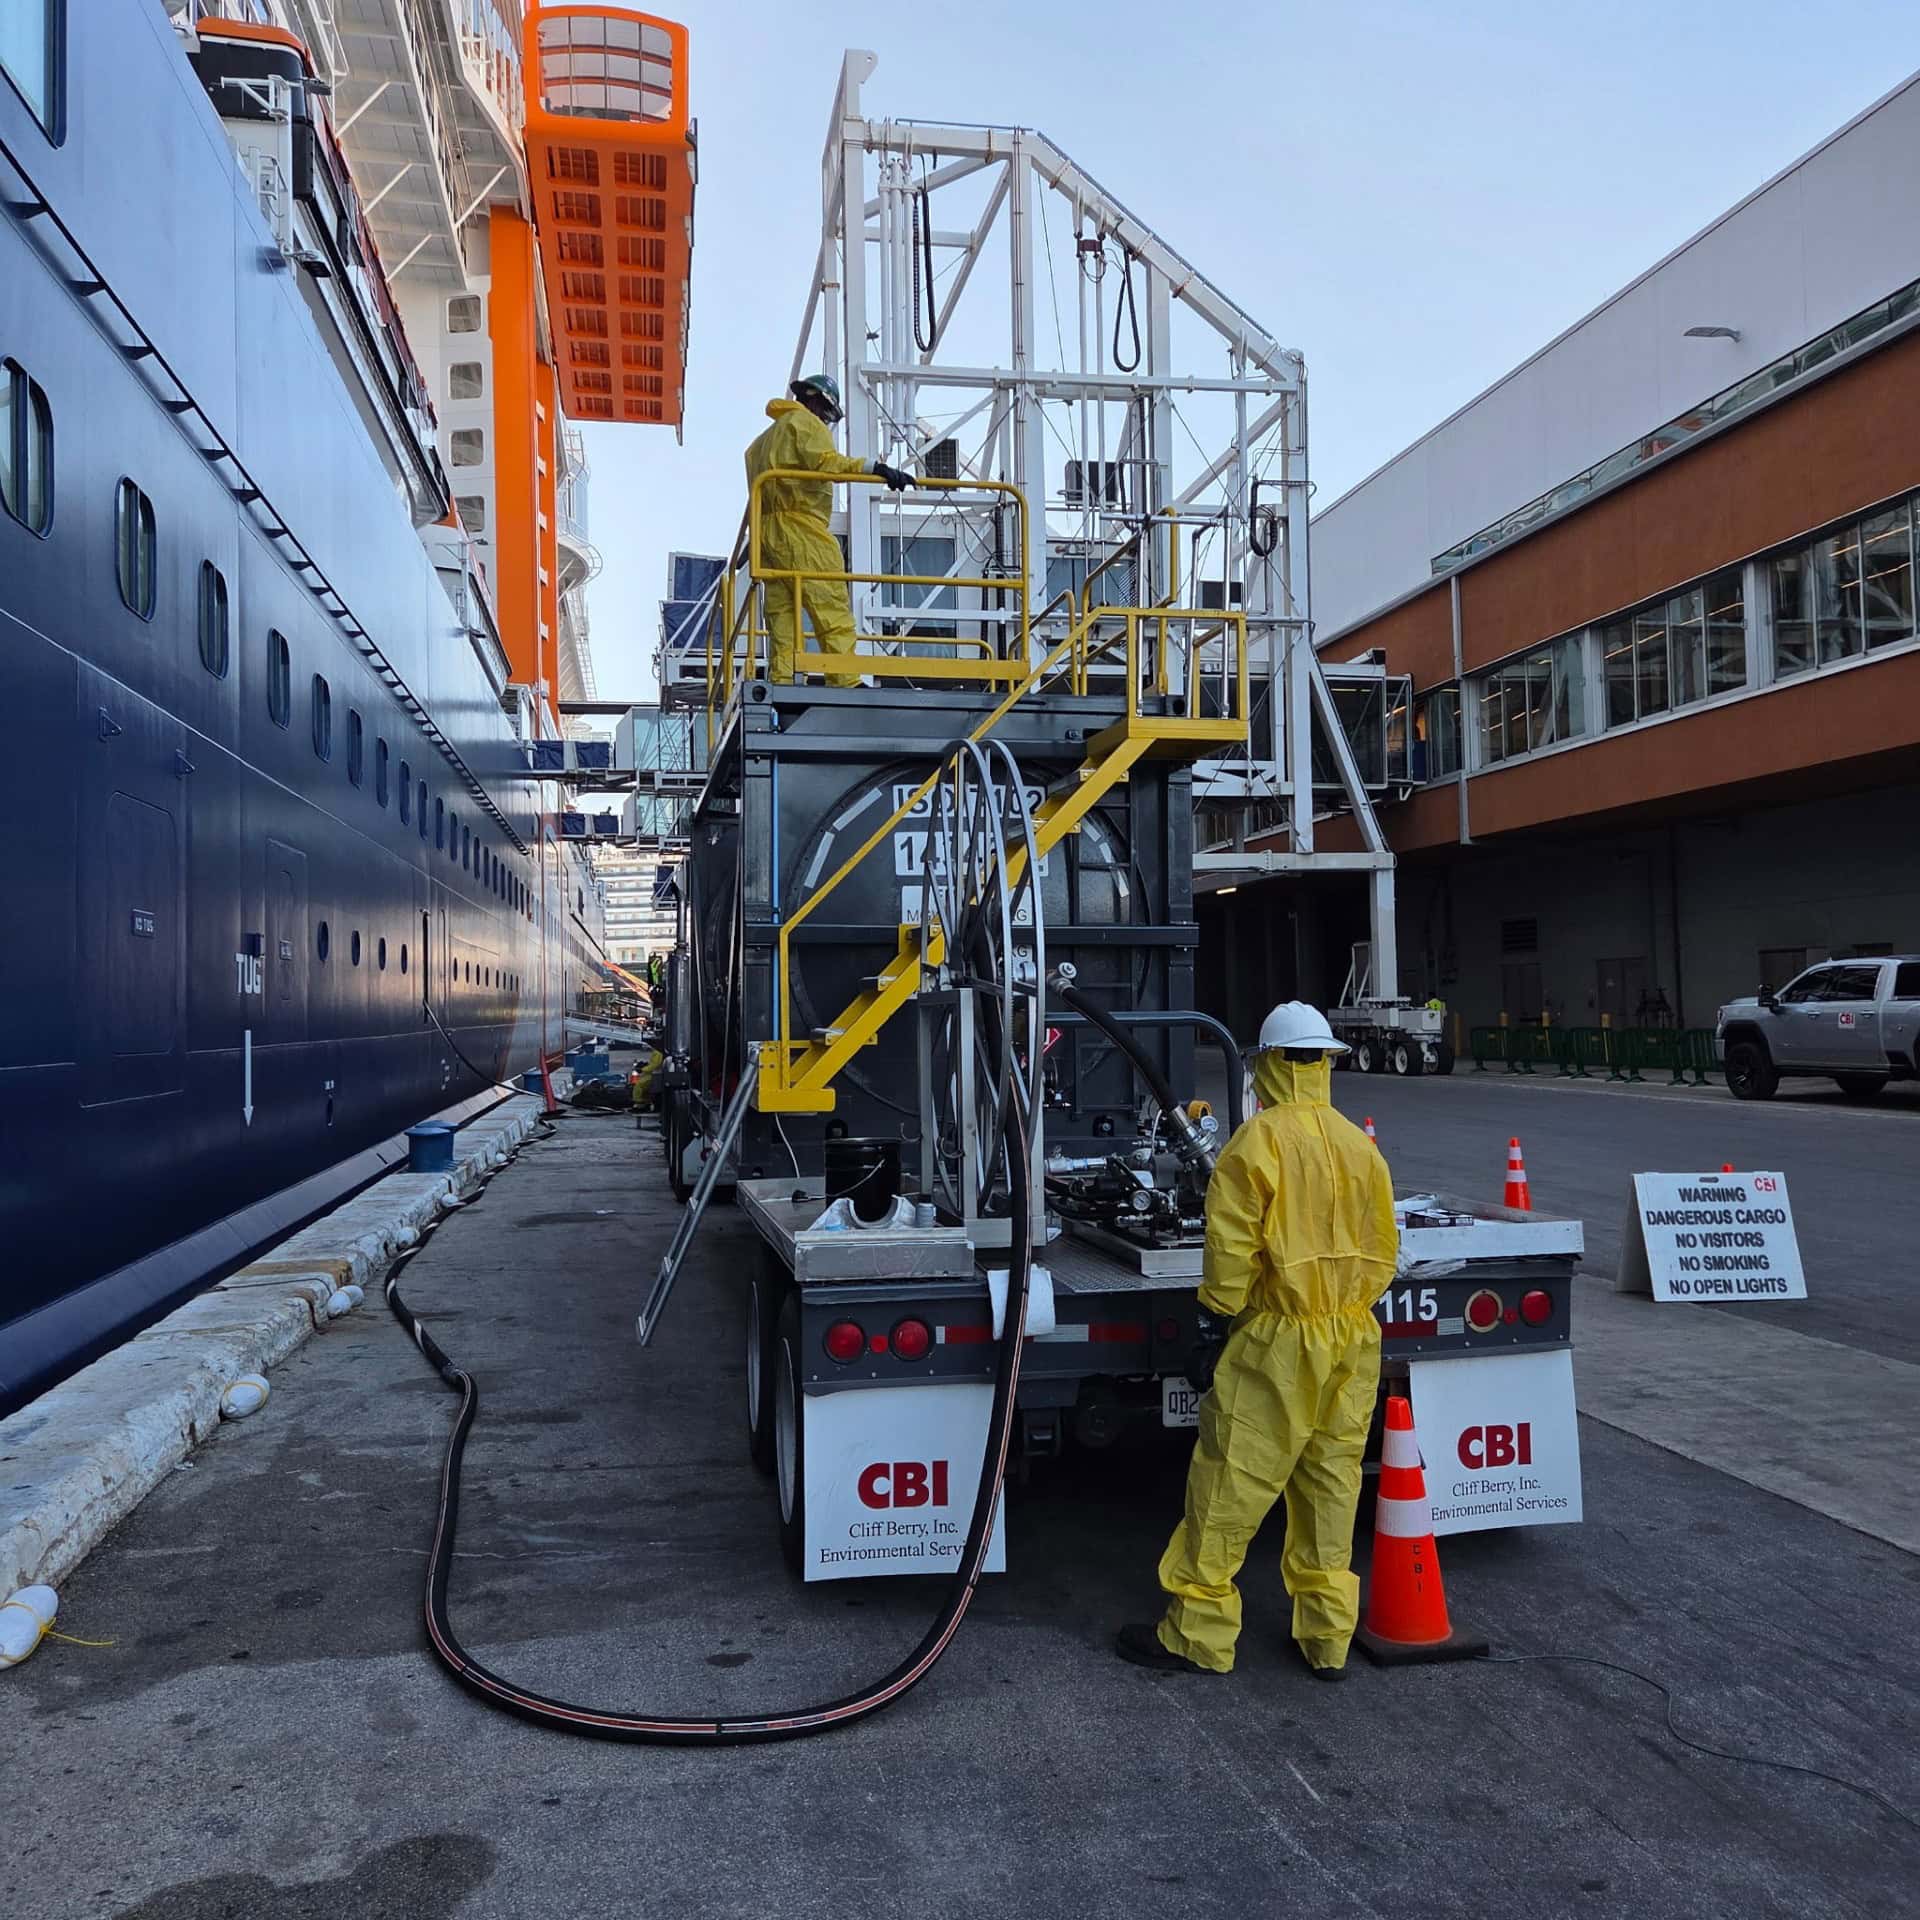
World Kinect Corporation is a global energy management company that provides fuel distribution and logistics services across aviation, marine, and land transportation sectors. The company operates through three reportable segments: aviation, land, and marine. In aviation, it supplies fuel and services such as ground handling, dispatch, and trip support to commercial airlines, cargo carriers, airports, and government entities. The land segment sells liquid fuels, natural gas, and related products to commercial, industrial, and government customers in North America, utilizing a cardlock network. The marine segment markets fuel, lubricants, and services to container, dry bulk, and tanker fleets, as well as cruise lines and yachts, offering procurement management and price risk management. World Kinect also supplies natural gas and sustainability-related products, including sustainable aviation fuel. The company serves customers in the United States and various foreign jurisdictions, acting primarily as a reseller of fuel purchased from suppliers worldwide.

Summarised from the company's own disclosures, fiscal year ended Feb 2026

Industry Oil & Gas Midstream Homepage worldfuel.com
Sector Energy IR page ir.worldfuel.com
Tags
aviation fuel, marine fuel, natural gas, fuel distribution, logistics, trip support, ground handling, bunker supply, cardlock, government defense, sustainable aviation fuel, price risk management, World Fuel
Press page worldfuel.com/news

Metrics

Valuation  
Market cap $ 1.872B
Market cap (USD) $ 1.872B
P/E -12.69
PEG —
P/BV 1.46
P/S 0.04
P/OCF 13.21
P/FCF 22.86
Dividend yield 2.4%
Turnover / mcap —
Returns  
ROE -37.8%
ROI -30.8%
ROIC -21.2%
Profit margin -1.7%
Growth  
Revenue growing No
Profits growing No
Revenue up 3y No
Revenue up 5y No
Earnings growth 3y (net profit CAGR) —
Quality  
Profitable No
Margin expanding No
Buying back stock Yes
Diluting (TTM) No
Debt/Equity 53.7%
Podcast bulls (TTM) Sign up
Podcast bears (TTM) Sign up
Podcast sentiment (TTM) Sign up
Podcast sentiment % (TTM) Sign up
News sentiment (TTM) 33
Quality score -50.0%
Insiders  
Buys, 1w Sign up
Buys, 1m Sign up
Buys, 1y Sign up
Sells, 1w Sign up
Sells, 1m Sign up
Sells, 1y Sign up

Sign up to see this company's insider trades

Figure FY 2025 FY 2024 FY 2023 FY 2022 FY 2021 FY 2020 FY 2019 FY 2018 FY 2017 FY 2016 FY 2015 FY 2014 FY 2013 FY 2012 FY 2011 FY 2010 FY 2009 FY 2008 FY 2007 FY 2006 FY 2005 FY 2004 FY 2003 FY 2001 FY 2000 FY 1999
Revenue 36.917B 42.168B 47.711B 59.043B 31.337B 20.358B 36.819B 39.75B 33.696B 27.016B 30.38B 43.386B 41.562B 38.945B 34.623B 19.131B 11.295B 18.509B 13.73B 10.785B 8.734B — — 1.365B 1.529B 1.2B
Net profit -614.4M 67.4M 52.9M 114.1M 73.7M 109.6M 178.9M 127.7M -170.2M 126.4M 183M 218.407M 207.16M 201.351M 199.202M 146.865M 117.563M 105.039M 64.773M 63.948M 39.609M — — 17.235M 10.634M 9.635M
Free cash flow 227.3M 191.7M 183.7M 59.9M 134M 552.8M 147.9M -254.8M 151.2M 169.1M 396.5M 91.007M 181.586M 117.337M -162.028M -48.183M 71.428M 386.661M -94.508M 47.853M -8.641M — — 32.775M 25.453M 9.142M

Figure FY 2025 FY 2024 FY 2023 FY 2022 FY 2021 FY 2020 FY 2019 FY 2018 FY 2017 FY 2016 FY 2015 FY 2014 FY 2013 FY 2012 FY 2011 FY 2010 FY 2009 FY 2008 FY 2007 FY 2006 FY 2005 FY 2004 FY 2003 FY 2001 FY 2000 FY 1999
Share price 23.43 27.51 22.78 27.33 26.47 31.16 43.42 21.41 28.14 45.91 38.46 46.93 43.16 41.17 42 35.91 26.78 — — — — — — — — —
Price performance 12m -0.15 0.21 -0.17 0.03 -0.15 -0.28 1.03 -0.24 -0.39 0.19 -0.18 0.09 0.05 -0.02 0.17 0.34 — — — — — — — — — —

Filed figures

Figure Dec 2016 Dec 2017 Dec 2018 Dec 2019 Dec 2020 Dec 2021 Dec 2022 Dec 2023 Dec 2024 Dec 2025
Balance sheet detail
Trade receivables (USD) 2.3B 2.71B 2.7B 2.89B 1.24B 2.36B 3.29B 2.74B 2.43B 2.21B
↳ YoY growth +26.9% +17.6% -0.2% +7.1% -57.2% +90.2% +39.9% -17.0% -11.1% -9.2%
↳ 5y CAGR +1.3% +4.3% +1.2% +4.6% -7.3% +0.5% +4.0% +0.3% -3.4% +12.3%
Borrowings, current (USD) 15.4M 25.6M 41.1M 54.1M 22.9M 30.6M 15.8M 78.8M 84M 11.9M
Borrowings, non-current (USD) 1.17B 885M 660M 575M 502M 478M 830M 809M 797M 685M
Lease liabilities (USD) — — — 179M 176M 186M 216M 206M 206M 165M
Cash and deposits (USD) 699M 372M 212M 186M 659M 652M 298M 304M 383M 194M
Intangible assets (USD) 282M 280M 245M 222M 203M 189M 336M 300M 261M 312M
Right-of-use assets (USD) — — — 154M 141M 151M 189M 181M 173M 156M
Net debt (borrowings + leases - cash) (USD) 488M 538M 489M 622M 41.6M 42.6M 763M 789M 704M 669M
Cash flow detail
Operating cash flow (USD) 205M 205M -183M 229M 604M 173M 139M 271M 260M 293M
Purchases of property, plant and equipment (USD) -36.1M -54M -72.3M -80.9M -51.3M -39.2M -78.6M -87.6M -68.2M -65.6M
Change in receivables (cash effect) (USD) -507M -367M -445M -164M 1.3B -1.13B -871M 569M 259M 106M
Change in inventories (cash effect) (USD) -49.5M -43.9M -11.8M -61.3M 251M -135M -252M 187M 133M 1M
Change in payables (cash effect) (USD) 423M 451M 171M 144M -1.22B 1.14B 1.06B -442M -356M -32.6M
Dividends paid (cash effect) (USD) -16.6M -16.3M -16.2M -21.1M -25.6M -28.7M -31M -34M -38.5M -41.3M
Share buybacks (cash effect) (USD) -41.2M -61.9M -20M -65.4M -68.3M -50.5M -48.7M -60.1M -100M -85M
Interest paid (cash effect) (USD) -40.7M -64.9M -73.8M -77M -45.1M -44.4M -113M -130M -114M -106M
Income taxes paid (cash effect) (USD) -37.5M -50.8M -85.3M -82.9M -68.5M -39M -66.6M -61.3M -60.6M -97M
Share-based compensation (USD) 19.2M 21.2M 8.3M 23.6M -900,000 19.6M 17.6M 24.2M 28.1M 25.5M
Operating cash flow before change in receivables (USD) 712M 572M 263M 393M -696M 1.31B 1.01B -298M 800,000 187M
Free cash flow (OCF - PPE - intangibles) (USD) 169M 151M -255M 148M 553M 134M 59.9M 184M 192M 227M
Income detail
Total comprehensive income (USD) 79.5M -141M 123M 164M 123M 70.1M 91.9M 65.5M 126M -538M
Comprehensive income to owners (USD) 77.9M -142M 124M 167M 123M 69.6M 90.2M 64.7M 125M -541M
Provision for credit losses (USD) 15.4M 9.3M 25.1M 25.9M 63.7M 6.3M 7.7M 4.7M 12M 3.9M
Credit cost ratio (credit losses / average receivables) (%) 0.7% 0.4% 0.9% 0.9% 3.1% 0.4% 0.3% 0.2% 0.5% 0.2%
Reported Feb 21, 2017 Feb 28, 2018 Mar 1, 2019 Mar 2, 2020 Mar 1, 2021 Feb 25, 2022 Feb 24, 2023 Feb 23, 2024 Feb 25, 2025 Feb 24, 2026

Sign up to see institutional holdings

Sign Up

Podcast Mentions

Sign up to see podcast mentions and sentiment

Sign Up

October 29, 2026

World Kinect Corporation Reports Third Quarter 2026 Results

October 29, 2026

Download Article

Delivers Strong Third Quarter Results and Raises Fiscal Year 2026 Guidance

MIAMI--(BUSINESS WIRE)--Oct. 29, 2026-- World Kinect Corporation (NYSE: WKC), operating as World Fuel, today reported financial results for the third quarter of 2026.

Third Quarter 2026 Highlights

  • Gross profit of $288 million

  • Adjusted gross profit of $279 million

  • GAAP net income of $38 million, or $0.70 per diluted share

  • Adjusted net income of $51 million, or $0.99 per diluted share

  • Adjusted EBITDA of $127 million

  • Operating cash flow of $175 million and free cash flow of $164 million

Reportable Segment Year-Over-Year Highlights

Aviation Segment

  • Third quarter 2026 gross profit was $148 million, an increase of 4%, primarily attributable to the contribution from the Universal Trip Support Services acquisition that closed in the fourth quarter of 2025 and growth in our core commercial fuel business, principally in Europe and Latin America.

Marine Segment

  • Third quarter 2026 gross profit was $59 million, an increase of 131%, primarily driven by higher profit contribution from our core resale business and certain physical locations, which continue to benefit from increased bunker fuel prices and global supply dynamics.

Land Segment

  • Third quarter 2026 gross profit was $81 million and income from operations was $28 million. Land Adjusted income from operations increased 102% year-over-year, principally reflecting the benefits of our land portfolio transformation and higher contribution from our retail and cardlock operations.

"We delivered another strong quarter, supported by healthy fundamentals in Aviation, strong performance in Marine and continued progress in Land," said Ira M. Birns, Chief Executive Officer. "The actions we have taken to reshape the company are creating a stronger, more focused business, better positioned to deliver improved returns and profitable growth."

"Our third quarter results reflect strong execution across the business and continued improvement in Land," said Mike Tejada, Executive Vice President and Chief Financial Officer. "We generated $164 million of free cash flow during the quarter, further strengthening our financial flexibility to invest in the business and return capital to shareholders."

2026 Outlook

For the full year 2026, Adjusted EPS1 guidance increases to a range of $3.52 to $3.62 per share, from its prior range of $3.20 to $3.40 per share.

| _____________________________________ |

| 1 | Adjusted EPS is a non-GAAP measure that excludes from the corresponding GAAP financial measure of diluted earnings per share the effect of adjustments as described under "Non-GAAP Financial Measures". We have not provided a reconciliation of such non-GAAP guidance to the corresponding GAAP measure because we cannot predict and quantify with a reasonable degree of confidence all of the adjustments that may occur during the period. |

Financial Summary

(Unaudited - in millions, except per share data)

| | | Three Months Ended September 30, | | Nine Months Ended September 30, |

| | | | 2026 | | | | 2025 | | | Change | | | 2026 | | | | 2025 | | | Change |

| Volume (1) | | | 4,038 | | | | 4,283 | | | (6 | )% | | | 11,942 | | | | 12,680 | | | (6 | )% |

| Revenue | | $ | 13,271 | | | $ | 9,392 | | | 41 | % | | $ | 36,547 | | | $ | 27,888 | | | 31 | % |

| Gross profit | | $ | 288 | | | $ | 250 | | | 15 | % | | $ | 924 | | | $ | 712 | | | 30 | % |

| Adjusted gross profit | | $ | 279 | | | $ | 250 | | | 12 | % | | $ | 882 | | | $ | 712 | | | 24 | % |

| Operating expenses | | $ | 208 | | | $ | 187 | | | 11 | % | | $ | 692 | | | $ | 1,001 | | | (31 | )% |

| Adjusted operating expenses | | $ | 176 | | | $ | 181 | | | (3 | )% | | $ | 591 | | | $ | 531 | | | 11 | % |

| Income (loss) from operations | | $ | 80 | | | $ | 63 | | | 27 | % | | $ | 232 | | | $ | (289 | ) | | 180 | % |

| Operating margin | | | 28 | % | | | 25 | % | | | | | 25 | % | | | (41 | )% | | |

| Adjusted income from operations | | $ | 103 | | | $ | 69 | | | 50 | % | | $ | 292 | | | $ | 181 | | | 61 | % |

| Adjusted operating margin | | | 37 | % | | | 27 | % | | | | | 33 | % | | | 25 | % | | |

| Net income (loss) including noncontrolling interest | | $ | 38 | | | $ | 28 | | | 35 | % | | $ | 113 | | | $ | (332 | ) | | 134 | % |

| Adjusted EBITDA | | $ | 127 | | | $ | 94 | | | 35 | % | | $ | 357 | | | $ | 262 | | | 37 | % |

| Diluted earnings (loss) per common share | | $ | 0.70 | | | $ | 0.46 | | | 52 | % | | $ | 2.14 | | | $ | (5.95 | ) | | 136 | % |

| Adjusted EPS | | $ | 0.99 | | | $ | 0.54 | | | 83 | % | | $ | 3.02 | | | $ | 1.60 | | | 89 | % |

| (1) | Includes gallons and gallon equivalents converted as described in the table below. |

Earnings Conference Call

An investor conference call will be held today, October 29, 2026, at 5:00 PM Eastern Time to discuss our third quarter results. Participants can access the live webcast by visiting our website at ir.worldfuel.com. An on-demand replay of the webcast will be available shortly after the call.

About World Fuel

Headquartered in Miami, Florida, we are a leading global provider of aviation, marine and ground-based transportation fuels and complementary services. Through an integrated global supply and logistics network, we source and distribute products and services to meet customer needs across more than 200 countries and territories throughout the world, including lower-carbon fuels to support customers' energy-transition objectives. In the United States, we also market natural gas and related solutions.

Caribbean Peak-Season Planning Bull 0 Bear 0 Routine

Aviation

10/20/2026 | 1 minute read

Caribbean peak-season planning

What we’ll cover

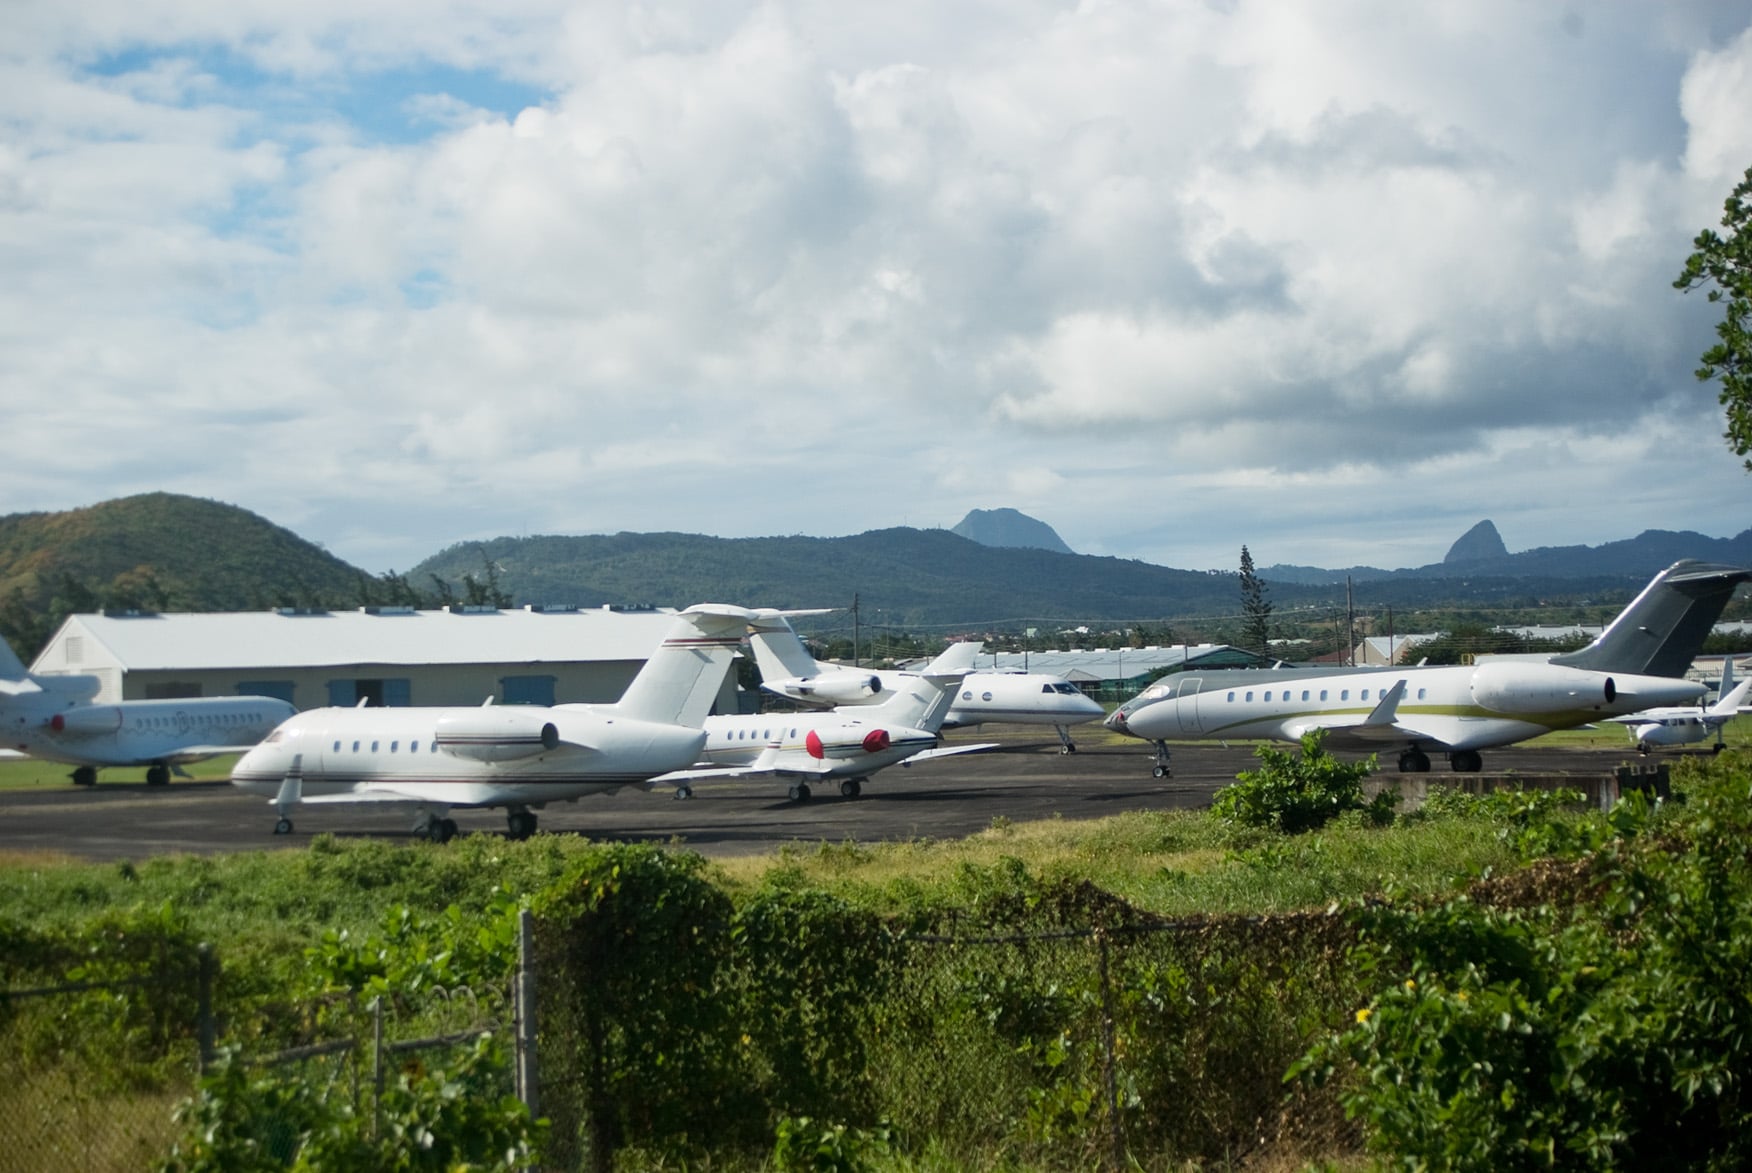
  • Aircraft parking can be limited at popular destinations, even when landing approval is granted.
  • Repositioning options require advance planning for airport restrictions, customs, and operating hours.
  • Peak-season demand can affect ground handling, fuel, transportation, and crew accommodations.

Caribbean peak season brings increased demand for aircraft parking, ground handling, and airport services. From St. Maarten to Grand Cayman, operators may face parking restrictions, repositioning requirements, and additional entry procedures. Explore our 2026–2027 planning guide for airport-specific considerations and practical recommendations.

Read the full article

More on this topic

Aviation

Trip Support Services

Business Aviation

Share

Discover more

View all articles

Aviation

Aviation

Article | October 26, 2026

World Fuel | Universal Trip Support wins fourth consecutive AsBAA trip support award

Read more

Tokyo Haneda Airport

Aviation

Aviation

Article | August 12, 2026

Haneda (RJTT) introducing pilot-based access restrictions

Read more

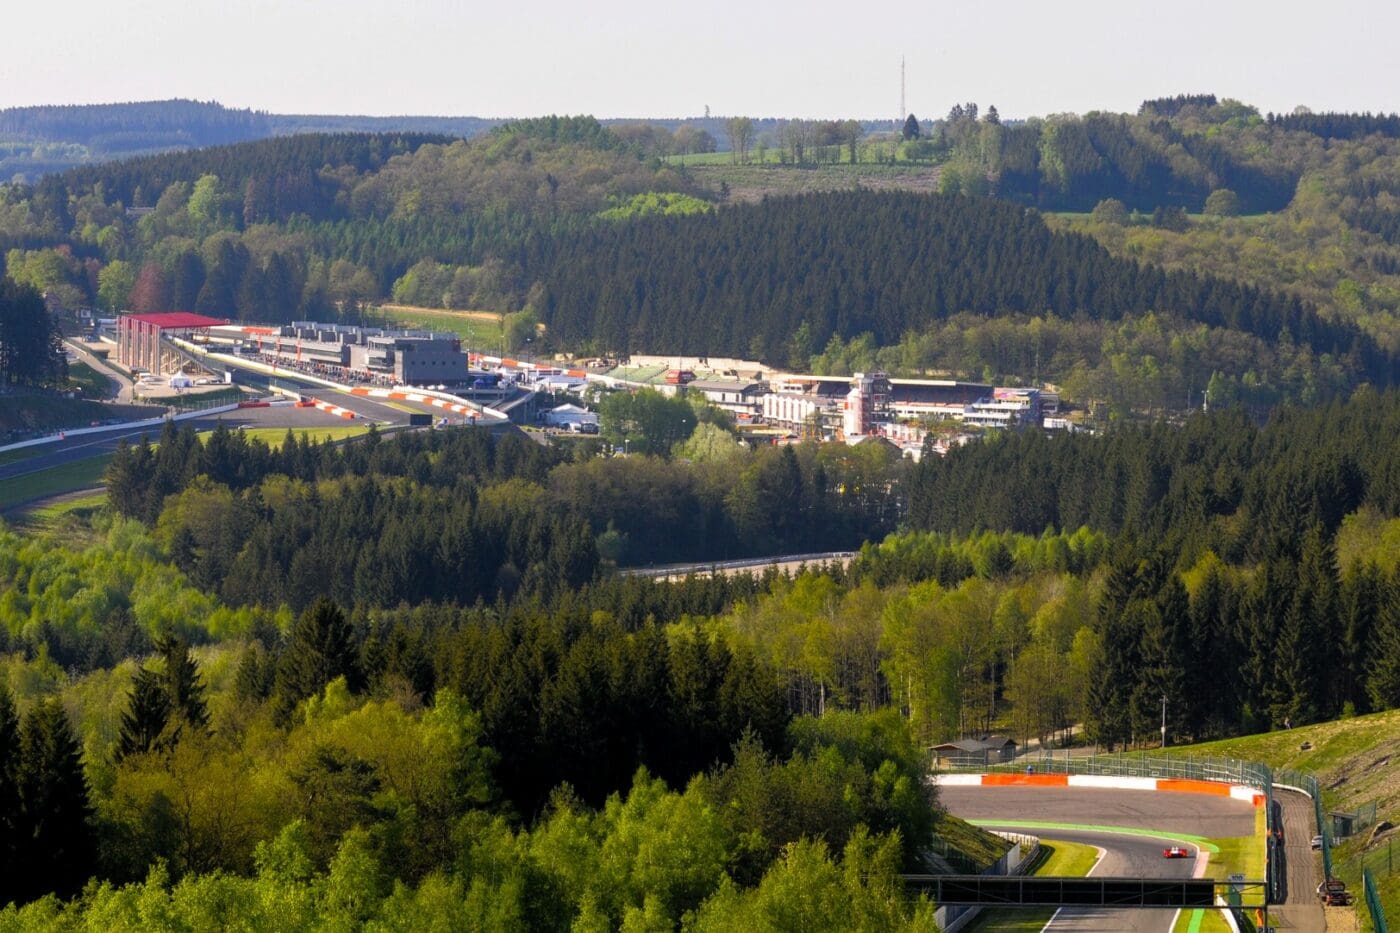
2026 Belgian Grand Prix: Business aviation planning considerations

Aviation

Aviation

Article | July 07, 2026

2026 Belgian Grand Prix: Business aviation planning considerations

Read more

White World Fuel Logo

Contact us

Follow us

Subscribe to newsletter

Join our newsletter to stay up to date on features and releases.

Subscribe

© 2026 World Kinect Corporation.

October 15, 2026

World Fuel to Host Third Quarter 2026 Earnings Conference Call on October 29, 2026

October 15, 2026

Download Article

MIAMI--(BUSINESS WIRE)--Oct. 15, 2026-- World Kinect Corporation (NYSE: WKC), operating as World Fuel, invites you to participate in a conference call with its management team on Thursday, October 29, 2026, at 5:00 p.m. ET to discuss the company's third quarter 2026 results, as well as certain forward-looking information. The company plans to release its third quarter 2026 results after the market closes on the same date.

Participants can access the live webcast by visiting the company’s website at ir.worldfuel.com/events. An on-demand replay of the webcast will be available shortly after the call.

About World Fuel

Headquartered in Miami, Florida, we are a leading global provider of aviation, marine and ground-based transportation fuels and complementary services. Through an integrated global supply and logistics network, we source and distribute products and services to meet customer needs across more than 200 countries and territories throughout the world, including lower-carbon fuels to support customers' energy-transition objectives. In the United States, we also market natural gas and related solutions.

Prompts

World Kinect Corporation (ticker WKC), listed in United States.

Company History

Date Change Detail
Jun 20, 2023 Renamed WORLD FUEL SERVICES CORP → WORLD KINECT CORP
— Former tickers INT

ETFs Holding World Kinect Corporation

ETF Weight in ETF Shares Market value As of
TCV 1.94% 107,907 $ 3.84M Nov 18, 2026
BSMC 1.29% 65,361 $ 2.153M Jun 30, 2026
SYLD 1.18% 294,452 $ 11.737M Jul 31, 2026
MYLD 1.18% 10,029 $ 399.756K Jul 31, 2026
VAMO 1.08% 29,557 $ 1.178M Jul 31, 2026
BUSA 1.07% 96,561 $ 3.181M Jun 30, 2026
ABCS 0.57% 2,006 $ 71.715K Aug 31, 2026
SIXL 0.40% 23,878 $ 830.716K Nov 12, 2026
BSVO 0.39% 263,122 $ 9.37M Nov 18, 2026
FESM 0.38% 675,756 $ 22.259M Jun 30, 2026
SQLV 0.32% 2,752 $ 90.651K Jun 30, 2026
EHLS 0.31% 4,700 $ 169.106K Nov 17, 2026
SMDX 0.20% 6,884 $ 247.686K Nov 17, 2026
DFSV 0.15% 1,201,649 $ 41.805M Nov 12, 2026
VFMF 0.15% 41,132 $ 1.47M Aug 31, 2026
FSCC 0.15% 14,870 $ 531.603K Aug 31, 2026
PSC 0.14% 101,984 $ 3.359M Jun 30, 2026
VFVA 0.14% 37,894 $ 1.355M Aug 31, 2026
AFSM 0.12% 4,852 $ 174.575K Nov 16, 2026
AVSC 0.12% 107,270 $ 3.86M Nov 16, 2026
FSEV 0.09% 180 $ 5,929.20 Jun 30, 2026
VFMO 0.07% 38,700 $ 1.384M Aug 31, 2026
RESM 0.06% 72 $ 2,371.68 Jun 30, 2026
JMEE 0.05% 40,183 $ 1.431M Nov 17, 2026
DFAS 0.05% 438,855 $ 15.268M Nov 12, 2026
AVUV 0.04% 343,906 $ 12.374M Nov 16, 2026
DXUV 0.02% 44,239 $ 1.539M Nov 12, 2026
AVIE 0.02% 100 $ 3,598.00 Nov 16, 2026
DFSU 0.02% 11,747 $ 408.678K Nov 12, 2026
DFAT 0.01% 97,815 $ 3.403M Nov 12, 2026
DFAC 0.01% 263,481 $ 9.167M Nov 12, 2026
DFUV 0.01% 46,953 $ 1.633M Nov 12, 2026
AVUS 0.01% 40,071 $ 1.442M Nov 16, 2026
MSSM 0.01% 1,897 $ 67.818K Aug 31, 2026
DCOR 0.01% 104,952 $ 3.651M Nov 12, 2026
DFAU 0.00% 13,689 $ 476.24K Nov 12, 2026
DFUS 0.00% 15,267 $ 531.139K Nov 12, 2026
EBI 0.00% 10 $ 357.50 Aug 31, 2026