August 11, 2026 BETHESDA, Md.--(BUSINESS WIRE)-- Walker & Dunlop, Inc. announced today that it has arranged $147.5 million in debt and equity capitalization for the construction of 2 South Main, a landmark multi-family residence in downtown Port…
August 11, 2026
BETHESDA, Md.--(BUSINESS WIRE)-- Walker & Dunlop, Inc.
announced today that it has arranged $147.5 million in debt and equity capitalization for the construction of 2 South Main, a landmark multi-family residence in downtown Port Chester, New York. Hyperion Group
and Co-Developer AIP
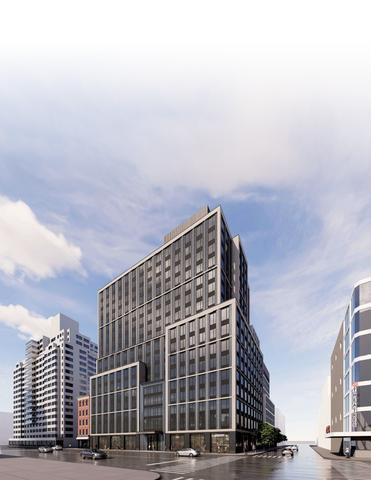
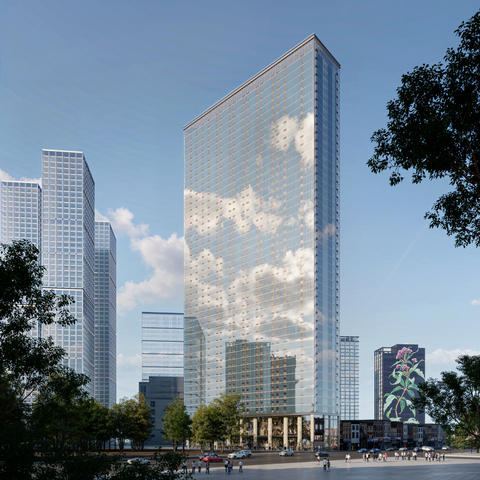
, working with general contractor LRC Construction, will deliver a 12-story, 355,000-square-foot building with 322 residences, state-of-the-art amenities, 330 parking spaces and 5,000 square-feet of retail.
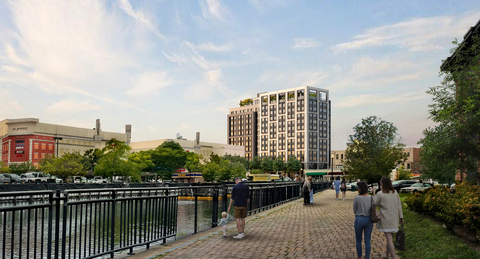
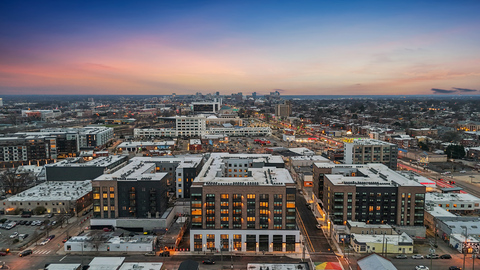
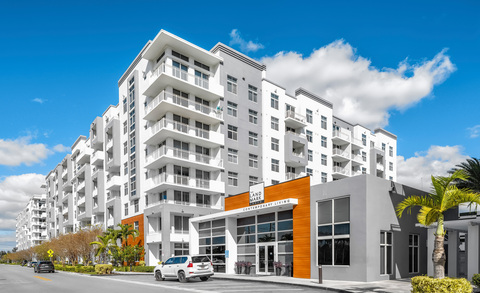
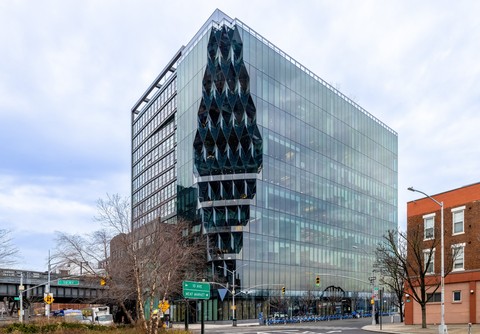
2 South Main. Photo Credits: Hyperion, AIP, Winter, Related Fund Management
Walker & Dunlop Capital Markets served as exclusive advisor to the sponsorship group, a joint venture between Hyperion
, Winter Properties
, and AIP
. Mo Beler
, Jonathan Paine
, Cory Elbaum
, Jackson Irwin
, and Dawson Jessee arranged the equity investment from Related Fund Management, while Aaron Appel
, Jonathan Schwartz
, Adam Schwartz
, Keith Kurland
, Dustin Stolly
, Sean Reimer
, Jordan Casella
, Christopher de Raet
, and Stanley Cayre secured construction financing from Arbor Realty Trust. The project is in an Opportunity Zone and also benefits from a 20-year PILOT agreement through the Port Chester Industrial Development Agency (IDA).
“The successful capitalization of 2 South Main demonstrates the continued demand for well-conceived housing developments that meet both market needs and community priorities,” said Beler, senior managing director of Capital Markets and co-head of Equity & Structured Finance at Walker & Dunlop. “We structured and sourced the project's construction financing and equity investment while leveraging public-sector incentives. This enabled us to deliver a comprehensive capital solution that positions the development for long-term success and supports the continued growth of downtown Port Chester.”
Hyperion
Principal and CEO Robert Vecsler stated, “We are delighted to bring this best-in-class residential community to the most desirable location in the heart of Port Chester, New York.” Vecsler further noted, “2 South Main continues Hyperion’s strategy to identify urban-adjacent residential locations with independent economic and demand drivers. 2 South Main will set the standard for the residential experience in this market, offering state-of-the-art amenities and finishes, walkability to local shops, restaurants and entertainment, and proximity to the Metro-North Station, Westchester employment centers, as well as neighboring cities Rye and Greenwich.”
Located along the Byram River at the Connecticut border, Port Chester is a well-connected Westchester County community with direct Metro-North access to Manhattan. Once a 19th-century manufacturing and port town, it has undergone significant transformation, supported by its cuisine, music, and urban scale intimacy.
“It is an honor to build alongside such an exceptional best-in-class partnership and to help carry forward Port Chester’s strategic downtown vision,” said Scott Allen, founder and CEO of AIP
. “2 South Main isn’t merely a building, it is a new front door and a new future for Liberty Square. Central to AIP’s endeavors are the people and the futures we help shape and 2 South main reflects that: it expands walkability, breathes new life into the street below, elevates urban living, and strengthens connectivity through thoughtful, sustainably focused development.”
The evolution has been supported by deliberate public investment and thoughtful planning. The Village of Port Chester and New York State have prioritized the revitalization of the downtown and waterfront, including the 120 acres surrounding the train station for redevelopment. A form-based zoning code adopted in 2020 established the framework for a transit-oriented development and a more connected, walkable community along the Byram River.
“Arbor Realty Trust is proud to provide construction financing for 2 South Main, a big step forward for a New York neighborhood, through our active and growing Arbor Private Construction (APC) lending program,” said David E. Friedman, executive vice president, chief credit officer, Non-Agency, and head of APC. “The landmark multifamily residence will create hundreds of housing units and advance Arbor’s commitment to enhancing the rental supply in communities across the United States.”
Residents of 2 South Main will enjoy Class-A unrivaled amenities, and with a location adjacent to the MTA Metro-North station Grand Central sits just 45-minutes away. Direct vehicular access to I-95 and I-287 allows access across Westchester County and major employment centers in Stamford, Greenwich, White Plains, and the broader New York metropolitan area. Situated in historic liberty square along Main Street, the property is surrounded by shops, restaurants, the marina, public waterfront park, the capitol theater, and AMC cinema. Rye Beach, fairways of Westchester Country clubs, and the trails of Edith G. Read Natural Park & Wildlife Sanctuary are also within minutes of the property. Construction is expected to begin in the fourth quarter of 2026.
In 2025, Walker & Dunlop’s Capital Markets team sourced over $22 billion from non-Agency capital providers, including nearly $16 billion for multifamily properties. This vast experience has made them a top advisor on all asset classes for many of the industry’s top developers, owners, and operators. To learn more about Walker & Dunlop’s broad financing options, visit our website
.
About Walker & Dunlop
Walker & Dunlop
(NYSE: WD) is one of the largest commercial real estate finance and advisory services firms in the United States and internationally. Our ideas and capital create communities where people live, work, shop, and play. Our innovative people, breadth of our brand, and our technological capabilities make us one of the most insightful and client-focused firms in the commercial real estate industry.
Media:
Nina H. von Waldegg
Public Relations
Phone 301.564.3291
[email protected]
Source: Walker & Dunlop, Inc.
View All News