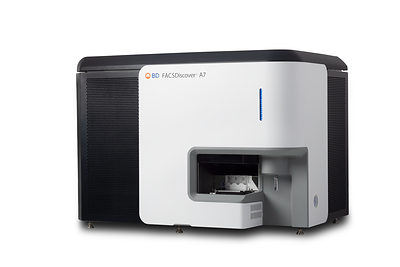
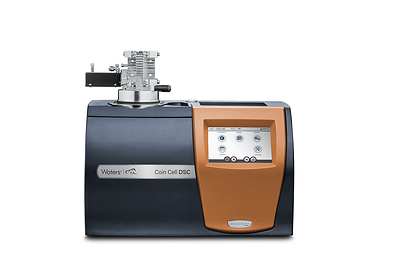
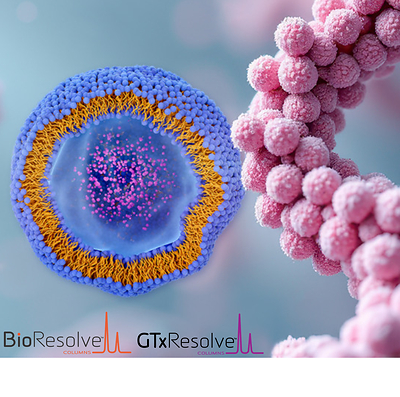
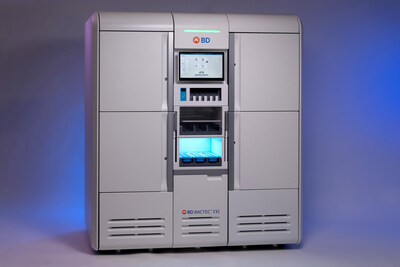
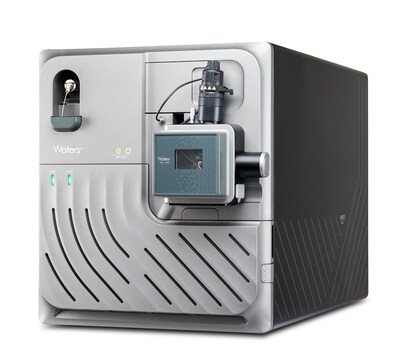
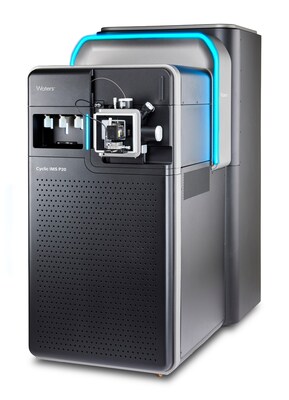
Waters Corporation is a provider of analytical instruments, software, and services for life sciences, materials, and food sciences. The company designs, manufactures, and sells high-performance liquid chromatography (HPLC), ultra-performance liquid chromatography (UPLC), and mass spectrometry (MS) systems, along with chromatography columns, consumables, and post-warranty service plans. Through its TA Instruments division, it offers thermal analysis, rheometry, and calorimetry instruments. Following the acquisition of the Biosciences and Diagnostic Solutions businesses from Becton, Dickinson and Company in 2026, the company also provides flow cytometry instruments, reagents, immunology and cancer research solutions, and in-vitro diagnostic products for infectious disease and cancer detection. Its customer base includes pharmaceutical, clinical, biochemical, industrial, nutritional safety, environmental, academic, and governmental organizations. The company operates through four segments: Waters Analytical Sciences, Waters Biosciences, Waters Advanced Diagnostics, and Waters Materials Sciences. Founded in 1991, the company has expanded its portfolio through acquisitions including TA Instruments, Micromass Limited, and Wyatt Technology.

Summarised from the company's own disclosures, fiscal year ended Feb 2026

Industry Medical Instruments & Supplies Homepage waters.com
Sector Healthcare IR page ir.waters.com/overview/default.aspx
Tags
chromatography, mass spectrometry, thermal analysis, flow cytometry, in-vitro diagnostics, laboratory automation, proteomics, drug discovery, clinical diagnostics, analytical software, TA Instruments, Micromass Limited, Wyatt Technology, ACQUITY UPLC System, BioAccord System, Waters Analytical Sciences, Waters Biosciences, Waters Advanced Diagnostics, Waters Materials Sciences, Waters Technologies Corporation
Press page —

Metrics

Valuation  
Market cap $ 43.18B
Market cap (USD) $ 43.18B
P/E 189.39
PEG —
P/BV 2.82
P/S 7.70
P/OCF 90.04
P/FCF 79.99
Dividend yield —
Turnover / mcap —
Returns  
ROE 29.3%
ROI 16.2%
ROIC 17.2%
Profit margin 20.3%
Growth  
Revenue growing Yes
Profits growing Yes
Revenue up 3y No
Revenue up 5y No
Earnings growth 3y (net profit CAGR) -3.2%
Quality  
Profitable Yes
Margin expanding No
Buying back stock No
Diluting (TTM) Yes
Debt/Equity 29.3%
Podcast bulls (TTM) Sign up
Podcast bears (TTM) Sign up
Podcast sentiment (TTM) Sign up
Podcast sentiment % (TTM) Sign up
News sentiment (TTM) 62
Quality score 5.6%
Insiders  
Buys, 1w Sign up
Buys, 1m Sign up
Buys, 1y Sign up
Sells, 1w Sign up
Sells, 1m Sign up
Sells, 1y Sign up

Sign up to see this company's insider trades

Figure FY 2025 FY 2024 FY 2023 FY 2022 FY 2021 FY 2020 FY 2019 FY 2018 FY 2017 FY 2016 FY 2015 FY 2014 FY 2013 FY 2012 FY 2011 FY 2010 FY 2009 FY 2008 FY 2007 FY 2006 FY 2005 FY 2004 FY 2003 FY 2002 FY 2001 FY 2000
Revenue 3.165B 2.958B 2.956B 2.972B 2.786B 2.365B 2.407B 2.42B 2.309B 2.167B 2.042B 1.989B 1.904B 1.844B 1.851B 1.643B 1.499B 1.575B 1.473B 1.28B 1.158B 1.105B 958.205M 889.967M 859.208M 795.071M
Net profit 642.629M 637.834M 642.234M 707.755M 692.843M 521.571M 592.198M 593.794M 20.311M 521.503M 469.053M 431.62M — — — — 323.313M 322.479M 268.072M 222.2M 201.975M 224.053M 170.891M 147.712M 114.543M 145.342M
Free cash flow 539.81M 619.642M 442.177M 428.205M 579.008M — — — — — — — — — — — — — — — — — — — — —

Figure FY 2025 FY 2024 FY 2023 FY 2022 FY 2021 FY 2020 FY 2019 FY 2018 FY 2017 FY 2016 FY 2015 FY 2014 FY 2013 FY 2012 FY 2011 FY 2010 FY 2009 FY 2008 FY 2007 FY 2006 FY 2005 FY 2004 FY 2003 FY 2002 FY 2001 FY 2000
Share price 379.83 370.98 329.23 342.58 372.6 247.42 233.65 188.65 193.19 134.39 134.58 112.72 100 87.12 74.05 77.7 61.96 36.64 78.48 49.82 — — — — — —
Price performance 12m 0.02 0.13 -0.04 -0.08 0.51 0.06 0.24 -0.02 0.44 -0 0.19 0.13 0.15 0.18 -0.05 0.25 0.69 -0.53 0.58 — — — — — — —

Filed figures

Figure Dec 2016 Dec 2017 Dec 2018 Dec 2019 Dec 2020 Dec 2021 Dec 2022 Dec 2023 Dec 2024 Dec 2025
Balance sheet detail
Trade receivables (USD) 489M 534M 568M 588M 573M 613M 723M 702M 733M 829M
↳ YoY growth +4.5% +9.1% +6.5% +3.4% -2.5% +6.9% +18.0% -2.9% +4.4% +13.0%
↳ 5y CAGR +5.9% +5.7% +5.7% +6.3% +4.1% +4.6% +6.3% +4.3% +4.5% +7.7%
Borrowings, current (USD) 125M 100M 178,000 100M 150M 0.00 — — — —
Borrowings, non-current (USD) 1.7B 1.9B 1.15B 1.58B 1.21B 1.51B 1.52B 2.31B 1.63B 947M
Lease liabilities (USD) — — 100M 94M 96M 87.5M 88.5M 86.8M 75.9M 83.6M
Cash and deposits (USD) 506M 642M 796M 336M 437M 501M 481M 395M 324M 588M
Intangible assets (USD) 207M 228M 247M 240M 259M 242M 227M 629M 568M 558M
Right-of-use assets (USD) — — 100M 93.4M 93.3M 84.7M 86.5M 84.6M 74.2M 80.8M
Net debt (borrowings + leases - cash) (USD) 1.32B 1.36B 352M 1.44B 1.02B 1.1B 1.13B 2B 1.38B 443M
Cash flow detail
Operating cash flow (USD) 629M 698M 604M 643M 791M 747M 612M 603M 762M 653M
Purchases of property, plant and equipment (USD) — — — — — — — -161M -142M -113M
Purchases of intangible assets (USD) — -5M — — — — — — — —
Change in receivables (cash effect) (USD) -31.7M -24M -47.9M -22.2M 37.5M -62.4M -138M 49.2M -66.2M -55.5M
Change in inventories (cash effect) (USD) -20.1M 731,000 -25.4M -31.9M 18.9M -67.3M -102M -45.4M 20.9M -65.9M
Change in payables (cash effect) (USD) 6.84M 3.18M -81.7M 9.78M 141M 46.1M 61M -79.5M 61.6M -89M
Share buybacks (cash effect) (USD) -326M -333M -1.32B -2.47B -196M -649M -626M -70.3M -13.5M -14.7M
Interest paid (cash effect) (USD) -43.6M -56.5M -50.8M -42.8M -52.1M -42.4M -48.1M -94.1M -92.1M -44.6M
Income taxes paid (cash effect) (USD) -50M -70.6M -159M -88M -97.6M -154M -160M -243M -183M -244M
Share-based compensation (USD) 41M 39.4M 37.5M 38.6M 36.9M 29.9M 42.6M 36.9M 44.7M 54.1M
Operating cash flow before change in receivables (USD) 661M 722M 652M 665M 753M 810M 750M 554M 828M 708M
Free cash flow (OCF - PPE - intangibles) (USD) — — — — — — — 442M 620M 540M
Income detail
Research and development expense (USD) 125M 133M 143M 143M 141M 168M 176M 175M 183M 196M
↳ 5y CAGR +6.3% +6.7% +7.4% +5.8% +3.5% +6.1% +5.9% +4.1% +5.1% +6.8%
Total comprehensive income (USD) 452M 127M 586M 591M 523M 699M 678M 650M 617M 672M
Comprehensive income to owners (USD) 452M 127M 586M 591M 523M 699M 678M 650M 617M 672M
Provision for credit losses (USD) 2.37M 3.75M 6.33M 4.7M -9.05M -5.38M -6.51M -8.12M -3.2M -5.83M
Credit cost ratio (credit losses / average receivables) (%) 0.5% 0.7% 1.1% 0.8% 1.6% 0.9% 1.0% 1.1% 0.4% 0.7%
Reported Feb 26, 2019 Feb 26, 2019 May 3, 2019 Feb 25, 2020 Feb 24, 2021 Feb 24, 2022 Feb 27, 2023 Feb 23, 2026 Feb 23, 2026 Feb 23, 2026

Operating KPIs — quarters

KPI Sep 24 Sep 25
Properties 529 542
↳ YoY growth +2.5%
Reported Feb 9, 2026 Feb 9, 2026

Sign up to see institutional holdings

Sign Up

Podcast Mentions

Sign up to see podcast mentions and sentiment

Sign Up

November 3, 2026

  • Download (opens in new window)

  • Adds MOBILion's breakthrough SLIM high-resolution ion mobility technology, which separates molecules by size, shape and charge in milliseconds, complementing Waters' industry leading mass spectrometry platform, transforming samples to insights.

  • Accelerates Waters' move into proteomics with research capabilities built for AI foundation and frontier models, pairing the unique speed and resolution of the Xevo™ MRT MS with data generation at the scale needed to power proteomics lab-in-the-loop research via Anthropic MCP and MHS protocol support.

  • Furthers Waters' ability to take proteomics downstream to clinical applications, creating long-term opportunity to translate protein biomarker discoveries into clinical validation, as well as large-scale, blood-based screening such as for MCED and MRD monitoring.

MILFORD, Mass., Nov. 3, 2026 /PRNewswire/ -- Waters Corporation (NYSE: WAT), a global life sciences and diagnostics leader, today announced that it has acquired MOBILion Systems, Inc., the pioneer of SLIM high-resolution ion mobility separation technology for complex molecular analysis. The acquisition broadens Waters' entry into the proteomics market, pairing SLIM's separation power with Waters' Xevo™ MRT MS speed and resolution enabling superior bottom-up analysis of complex proteomes versus LC-MS alone.

"Today's acquisition gives Waters a unique advantage in proteomics that will define our leadership, first in research and, over time, in the clinic. MOBILion's team brings deep expertise in developing and advancing this technology," said Dr. Udit Batra, President and Chief Executive Officer, Waters Corporation. "Pairing SLIM ion mobility separation with the speed, resolution and sensitivity capabilities of our mass spectrometry portfolio will help scientists better understand complex biology and transform data into actionable insights. It will also enable data generation at the scale AI foundation and frontier models need, opening the door to revolutionizing proteomics with lab-in-the-loop workflows."

Strategic Benefits of the Acquisition

This acquisition accelerates Waters' strategy to enter and drive innovation in the attractive proteomics market, where LCMS proteomics is a $2 billion Total Addressable Market (TAM), growing at a high single-digit rate.1 It creates several benefits:

  • Greater proteome depth through enhanced separation: MOBILion's SLIM (Structures for Lossless Ion Manipulations) technology provides high-resolution ion mobility separation, resolving molecular differences that are difficult to distinguish by liquid chromatography and mass spectrometry alone. Combined with Waters' mass spectroscopy portfolio, SLIM technology is expected to increase proteome coverage, sensitivity and throughput for complex biological samples. Waters' high-end proteomics instruments will drive insights enabling downstream translational studies.

  • High-throughput proteomics for AI-enabled research: SLIM enabled technology will drive insights supporting large cohort studies and high-throughput generation of high-quality data required by foundation and frontier AI models. Through Waters AI Link, which brings Anthropic's Model Context Protocol (MCP) to waters_connect™ Software, and Waters' participation in Anthropic's Model Hardware Standard (MHS) research program, these capabilities support lab-in-the-loop experimentation, in which AI agents help design experiments and autonomously direct instrument operation. The acquisition also brings MOBILion's team and deep ion mobility expertise to Waters.

  • Future translation of discoveries into targeted assays: Using the Xevo TQ Absolute XR tandem quadrupole Mass Spectrometer, which offers industry-leading sensitivity and robustness, the acquisition creates a path from biomarker discovery to targeted biomarker verification and validation in clinical trial cohorts on a single platform as workflows in the waters_connect Platform support method transfer from discovery into development.

  • Longer-term opportunity in blood-based diagnostics: Waters' installed base of mass spectrometers in clinical laboratories provides a foundation for translating validated protein biomarkers into routine, blood-based tests. Over time, this creates test menu expansion opportunity for multiplex diagnostic workflows, serving applications such as Multi-Cancer Early Detection (MCED) and Minimal Residual Disease (MRD) monitoring.

"SLIM was built to see what other separations miss," said Dr. Melissa Sherman, Chief Executive Officer, MOBILion Systems. "Waters is the ideal home for this technology given its rich history of leadership in separation science and mass spectrometry. By bringing our high-resolution ion mobility technology together with Waters' complementary differentiated multi reflecting time of flight technology, we can extend the impact of SLIM and help scientists reveal more meaningful discoveries in proteomics, enabling it to progress from leading research labs into routine testing worldwide."

Financial terms of the transaction were not disclosed.

1 Based on Waters internal analysis and estimates, incorporating consulting data, industry reports and market research.

About MOBILion
MOBILion is a scientific instrumentation company developing innovative ion mobility technologies that advance the separation and characterization of complex molecules. Its differentiated SLIM technology provides a new approach to high-resolution ion mobility separation, helping scientists gain deeper insights from complex samples.

About Waters Corporation 
Waters Corporation  (NYSE: WAT) is a global leader in life sciences and diagnostics, dedicated to accelerating the benefits of pioneering science through analytical technologies, informatics, and service. With a focus on regulated, high-volume testing environments, our innovative portfolio harnesses deep scientific expertise across chemistry, physics, and biology. We collaborate with customers around the world to advance the release of effective, high-quality medicines, ensure the safety of food and water, and drive better patient outcomes by detecting diseases earlier, managing routine infections, and combating antibiotic resistance. Through a shared culture of relentless innovation, our passionate team of ~15,000 colleagues turn scientific challenges into breakthroughs that improve lives worldwide. For more information, please visit www.waters.com/about .

Waters, Xevo, waters_connect, MOBILion and SLIM are trademarks of Waters Corporation or its affiliates. Anthropic is a trademark of Anthropic, PBC. Model Context Protocol is a trademark of LF Projects, LLC.

**Cautionary Statement
**This release contains "forward-looking" statements regarding future results and events, including statements regarding the expected benefits of the transaction. For this purpose, any statements that are not statements of historical fact may be deemed forward-looking statements. Without limiting the foregoing, the words "will," "feels", "believes", "anticipates", "plans", "expects", "intends", "suggests", "appears", "estimates", "projects" and similar expressions, whether in the negative or affirmative, are intended to identify forward-looking statements. Our actual future results may differ significantly from the results discussed in the forward-looking statements within this release for a variety of reasons, including and without limitation, risks or uncertainties related to, and expectations regarding our ability to realize commercial success subsequent to the completion of our acquisition of the Business and other risk factors detailed from time to time in Waters' reports filed with the Securities and Exchange Commission ("SEC"). Such factors and others that are discussed more fully in the sections entitled "Forward-Looking Statements" and "Risk Factors" of Waters' annual report on Form 10-K for the year ended December 31, 2025 as filed with the SEC, which discussions are incorporated by reference in this release, as updated by Waters' subsequent filings with the SEC. The forward-looking statements included in this release represent Waters' estimates or views as of the date of this release and should not be relied upon as representing Waters' estimates or views as of any date subsequent to the date of this release. Except as required by law, Waters does not assume any obligation to update any forward-looking statements.

November 3, 2026

Company to Provide Starting 2027 Growth Framework on Earnings Conference Call

Third Quarter 2026 Highlights

  • Total reported revenue of $1.767 billion exceeded guidance midpoint by $14 million, led by organic revenue growth of 9% as reported and 10% in constant currency, with acquired business revenue landing slightly ahead of guidance.

  • GAAP EPS of $0.82; Adjusted EPS of $4.10 grew 21% and exceeded guidance.

  • Analytical Sciences Division (ASD) grew 8% as reported and 9% in constant currency, led by double-digit instrument and chemistry growth from strong execution, new product innovation, and rising customer testing volume.

  • In the Biosciences Division (WBD), reagents grew high single-digits on a prior year comparable basis, reflecting a 400bps acceleration in year-over-year growth, as research and clinical reagents both grew high single-digits; In the Advanced Diagnostics Division (ADx), microbiology grew mid-single-digits on a prior year comparable basis.

  • The Company is raising every component of its full-year 2026 guidance, including a $43 million increase to total reported revenue at the midpoint, as new growth vectors layer onto a strong foundation of existing demand.

MILFORD, Mass., Nov. 3, 2026 /PRNewswire/ -- Waters Corporation (NYSE: WAT) today announced its financial results for the third quarter of 2026.

Overall Financial Results

The Company's reported revenue for the third quarter of 2026 was $1.767 billion, reflecting $871 million of organic revenue and $896 million of revenue from the acquired Biosciences and Diagnostic Solutions businesses.

Organic revenue for the third quarter of 2026 was $871 million, compared to $800 million for the third quarter of 2025, representing an increase of 9% as reported and 10% in constant currency.

Revenue from Biosciences and Diagnostic Solutions was $896 million for the third quarter of 2026, compared to $885 million on a prior year comparable basis.

On a GAAP basis, the Company reported a diluted earnings per share of $0.82 for the third quarter of 2026, compared to diluted EPS of $2.50 for the third quarter of 2025, reflecting acquisition-related purchase accounting charges, acquisition-related costs, and restructuring costs.

Adjusted EPS for the third quarter of 2026 grew 21% to $4.10, compared to $3.40 for the third quarter of 2025.

"Our team delivered exceptional results led by best-in-class consumables growth across both our Analytical Sciences and Biosciences divisions, as strong execution, new product innovation, and rising customer testing volume accelerated growth," said Dr. Udit Batra, President & Chief Executive Officer, Waters Corporation. "LC-MS instrument growth also strengthened, growing double-digits in constant currency, driven by robust instrument replacement trends, idiosyncratic growth drivers across GLP-1s, PFAS and India generics, and we continued to outperform the market with our leading solutions for complex biologics."

Dr. Batra continued, "Thanks to the hard work of our teams, we are delivering ahead of schedule on our synergy and integration commitments for our acquired businesses. With improving end market conditions and momentum accelerating across the combined company, we are raising our full year 2026 revenue guidance by $43 million at the midpoint and our fourth quarter guidance calls for double digit growth in both our organic and acquired businesses on a days adjusted basis."

Analytical Sciences Division (ASD)

The Analytical Sciences Division – the former Waters Division, excluding the Clinical Business Unit – delivered reported revenue of $703 million in the quarter, compared to $649 million for the third quarter of 2025.

Biosciences Division (WBD)

The Biosciences Division – formerly known as BD Biosciences – delivered reported revenue of $396 million in the quarter, compared to $387 million for the prior year comparable period.

Advanced Diagnostics Division (ADx)

The Advanced Diagnostics Division comprises the former BD Diagnostic Solutions business and the Clinical Business Unit previously reported within Waters Division.

The Diagnostic Solutions business delivered reported revenue of $500 million in the quarter, compared to $498 million for the prior year comparable period. The Clinical Business Unit delivered reported revenue of $75 million in the quarter, compared to $64 million for the third quarter of 2025.

Materials Sciences Division (MSD)

The Materials Sciences Division – formerly known as TA Division – delivered reported revenue of $93 million in the quarter, compared to $87 million for the third quarter of 2025.

A description and reconciliation of GAAP to non-GAAP results appear in the tables below and can be found on the Company's website www.waters.com in the Investor Relations section.

Full-Year and Fourth Quarter 2026 Financial Guidance

Full-Year 2026 Financial Guidance

The Company is raising its full-year 2026 organic constant currency revenue growth guidance to the range of 9.1% to 9.7%. Including the effect of currency translation, full-year 2026 organic reported revenue is expected to be in the range of $3.429 billion to $3.447 billion.

The Company is raising its acquired business revenue expectation and now expects full-year 2026 acquired business reported revenue of approximately $3.050 billion on an owned-period basis.

Total Company reported revenue for full-year 2026 is expected to be in the range of $6.479 billion to $6.497 billion.

The Company is updating its full-year 2026 adjusted EPS guidance to the range of $14.60 to $14.70, which represents 11% to 12% year-over-year adjusted EPS growth and is 13% to 14% on a constant currency basis.

Fourth Quarter 2026 Financial Guidance

The Company expects fourth quarter 2026 organic constant currency revenue growth to be in the range of 7.0% to 9.0%. Including the effect of currency translation, fourth quarter 2026 organic reported revenue is expected to be in the range of $984 million to $1.002 billion.

The Company expects acquired business reported revenue for the fourth quarter of 2026 to be approximately $817 million.

Total Company reported revenue for the fourth quarter of 2026 is expected to be in the range of $1.801 billion to $1.819 billion.

The Company expects fourth quarter 2026 adjusted EPS to be in the range of $4.58 to $4.68, which represents 1% to 3% year-over-year adjusted EPS growth.

Starting 2027 Growth Framework

Management will provide the Company's 2027 starting growth framework during its scheduled earnings conference call today at 8:00 a.m. ET, outlining how reshoring, synergies and AI-related demand drivers are expected to shape next year's growth.

Announcing Acquisition of MOBILion Systems, Inc.

The Company also announced today that it has acquired MOBILion Systems, Inc. MOBILion is the pioneer of SLIM high-resolution ion mobility separation technology for complex molecular analysis, which separates molecules by size, shape and charge in milliseconds. The acquisition complements Waters' industry-leading mass spectrometry portfolio and is expected to broaden the Company's entry into the proteomics market. Additional details are available in a separate release issued earlier today.

Please refer to the tables below for a reconciliation of the projected GAAP to non-GAAP financial outlook for the full-year and fourth quarter. The Company is unable to provide reconciliations of forward-looking presentations of adjusted EPS guidance measures to the most directly comparable GAAP measures. Such reconciliations cannot be prepared without unreasonable efforts due to the inherent difficulty and unpredictability in forecasting and quantifying certain amounts that would be necessary for such reconciliations, including acquisition-related amortization, acquisition and restructuring costs, as well as certain legal, advisory and tax costs, or other costs that may arise, which amounts could be significant and could have a material impact on the Company's future GAAP financial results. All amounts, other than percentages and per share data, are presented in millions of dollars. Certain totals and percentages may not recalculate due to rounding.

Results for the acquired Biosciences and Diagnostic Solutions businesses (the "BDS Businesses") for the prior year comparable period are the quarterly results for the Biosciences and Diagnostic Solutions business units for the three months ended September 30, 2025, as reported in Exhibit 99.1 of the current report on Form 8-K filed by Becton, Dickinson and Company ("BDX") with the Securities and Exchange Commission ("SEC") on November 6, 2025.  This historical financial information reflects the results of operations of these businesses as they were historically managed by BDX in conformity with U.S. GAAP.  Therefore, such historical financial information does not necessarily reflect what these businesses' results of operations would have been had they operated as a part of Waters during the period presented, and does not reflect changes that have occurred since the consummation of the acquisition of these businesses by Waters, including, among other things, changes in the financing, cash management, operations, cost structure and personnel needs or differences in accounting policies.  For example, BDX provided certain services, such as legal, finance, information technology, human resources, and other infrastructure support to the BDS Businesses prior to their acquisition by Waters. Costs of these services were included in the BDS Businesses' results of operations through allocations based upon a proportion of revenue or headcount as determined by BDX in conformity with GAAP. Such allocated costs may not be indicative or necessary if the BDS Businesses operated as a part of Waters during the period presented, nor are they necessarily representative of the costs that may be incurred in the future.

Conference Call Details

Waters Corporation will webcast its third quarter 2026 financial results conference call today, November 3, 2026, at 8:00 a.m. Eastern Time. To listen to the call and see the accompanying slide presentation, please visit www.waters.com , select "Investor Relations" under the "About Waters" section, navigate to "Events & Presentations," and click on the "Webcast." A replay will be available through at least December 1, 2026.

About Waters Corporation

Waters Corporation (NYSE: WAT) is a global leader in life sciences and diagnostics, dedicated to accelerating the benefits of pioneering science through analytical technologies, informatics, and service. With a focus on regulated, high-volume testing environments, our innovative portfolio harnesses deep scientific expertise across chemistry, physics, and biology. We collaborate with customers around the world to advance the release of effective, high-quality medicines, ensure the safety of food and water, and drive better patient outcomes by detecting diseases earlier, managing routine infections, and combating antibiotic resistance. Through a shared culture of relentless innovation, our passionate team of ~15,000 colleagues turn scientific challenges into breakthroughs that improve lives worldwide.

Non-GAAP Financial Measures

This release contains financial measures, such as organic constant currency growth rates, constant currency growth rates, prior year comparable revenue, and adjusted earnings per diluted share, among others, which are considered "non-GAAP" financial measures under applicable SEC rules and regulations. These non-GAAP financial measures should be considered supplemental to, and not a substitute for, financial information prepared in accordance with U.S. generally accepted accounting principles (GAAP). The Company's definitions of these non-GAAP measures may differ from similarly titled measures used by others. The non-GAAP financial measures used in this release adjust for specified items that can be highly variable or difficult to predict. The Company generally uses these non-GAAP financial measures to facilitate management's financial and operational decision-making, including evaluation of the Company's historical operating results, comparison to competitors' operating results and determination of management incentive compensation. These non-GAAP financial measures reflect an additional way of viewing aspects of the Company's operations that, when viewed with GAAP results and the reconciliations to corresponding GAAP financial measures, may provide a more complete understanding of factors and trends affecting the Company's business. Because non-GAAP financial measures exclude the effect of items that will increase or decrease the Company's reported results of operations, management strongly encourages investors to review the Company's consolidated financial statements and publicly filed reports in their entirety. Definitions of the non-GAAP financial measures and reconciliations to the most directly comparable GAAP financial measures are included in the tables accompanying this release.

Cautionary Statement

This release contains "forward-looking" statements regarding future results and events. For this purpose, any statements that are not statements of historical fact may be deemed forward-looking statements. Without limiting the foregoing, the words "feels," "believes," "anticipates," "plans," "expects," "intends," "suggests," "appears," "estimates," "projects," and similar expressions, whether in the negative or affirmative, are intended to identify forward-looking statements. Our actual results may differ significantly from the results discussed in the forward-looking statements within this release for a variety of reasons, including and without limitation, risks or uncertainties related to our acquisition of the Biosciences and Diagnostic Solutions businesses from BDX, including failure to realize the anticipated benefits of this acquisition, including as a result of delay in integrating the BDS Businesses with the Company on the expected timeframe or at all, and the ability of the Company to implement its business strategy and achieve revenue and cost synergies, the anticipated benefits of the MOBILion Systems, Inc. acquisition, anticipated progress on Waters' research programs, development of new analytical instruments and associated software or consumables, manufacturing development and capabilities, our future financial and operational performance, future economic and market conditions, including our expectations about the growth rates of certain markets, our strategic initiatives, including our instrument replacement initiatives, our ability to respond and adapt to changing global dynamics, including the potential impacts of tariffs and supply chain challenges, our ability to retain and attract customers in various geographies and market segments, our market size and growth opportunities, our competitive positioning, projected costs, technological capabilities and plans, and objectives of management, and other risk factors detailed from time to time in Waters' reports filed with the SEC. Such factors and others are discussed more fully in the sections entitled "Forward-Looking Statements" and "Risk Factors" of the Company's annual report on Form 10-K for the year ended December 31, 2025, as filed with the SEC, which discussions are incorporated by reference in this release, as updated by the Company's subsequent filings with the SEC. The forward-looking statements included in this release represent the Company's estimates or views as of the date of this release and should not be relied upon as representing the Company's estimates or views as of any date subsequent to the date of this release. Except as required by law, the Company does not assume any obligation to update any forward-looking statements.

October 28, 2026

  • Download (opens in new window)

  • Advances Waters' strategy to bring trusted AI, ML, and automation capabilities to the 500,000 Empower™ Software users who run the world's regulated chromatography labs and support the release of over 80% of medicines globally

  • AI-Powered Peak Integration transforms chromatography data processing in regulated environments, using AI to reduce manual interventions by up to 95% while delivering 76% greater accuracy and a 72% reduction in user-to-user variability

  • Joins a growing portfolio of premium AI capabilities Waters is building directly into Empower Software, uniquely enabling AI, ML, and automation inside the validated environment where highly protected customer data resides, with no compromise to integrity, traceability, or compliance

MILFORD, Mass., Oct. 28, 2026 /PRNewswire/ -- Waters Corporation (NYSE: WAT) today announced AI-Powered Peak Integration, the next step in its strategy to build intelligent AI, machine learning, and automation cloud-based capabilities directly into Empower Software, the chromatography data system of record for regulated laboratories worldwide.

"Waters is using AI to help customers bring drugs to market faster and to increase the quality testing of manufactured molecules," said Tina Wu, Senior Vice President, Waters Analytical Sciences, Waters Corporation. "Our Empower Software has been the system of record for regulated chromatography for decades, holding terabytes of validated data for each customer, inside their own workflows, and under their own control. The potential behind compliant data at scale is one that no other platform can offer as we enable customers to realize the benefits of AI within their regulated workflows."

Wu continued, "Our customers want the greater speed, accuracy, and productivity that AI brings, without giving up control of their data or the compliant audit trail behind it. That is why it is a central pillar of how we are advancing Empower Software as AI transforms the laboratory. Every one of these premium subscription-based capabilities reaches our large and growing installed base, so each release makes Empower Software more valuable to the laboratories already running it. We have a full pipeline of capabilities ahead as we deliver on our strategy to advance Empower Software into the connected, intelligent platform on which regulated science runs."

Enabling Unique AI Capabilities Customers Can Use Beyond Research in a Deliberate Strategy Developed in Deep Partnership with Pharma

Waters is collaborating with several large pharmaceutical customers and academic institutions to create autonomous, AI-enabled research, development and QA/QC capabilities that follow the molecule, from discovery to release. This builds on two abilities unique to Waters: 1) supporting research workflows and then subsequently moving them directly into compliant settings on a single platform, and 2) enabling AI inside that compliant environment, so customers realize the benefits of AI without giving up control of their data or the compliant audit trail behind it.

The same approach is advancing in biologics, where Waters is applying AI, automation, and analytical instrumentation to bioanalytical characterization, bringing large molecule workflows more closely toward the compliant foundation customers already expect for small molecules.

Turning Decades of Compliant Data into an AI Advantage for Customers

Designed for high-throughput, compliant applications, where consistency and audit traceability are key, Waters Empower AI capabilities drive significant efficiency and productivity gains by reducing manual effort and variability in pharmaceutical late-stage development and manufacturing QC applications, while improving accuracy of results. Because the capabilities are being built directly into Empower Software, they operate inside the validated environment where highly protected customer data already resides, bringing AI and ML directly to the data, with no compromise to integrity, traceability, or compliance.

Using AI to Automate One of the Most Manual Steps in Chromatography

Manual peak integration is the largest source of variability in chromatographic results and one of the most time-consuming steps in data review. Waters' AI/ML-powered peak integration automates this step in Empower Software using artificial intelligence and machine learning trained on each laboratory's own data, removing noise peaks, combining high molecular weight peaks and editing baselines, with explainable outputs that allow analysts to review results quickly and with confidence. Version-controlled, no-drift models maintain consistent performance until the laboratory chooses to retrain and approve a new model.

In a pilot with a large pharmaceutical customer, side-by-side review of 400 chromatograms reduced manual interventions from 90 under current practice to 4 with AI/ML-powered peak integration, a 95% reduction.1 User testing also showed 50% faster review and 72% lower user-to-user variability, reducing analyst bias and supporting data integrity.2

AI-Powered Peak Integration is a new premium tier capability available to customers on subscription. Waters is enrolling customers now for early access beginning in December 2026, with validated, compliant deployment to follow in mid-2027.

Building on AI-Powered Anomaly Detection, Launched in 2025

Peak integration is the latest step in Waters' strategy to make Empower Software the connected, intelligent platform on which regulated science runs. The first was AI/ML Anomaly Detection, launched in Empower Software in February 2025, which uses machine learning to compare target results across chromatography data, surface deviations for review, and explain the attributes contributing to each anomaly.

About Waters Corporation:

Waters Corporation (NYSE: WAT) is a global leader in life sciences and diagnostics, dedicated to accelerating the benefits of pioneering science through analytical technologies, informatics, and service. With a focus on regulated, high-volume testing environments, our innovative portfolio harnesses deep scientific expertise across chemistry, physics, and biology. We collaborate with customers around the world to advance the release of effective, high-quality medicines, ensure the safety of food and water, and drive better patient outcomes by detecting diseases earlier, managing routine infections, and combating antibiotic resistance. Through a shared culture of relentless innovation, our passionate team of ~15,000 colleagues turn scientific challenges into breakthroughs that improve lives worldwide. For more information, please visit www.waters.com/about .

Waters and Empower are trademarks of Waters Corporation or its affiliates.

References:

  1. Waters internal pilot study with a global pharmaceutical partner, 2025. Data on file, Waters Corporation.
  2. Waters Immerse Research Lab customer evaluation, 2026. Data on file, Waters Corporation.

Prompts

Waters Corporation (ticker WAT), listed in United States.

ETFs Holding Waters Corporation

ETF Weight in ETF Shares Market value As of
TMFM 3.84% 11,040 $ 4.578M Aug 31, 2026
EQTY 3.73% 140,842 $ 53.141M Jul 31, 2026
TOLL 2.28% 3,221 $ 1.336M Aug 31, 2026
BGRO 2.25% 433 $ 196.331K Nov 16, 2026
BMED 2.25% 710 $ 321.928K Nov 16, 2026
TMFG 2.12% 18,140 $ 7.521M Aug 31, 2026
NLSI short -2.08% -215 $ -94.469K Sep 30, 2026
TMED 1.68% 1,034 $ 387.791K Jun 30, 2026
MMID 1.65% 1,442 $ 597.896K Aug 31, 2026
PSET 1.38% 1,058 $ 396.792K Jun 30, 2026
MFSG 1.32% 12,066 $ 5.003M Aug 31, 2026
TCAL 1.30% 9,502 $ 4.308M Nov 17, 2026
TCAF 1.26% 300,355 $ 136.187M Nov 17, 2026
MKTN short -1.21% -3,449 $ -1.294M Jun 30, 2026
LCLG 0.98% 2,812 $ 1.061M Jul 31, 2026
TMAT 0.95% 5,971 $ 2.253M Jul 31, 2026
FPAG 0.86% 12,424 $ 4.659M Jun 30, 2026
CLSE short -0.76% -16,547.0003 $ -6.861M Aug 31, 2026
LRGC 0.64% 20,528 $ 8.512M Aug 31, 2026
FEGE 0.57% 34,469 $ 14.292M Aug 31, 2026
TVAL 0.49% 12,448 $ 5.644M Nov 17, 2026
AVMC 0.45% 5,487 $ 2.488M Nov 16, 2026
NQLT 0.34% 406 $ 168.34K Aug 31, 2026
HELO 0.32% 33,545 $ 15.088M Nov 17, 2026
IALT short -0.30% -52,065 $ -23.607M Nov 16, 2026
NBCR 0.26% 5,246 $ 2.175M Aug 31, 2026
CDX 0.25% 1,393.2312 $ 626.648K Nov 17, 2026
BDYN 0.24% 16,001 $ 7.255M Nov 16, 2026
CAPE 0.17% 1,070 $ 401.293K Jun 30, 2026
JSTC 0.16% 1,061 $ 481.079K Nov 17, 2026
DFVX 0.15% 1,913 $ 884.189K Nov 12, 2026
JUSA 0.15% 2,890 $ 1.3M Nov 17, 2026
DFLV 0.15% 24,676 $ 11.405M Nov 12, 2026
DFUV 0.13% 45,320 $ 20.947M Nov 12, 2026
HBTA 0.13% 770 $ 319.265K Aug 31, 2026
MODL 0.11% 2,964 $ 1.112M Jun 30, 2026
DFAC 0.10% 193,059 $ 89.232M Nov 12, 2026
XMAG 0.10% 463 $ 213.999K Nov 13, 2026
DFSU 0.10% 5,082 $ 2.349M Nov 12, 2026
AVSU 0.08% 828 $ 375.432K Nov 16, 2026
DFAU 0.07% 20,498 $ 9.474M Nov 12, 2026
DCOR 0.07% 68,749 $ 31.776M Nov 12, 2026
DFUS 0.07% 31,388 $ 14.508M Nov 12, 2026
DXUV 0.06% 8,253 $ 3.815M Nov 12, 2026
GEW 0.06% 194 $ 80.438K Aug 31, 2026
AVLC 0.06% 2,236 $ 1.014M Nov 16, 2026
LCTU 0.06% 1,458 $ 661.086K Nov 16, 2026
AAUS 0.06% 669 $ 300K Nov 18, 2026
TACU 0.06% 24 $ 10.882K Nov 17, 2026
VOXP 0.06% 9 $ 3,395.79 Jul 31, 2026
NTSD 0.05% 52 $ 19.502K Jun 30, 2026
GDE 0.05% 588 $ 243.802K Aug 31, 2026
NTSX 0.05% 1,729 $ 648.444K Jun 30, 2026
HCMT 0.05% 684 $ 258.08K Jul 31, 2026
AVUS 0.04% 13,995 $ 6.346M Nov 16, 2026
THRO 0.04% 9,731 $ 4.412M Nov 16, 2026
MSLC 0.04% 3,795 $ 1.574M Aug 31, 2026
APUE 0.04% 2,275 $ 943.283K Aug 31, 2026
VSLU 0.04% 547 $ 205.147K Jun 30, 2026
DUHP 0.03% 13,973 $ 6.458M Nov 12, 2026
ACVF 0.03% 107 $ 40.372K Jul 31, 2026
CSHP 0.02% 203 $ 92.044K Nov 16, 2026
AVUQ 0.02% 168 $ 76.175K Nov 16, 2026
GSPY 0.02% 313 $ 141.92K Nov 17, 2026
EBI 0.00% 6 $ 2,487.76 Aug 31, 2026
CORO 0.00% 62 $ 28.095K Nov 16, 2026
INRO 0.00% 59 $ 26.752K Nov 16, 2026
NTRL short 0.00% -349 $ 0.00 Nov 16, 2026