Revenue increases 124% year-over-year and 68% sequentially; Raises full-year 2026 revenue guidance to $285 million–$305 million DENVER–(BUSINESS WIRE)– Voyager Technologies, Inc. [NYSE: VOYG] (“Voyager” or the “Company”) today announced financial…
Revenue increases 124% year-over-year and 68% sequentially; Raises full-year 2026 revenue guidance to $285 million–$305 million
DENVER–(BUSINESS WIRE)–
Voyager Technologies, Inc. [NYSE: VOYG] (“Voyager” or the “Company”) today announced financial results for the third quarter 2026.
Financial Performance Highlights
- Record backlog of $742 million, increasing 293% year-over-year and 121% sequentially, including $347 million added due to the Astrobotic acquisition
- Record quarterly revenue of $89 million, increasing 124% year-over-year
- Record quarterly bookings of $116 million, increasing 135% year-over-year, resulting in a 1.3x Book-to-Bill ratio
- Strong financial position with $815.7 million in total liquidity at quarter-end, including $553.6 million in cash and cash equivalents
Business Highlights
- Announced Anduril strategic partnership to deliver advanced defense technologies
- Awarded multi-million dollar contract for agentic AI spectrum operations platform
- Secured $298 million NASA award through Astrobotic, expanding lunar backlog
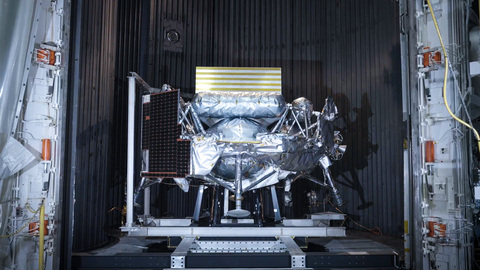
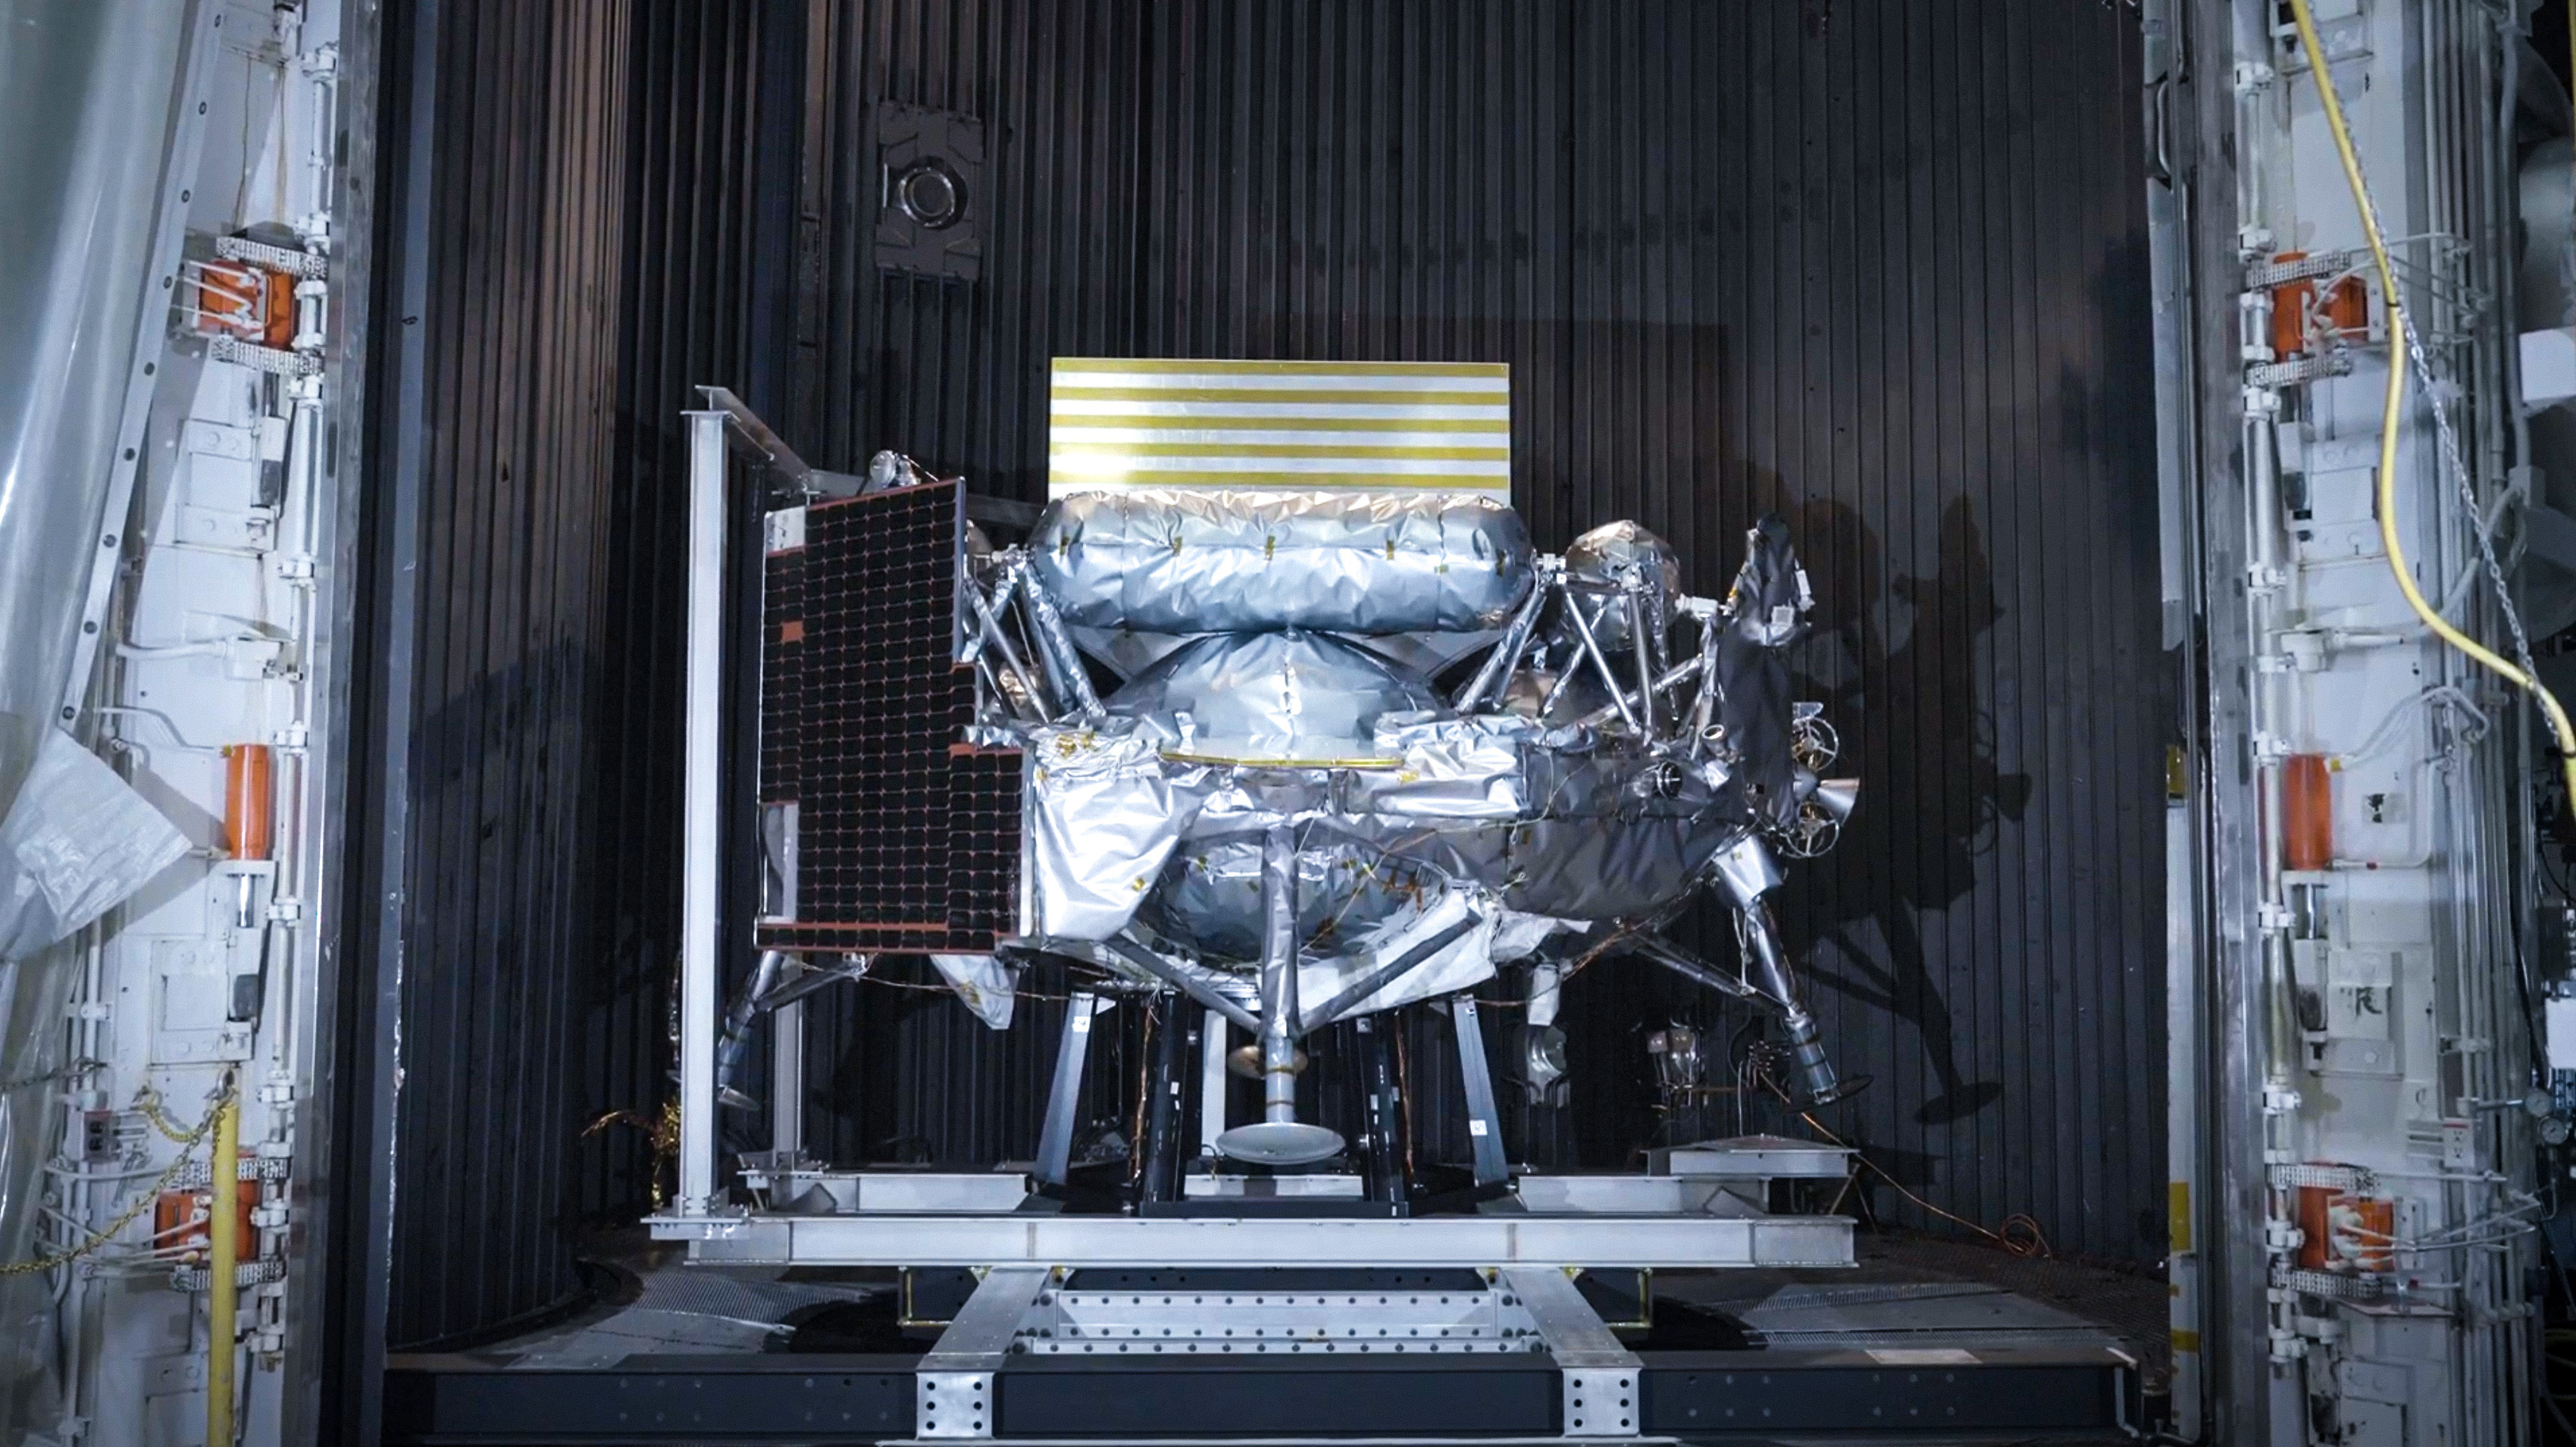
- Completed Griffin-1 acceptance testing, advancing preparations for late-2026 launch
- Awarded multiple biopharmaceutical research mission management contracts to the International Space Station, reflecting growing commercial demand
- NASA released Commercial LEO Destination Phase 2 RFP, marking the next major milestone in the program
- Appointed General B. Chance Saltzman, U.S. Space Force (Ret.), as Chairman of Voyager’s Board of Advisors to provide strategic counsel across the Company’s space and defense efforts
“Voyager delivered another exceptional quarter, achieving record revenue, record bookings and record backlog, driven by accelerating demand for our technologies and exceptional execution,” said Dylan Taylor, Chairman and CEO of Voyager Technologies. “Our record backlog provides meaningful multi-year revenue visibility and raising our full-year guidance reflects this momentum.”
“Voyager has emerged as a differentiated technology platform at the convergence of defense, national security and space, investing ahead of demand to scale the capabilities and capacity our customers need,” continued Taylor. “Supported by a strong balance sheet, and growing customer commitments, we are well positioned to deliver sustained growth and substantial shareholder value.”
Business and Financial Performance Results
Record bookings and backlog strengthen revenue visibility
Voyager generated $116 million in bookings during the third quarter – the strongest bookings quarter in Company history. The result compares with $49 million in the third quarter of 2025, representing year-over-year growth of approximately 135%. Trailing twelve-month bookings reached $329 million.
The Company ended the third quarter with a record $742 million in backlog, compared with $336 million at June 30, 2026, and $266 million at December 31, 2025.
The combination of continued bookings momentum and a substantially expanded backlog, including contributions from the Astrobotic acquisition, strengthens Voyager’s visibility into future revenue and supports its growth trajectory into 2027 and beyond.
Revenue growth accelerates achieving new record level
Voyager generated $89 million in net sales during the third quarter of 2026, a year-over-year increase of 124% and 68% sequentially from the second quarter. For the nine months ended September 30, 2026, net sales totaled $177 million, an increase of 48% year-over-year, reflecting increasing demand for defense and national security solutions and contributions from recent acquisitions, partially offset by the wind-down of lower-margin space service contracts.
Gross profit increases with revenue growth
Gross profit increased to $10.2 million in the third quarter of 2026, compared with $6.1 million in the prior-year period, reflecting higher revenue across the Company’s expanding portfolio. Gross margin was 11.5%, compared with 15.4% in the prior-year period, primarily reflecting investments in manufacturing capacity and strategic programs to support customer demand across defense, national security and space markets.
Sequentially, gross margin improved by 310 basis points compared with the second quarter of 2026, reflecting the favorable impact of revenue growth driven operating leverage.
Voyager remains focused on improving manufacturing efficiency, program execution and operating leverage as revenue continues to scale.
Advancing Starlab’s long-term opportunity
Voyager continued to advance the development and commercialization of Starlab, its next-generation commercial space station initiative. As of September 30, 2026, Starlab had achieved 39 milestones and generated $212.5 million in cumulative milestone cash receipts since inception, including $1.5 million during the third quarter. The program has approximately $700 million in signed commercial reservations, up from approximately $500 million reported last quarter.
In early October, NASA released its Commercial LEO Destination (CLD) Phase 2 Request for Proposals, with submissions due in December 2026 and an award anticipated in spring 2027. This milestone marks a significant advancement in NASA’s transition toward commercial space stations and represents a potential catalyst for Starlab’s next phase of development, commercialization and long-term growth.
Strategic innovation investments support long-term growth
Voyager continues to invest in differentiated technologies that address evolving defense and space requirements, including AI, advanced propulsion, resilient space architectures and mission-critical electronics.
For the third quarter of 2026, innovation spend (including customer-funded development activities) was 36.9% of net sales, excluding Starlab, and 49.3% on a consolidated basis – see Table 5 for additional details.
These investments support the expansion of Voyager’s technology portfolio and long-term growth opportunities, while management remains focused on balancing innovation with operating discipline and improved profitability as the business scales.
Financial results and continued investment
Voyager continues to invest in technology development, manufacturing capacity and strategic programs to support customer demand across defense, national security and space markets. For the third quarter of 2026, we reported a net loss attributable to Voyager Technologies, Inc. of $(55.7) million, or $(0.91) per share, and a non-GAAP adjusted loss of $(52.8) million , or $(0.87) per share. Non-GAAP Adjusted EBITDA loss was $(44.9) million.
The increase in operating losses primarily reflects increased investment in technology development, expanded operational capabilities and the integration of acquired businesses. Management remains focused on driving operating efficiencies and improving profitability as the Company scales.
Strong financial position
Voyager ended the quarter with $553.6 million in cash and cash equivalents and total liquidity of $815.7 million, including $262.1 million of available revolver capacity, against $841.1 million of convertible notes, net. Our financial position provides significant flexibility to fund strategic growth initiatives, support program execution and invest in innovation while maintaining disciplined capital management.
Business Outlook
Voyager is raising the lower end of its full-year 2026 revenue guidance by $10 million to a revised range of $285 million–$305 million, representing expected year-over-year growth of approximately 72%–84%. The increased outlook reflects strong third-quarter performance, continued bookings momentum and growing visibility from the Company’s record backlog, reinforcing management’s confidence in its growth trajectory.
The foregoing estimates are forward-looking and reflect management’s view of current and future market conditions, subject to certain risks and uncertainties, including certain assumptions with respect to our ability to efficiently and on a timely basis integrate acquisitions, obtain and retain contracts, changes in the timing and/or amount of government spending, react to changes in the demand for our products, activities of competitors, changes in the regulatory environment, and general economic and business conditions in the United States and elsewhere in the world. Investors are reminded that actual results may differ materially from these estimates and investors should review all risks related to achievement of the guidance reflected under “forward-looking statements” below and in the Company’s filings with the Securities and Exchange Commission.
Conference Call and Live Webcast
Voyager Technologies, Inc. will host its third quarter 2026 earnings conference call Tuesday, November 3, 2026, at 9 a.m. ET. Hosting the call to review results will be Dylan Taylor, Chairman & Chief Executive Officer, and Phil De Sousa, Chief Financial Officer.
A live webcast of the call will be made available on the Events & Presentations section of Voyager’s Investor Relations website at investors.voyagertechnologies.com. The earnings release and presentation will be posted to the Investor Relations website prior to the call.
A replay of the call will be available approximately one hour after the call through the archived webcast on the Events & Presentations section of Voyager’s Investor Relations website.
Audio Replay
An audio replay of the event will be archived on the Investor Relations section of the Company’s website at https://investors.voyagertechnologies.com
.
About Voyager Technologies, Inc.
Voyager Technologies is a defense technology and space solutions company that enables mission-ready systems that secure today and power what’s next for the U.S. and partner nations. From propulsion and energetics to advanced electronics, mission management and space exploration, Voyager delivers capabilities that protect national security, reinforce the industrial base and expand human presence beyond Earth. For more information visit: voyagertechnologies.com
and follow on LinkedIn and X.
Non-GAAP Financial Measures
Non-GAAP financial measures are not calculated or presented in accordance with GAAP and other companies in our industry may calculate them differently than we do. As a result, non-GAAP financial measures have limitations as analytical and comparative tools and you should not consider them in isolation, or as a substitute, for analysis of our results as reported under GAAP. In addition, in evaluating Adjusted EBITDA, adjusted loss per share and free cash flow, you should be aware that in the future we may incur expenses similar to those eliminated in this press release. Our presentation of Adjusted EBITDA, adjusted loss per share and free cash flow should not be construed as an inference that our future results will be unaffected by unusual items. Management compensates for these limitations by primarily relying on our GAAP results in addition to using Adjusted EBITDA, adjusted loss per share and free cash flow supplementally.
Adjusted EBITDA
We consider Adjusted EBITDA to be a useful, supplemental, measure of our operating performance. We use Adjusted EBITDA to supplement GAAP measures in evaluating the performance of our business and the effectiveness of our strategies, to make budgeting decisions, make certain compensation decisions, and to compare our performance against that of our peer companies, many of which present similar non-GAAP financial measures.
In addition, we believe Adjusted EBITDA provides a useful measure for period-to-period comparisons of our business, as it removes the impact of our capital structure and other items not indicative of our core operating performance from operating results.
We define EBITDA as net loss attributable to Voyager Technologies, Inc. plus (less) finance and interest expense, provision for income tax expense (benefit), and depreciation and amortization. We define Adjusted EBITDA as EBITDA adjusted for stock-based compensation, business acquisition costs, restructuring charges, impairment losses, income (loss) attributable to noncontrolling interests, interest income, and other items we do not believe are indicative of our core operating performance, including incremental organizational costs attributable to our initial public offering, changes in the fair value of earnout liabilities, and foreign exchange gain/loss.
Free Cash Flow
We consider free cash flow to be a useful, supplemental measure of our ability to generate cash on a normalized basis. We use free cash flow to supplement GAAP measures in evaluating our flexibility to allocate capital and pursue opportunities that may enhance shareholder value and the effectiveness of our strategies, to make budgeting decisions and to compare our performance against that of our peer companies, many of which present similar non-GAAP financial measures.
We believe that while expenditures and dispositions of property and equipment will fluctuate on a period-to-period basis, we seek to ensure that we have adequate capital on hand to maintain ongoing operations and enable growth of the business. Additionally, free cash flow is of limited usefulness in that it does not represent residual cash flows available for discretionary expenditures due to the fact the measures do not deduct the payments required for debt service and other contractual obligations or payments.
We define free cash flow as the sum of our cash (used in) provided by operating activities less our net capital expenditures. The net capital expenditures of the Company are defined as the gross capital expenditures for the purchase of property and equipment less the grant funding we received in order to make such purchases. Based on the nature of government grants for purposes of funding capital expenditures on our Starlab program or other government funded capital expenditure programs, these grants are pass through for purposes of making capital expenditures as they are directly used to source funding on capital expenditures. Our calculation of free cash flow may not be comparable to the calculation of similarly titled measures reported by other companies.
Adjusted Net Loss Per Share
We consider adjusted net loss per share to be a useful, supplemental measure of our operations on a per share basis adjusting for items that are considered either non-operational or significant infrequent expenses or that are sources of income that are not recurring to the business on a frequent basis. We define adjusted net loss per share as the net income/loss attributable to common stockholders adjusted for stock-based compensation, business acquisition costs, restructuring, deferred income tax (benefit) expense, and other items mainly related to financing expenses and other individually immaterial items divided by our diluted basis number of weighted average shares outstanding during the period. Since the adjustments made for presentational purposes do not impact the tax basis of the Company, the adjustments have been presented on a tax free basis.
Innovation Spend
We are focused on delivering innovative solutions to the defense, national security and space end markets, and research and development is at the core of our business. We believe innovation spend and innovation spend excluding Starlab provide our management and investors useful measures of our aggregate spend on research and development type activities in support of our customers’ needs and our future growth.
However, innovation spend is an operating metric, not a financial measure calculated or presented in accordance with GAAP, and companies in our industry may calculate innovation spend or similar operating metrics differently than we do. We define innovation spend as research and development costs associated with IRS Section 174 categorization, as well as spend on designated development programs. Development programs are defined as initiatives that, when developed, will expand the Company’s product offerings under a customer funded arrangement. Innovation spend is comprised of various costs recognized in cost of sales and research and development costs within the consolidated statements of operations, as well as certain costs capitalized within property and equipment, net on our consolidated balance sheets. We define innovation spend excluding Starlab as innovation spend, minus the portion of innovation spend attributable to Starlab Space Stations.
Forward-Looking Statements
This press release contains “forward-looking statements” within the meaning of the Private Securities Litigation Reform Act of 1995. We intend all forward-looking statements to be covered by the safe harbor provisions for forward-looking statements contained in Section 27A of the Securities Act of 1933, as amended, and Section 21E of the Securities Exchange Act of 1934, as amended. All statements in this press release that do not relate to matters of historical fact should be considered forward-looking statements, including, without limitation, statements regarding Voyager’s financial outlook and growth forecasts, announced strategic partnerships, launch of Griffin-1 and timing thereof, advancements in NASA’s Commercial LEO Destination program, development and commercialization of Starlab, anticipated financial and operational performance and liquidity, including without limitation, long-term cash generation, and other projections. The words “expect,” “expectation,” “believe,” “anticipate,” “may,” “could,” “intend,” “belief,” “plan,” “estimate,” “target,” “predict,” “likely,” “seek,” “project,” “model,” “ongoing,” “will,” “should,” “forecast,” “outlook” or similar terminology are intended to identify forward-looking statements, though not all forward-looking statements use these words or expressions. These forward-looking statements are based on and reflect our current expectations, estimates, assumptions and/or projections, our perception of historical trends and current conditions, as well as other factors that we believe are appropriate and reasonable under the circumstances. Forward-looking statements are neither promises nor guarantees of future events, circumstances or performance and are inherently subject to known and unknown risks, uncertainties and other important factors that could cause our actual results, performance or achievements to differ materially from those indicated by those statements including, but not limited to: our ability to generate, sustain and manage our growth given our limited operating history in an evolving industry; factors out of our control that affect our success and revenue growth; our ability to generate a sustainable order rate for our products and services and develop new technologies to meet customer needs; our compliance with development contracts with third-parties and losses from fixed price contracts; our history of losses and ability to achieve profitability; risks related to Starlab; the unpredictable environment of space; our customer concentration and risks with contracting with the U.S. government; risk related to our international operations, currency fluctuations and political or economic instability in markets in which we operate; risks related to our compliance with new or existing data privacy, cybersecurity and other applicable regulations; our inability to adequately enforce and protect our intellectual property; our ability to consummate future acquisitions on satisfactory terms or effectively integrate acquired operations; and other important factors discussed in the section entitled “Risk Factors” in our Annual Report on Form 10-K filed with the Securities and Exchange Commission (the “SEC”) on March 10, 2026, as any such factors may be updated from time to time in our other filings with the SEC, accessible on the SEC’s website at www.sec.gov
and our investor relations site at investors.voyagertechnologies.com
.
The forward-looking statements included in this announcement are only made as of the date of this press release. Factors or events that could cause our actual results to differ may emerge from time to time, and it is not possible for us to predict all of them. We may not actually achieve the plans, intentions or expectations disclosed in our forward-looking statements and you should not place undue reliance on our forward-looking statements. We undertake no obligation to publicly update or review any forward-looking statement, whether as a result of new information, future developments or otherwise, except as may be required by any applicable law.
Website Disclosure
Investors and others should note that we announce material financial and operational information to our investors using press releases, SEC filings and public conference calls and webcasts, as well as our investor relations site at investors.voyagertechnologies.com. We may also use our website as a distribution channel of material information about the company. In addition, you may automatically receive email alerts and other information about Voyager when you enroll your email address by visiting the “Investor Email Alerts” option under the Resources tab on investors.voyagertechnologies.com
.
CONDENSED CONSOLIDATED BALANCE SHEETS
|
|
|
|
|
|
|
|
| (in thousands, except share amounts) |
September 30, 2026(unaudited) |
|
|
|
December 31, 2025 |
|
|
| ASSETS |
|
|
|
|
|
|
|
| Current assets: |
|
|
|
|
|
|
|
| Cash and cash equivalents |
$ |
553,613 |
|
|
$ |
491,329 |
|
| Accounts receivable, net |
|
42,899 |
|
|
|
29,819 |
|
| Contract assets |
|
40,929 |
|
|
|
29,786 |
|
| Inventories |
|
12,451 |
|
|
|
3,825 |
|
| Advanced payments, current |
|
6,000 |
|
|
|
— |
|
| Prepaid expenses and other current assets |
|
31,974 |
|
|
|
26,541 |
|
| TOTAL CURRENT ASSETS |
|
687,866 |
|
|
|
581,300 |
|
| Property and equipment, net |
|
267,609 |
|
|
|
164,286 |
|
| Operating lease right-of-use assets |
|
37,643 |
|
|
|
18,164 |
|
| Intangible assets, net |
|
203,351 |
|
|
|
98,982 |
|
| Goodwill |
|
371,825 |
|
|
|
157,674 |
|
| Other assets |
|
23,978 |
|
|
|
30,048 |
|
| TOTAL ASSETS |
$ |
1,592,272 |
|
|
$ |
1,050,454 |
|
|
|
|
|
|
|
|
|
| LIABILITIES AND EQUITY |
|
|
|
|
|
|
|
| Current liabilities: |
|
|
|
|
|
|
|
| Accounts payable |
$ |
46,414 |
|
|
$ |
27,386 |
|
| Contract liabilities |
|
74,233 |
|
|
|
24,338 |
|
| Operating lease liabilities |
|
8,132 |
|
|
|
5,831 |
|
| Accrued expenses and other current liabilities |
|
105,633 |
|
|
|
75,472 |
|
| TOTAL CURRENT LIABILITIES |
|
234,412 |
|
|
|
133,027 |
|
| Operating lease liabilities, non-current |
|
33,267 |
|
|
|
13,336 |
|
| Contract liabilities, non-current |
|
39,742 |
|
|
|
7,899 |
|
| Convertible notes, net |
|
841,070 |
|
|
|
447,634 |
|
| Deferred tax liabilities |
|
8,767 |
|
|
|
8,858 |
|
| Other long-term liabilities |
|
66,144 |
|
|
|
10,167 |
|
| TOTAL LIABILITIES |
$ |
1,223,402 |
|
|
$ |
620,921 |
|
| Class A common stock: $0.0001 par value per share; 400,000,000 shares authorized; 58,346,000 shares issued and 56,338,000 shares outstanding at September 30, 2026, 400,000,000 shares authorized, 54,546,859 shares issued, and 53,383,859 shares outstanding at December 31, 2025 |
|
5 |
|
|
|
5 |
|
| Class B common stock: $0.0001 par value per share; 50,000,000 shares authorized, 5,758,566 shares issued and outstanding at September 30, 2026; 50,000,000 shares authorized and 5,758,566 shares issued and outstanding at December 31, 2025 |
|
1 |
|
|
|
1 |
|
| Additional paid-in capital |
|
899,696 |
|
|
|
797,438 |
|
| Treasury stock, at cost |
|
(47,840 |
) |
|
|
(27,702 |
) |
| Accumulated other comprehensive loss |
|
(58 |
) |
|
|
(95 |
) |
| Accumulated deficit |
|
(532,080 |
) |
|
|
(385,927 |
) |
| Total Voyager Technologies, Inc. equity |
|
319,724 |
|
|
|
383,720 |
|
| Noncontrolling interests |
|
49,146 |
|
|
|
45,813 |
|
| TOTAL EQUITY |
|
368,870 |
|
|
|
429,533 |
|
| TOTAL LIABILITIES AND EQUITY |
$ |
1,592,272 |
|
|
$ |
1,050,454 |
|
CONDENSED CONSOLIDATED STATEMENTS OF OPERATIONS
|
|
|
|
|
|
|
|
|
|
|
|
|
|
|
|
|
Three Months Ended |
|
|
|
|
|
|
|
Nine Months Ended |
|
|
|
|
|
|
| (Unaudited, in thousands, except share and per share amounts) |
September30, 2026 |
|
|
|
September30, 2025 |
|
|
|
September30, 2026 |
|
|
|
September30, 2025 |
|
|
| Net sales |
$ |
88,715 |
|
|
$ |
39,587 |
|
|
$ |
176,707 |
|
|
$ |
119,768 |
|
| Cost of sales |
|
78,484 |
|
|
|
33,497 |
|
|
|
163,565 |
|
|
|
99,883 |
|
| Gross profit |
|
10,231 |
|
|
|
6,090 |
|
|
|
13,142 |
|
|
|
19,885 |
|
| Operating expenses: |
|
|
|
|
|
|
|
|
|
|
|
|
|
|
|
| Selling, general, and administrative |
|
47,846 |
|
|
|
25,106 |
|
|
|
122,875 |
|
|
|
81,633 |
|
| Research and development |
|
16,347 |
|
|
|
3,038 |
|
|
|
31,194 |
|
|
|
7,580 |
|
| Amortization of acquired intangibles |
|
7,941 |
|
|
|
1,989 |
|
|
|
17,031 |
|
|
|
5,141 |
|
| Loss from operations |
$ |
(61,903 |
) |
|
$ |
(24,043 |
) |
|
$ |
(157,958 |
) |
|
$ |
(74,469 |
) |
| Other income (expense): |
|
|
|
|
|
|
|
|
|
|
|
|
|
|
|
| Loss on debt extinguishment |
$ |
— |
|
|
$ |
— |
|
|
$ |
— |
|
|
$ |
(7,804 |
) |
| Finance and interest expense, net |
|
(2,695 |
) |
|
|
(200 |
) |
|
|
(6,714 |
) |
|
|
(5,452 |
) |
| Other income, net |
|
2,495 |
|
|
|
4,145 |
|
|
|
8,910 |
|
|
|
6,762 |
|
| Loss before income taxes |
|
(62,103 |
) |
|
|
(20,098 |
) |
|
|
(155,762 |
) |
|
|
(80,963 |
) |
| Income tax benefit |
|
(3,730 |
) |
|
|
(1,762 |
) |
|
|
(2,699 |
) |
|
|
(1,633 |
) |
| Net loss |
$ |
(58,373 |
) |
|
$ |
(18,336 |
) |
|
$ |
(153,063 |
) |
|
$ |
(79,330 |
) |
| Net loss attributable to noncontrolling interests |
|
(2,693 |
) |
|
|
(2,063 |
) |
|
|
(6,910 |
) |
|
|
(4,737 |
) |
| Net loss attributable to Voyager Technologies, Inc. |
$ |
(55,680 |
) |
|
$ |
(16,273 |
) |
|
$ |
(146,153 |
) |
|
$ |
(74,593 |
) |
| Less: dividends accrued on preferred stock |
|
— |
|
|
|
— |
|
|
|
— |
|
|
|
11,259 |
|
| Net loss available to common shareholders |
$ |
(55,680 |
) |
|
$ |
(16,273 |
) |
|
$ |
(146,153 |
) |
|
$ |
(85,852 |
) |
|
|
|
|
|
|
|
|
|
|
|
|
|
|
|
|
| Net loss per common share: |
|
|
|
|
|
|
|
|
|
|
|
|
|
|
|
| Basic |
$ |
(0.91 |
) |
|
$ |
(0.28 |
) |
|
$ |
(2.47 |
) |
|
$ |
(2.51 |
) |
| Diluted |
$ |
(0.91 |
) |
|
$ |
(0.28 |
) |
|
$ |
(2.47 |
) |
|
$ |
(2.51 |
) |
| Weighted-average shares outstanding: |
|
|
|
|
|
|
|
|
|
|
|
|
|
|
|
| Basic |
|
61,011,922 |
|
|
|
58,406,626 |
|
|
|
59,291,132 |
|
|
|
34,147,117 |
|
| Diluted |
|
61,011,922 |
|
|
|
58,406,626 |
|
|
|
59,291,132 |
|
|
|
34,147,117 |
|
CONDENSED CONSOLIDATED STATEMENTS OF CASH FLOWS
|
|
|
|
|
|
|
|
|
Nine Months Ended |
|
|
|
|
|
|
| (Unaudited, in thousands) |
September 30, 2026 |
|
|
|
September 30, 2025 |
|
|
| Cash Flows from Operating Activities: |
|
|
|
|
|
|
|
| Net loss |
$ |
(153,063 |
) |
|
$ |
(79,330 |
) |
| Adjustments to reconcile net loss to net cash used in operating activities: |
|
|
|
|
|
|
|
| Depreciation and amortization |
|
23,248 |
|
|
|
8,440 |
|
| Stock-based compensation |
|
12,877 |
|
|
|
15,390 |
|
| Amortization of operating lease right-of-use assets |
|
4,871 |
|
|
|
1,795 |
|
| Loss on debt extinguishment |
|
— |
|
|
|
7,804 |
|
| Amortization of debt issuance costs and other non-cash interest expense |
|
3,644 |
|
|
|
2,300 |
|
| Deferred taxes |
|
(2,895 |
) |
|
|
(1,552 |
) |
| Non-cash services acquired |
|
9,000 |
|
|
|
11,124 |
|
| Other |
|
889 |
|
|
|
446 |
|
| Change in operating assets and liabilities, net of acquisitions: |
|
|
|
|
|
|
|
| Accounts receivable |
|
(9,450 |
) |
|
|
(113 |
) |
| Prepaid expenses and other current assets |
|
(11,600 |
) |
|
|
(4,810 |
) |
| Contract assets |
|
(10,578 |
) |
|
|
(4,507 |
) |
| Inventories |
|
(9,414 |
) |
|
|
(193 |
) |
| Other assets |
|
5,608 |
|
|
|
(374 |
) |
| Accounts payable |
|
4,775 |
|
|
|
3,488 |
|
| Contract liabilities |
|
18,836 |
|
|
|
(14,585 |
) |
| Accrued expenses |
|
3,928 |
|
|
|
10,522 |
|
| Operating lease liabilities |
|
(2,118 |
) |
|
|
(1,597 |
) |
| Other liabilities |
|
(2,289 |
) |
|
|
(212 |
) |
| Net cash used in operating activities |
$ |
(113,731 |
) |
|
$ |
(45,964 |
) |
|
|
|
|
|
|
|
|
| Cash Flows from Investing Activities: |
|
|
|
|
|
|
|
| Purchases of property and equipment |
|
(114,839 |
) |
|
|
(96,562 |
) |
| Grant funding for property and equipment |
|
41,196 |
|
|
|
41,850 |
|
| Acquisitions, net of cash acquired |
|
(121,596 |
) |
|
|
(32,597 |
) |
| Purchase of investment |
|
— |
|
|
|
(2,500 |
) |
| Acquisition working capital settlement |
|
— |
|
|
|
— |
|
| Net cash used in investing activities |
$ |
(195,239 |
) |
|
$ |
(89,809 |
) |
|
|
|
|
|
|
|
|
| Cash Flows from Financing Activities: |
|
|
|
|
|
|
|
| Repayment of term loan |
|
— |
|
|
|
(64,420 |
) |
| Borrowings from the credit facility |
|
— |
|
|
|
64,500 |
|
| Repayments on the credit facility |
|
— |
|
|
|
(64,500 |
) |
| Proceeds from the exercise of stock options |
|
10,300 |
|
|
|
155 |
|
| Proceeds from the issuance of Common stock, net |
|
— |
|
|
|
45,886 |
|
| Proceeds from the issuance of Class C preferred stock, net |
|
— |
|
|
|
116,047 |
|
| Proceeds from the issuance of Class A common stock upon IPO, net of underwriting costs |
|
— |
|
|
|
409,405 |
|
| Costs associated with initial public offering |
|
— |
|
|
|
(8,133 |
) |
| Sale of noncontrolling interest |
|
21,078 |
|
|
|
37,767 |
|
| Purchase of noncontrolling interest |
|
— |
|
|
|
(10,600 |
) |
| Redemptions of Class A-1 redeemable preferred stock |
|
— |
|
|
|
(3,044 |
) |
| Cash repayment of Preferred B dividends |
|
— |
|
|
|
(27,584 |
) |
| Costs associated with the credit facility |
|
— |
|
|
|
(2,593 |
) |
| Proceeds from convertible notes |
|
402,500 |
|
|
|
130 |
|
| Payments for debt issuance costs related to convertible notes |
|
(10,063 |
) |
|
|
— |
|
| Purchase of capped call option |
|
(52,526 |
) |
|
|
— |
|
| Other |
|
— |
|
|
|
22 |
|
| Net cash provided by financing activities |
$ |
371,289 |
|
|
$ |
493,038 |
|
|
|
|
|
|
|
|
|
| Effect of foreign exchange on cash and cash equivalents |
$ |
(35 |
) |
|
$ |
125 |
|
| Net increase in cash and cash equivalents |
|
62,284 |
|
|
|
357,390 |
|
| Cash and cash equivalents at the beginning of the period |
|
491,329 |
|
|
|
55,930 |
|
| Cash and cash equivalents at the end of the period |
$ |
553,613 |
|
|
$ |
413,320 |
|
**TABLE 1 – NET SALES
**(Unaudited)
|
|
|
|
|
|
|
|
|
|
|
|
|
|
|
Three Months Ended |
|
|
|
|
|
|
|
Change |
|
|
|
|
| (dollars in thousands) |
September 30,2026 |
|
|
|
September 30,2025 |
|
|
|
Year over Year |
|
|
% |
|
| Net Sales: |
|
|
|
|
|
|
|
|
|
|
|
|
|
| Defense and Space Technologies |
$ |
88,790 |
|
|
$ |
40,085 |
|
|
$ |
48,705 |
|
121.5 |
% |
| Starlab Space Stations |
|
— |
|
|
|
— |
|
|
|
— |
|
— |
|
| Total Net Sales, reportable segments |
|
88,790 |
|
|
|
40,085 |
|
|
|
48,705 |
|
121.5 |
% |
| Intersegment eliminations |
|
(75 |
) |
|
|
(498 |
) |
|
|
423 |
|
(84.9 |
)% |
| Total Net Sales |
$ |
88,715 |
|
|
$ |
39,587 |
|
|
$ |
49,128 |
|
124.1 |
% |
|
|
|
|
|
|
|
|
|
|
|
|
|
|
|
Nine Months Ended |
|
|
|
|
|
|
|
Change |
|
|
|
|
| (dollars in thousands) |
September 30,2026 |
|
|
|
September 30,2025 |
|
|
|
Year over Year |
|
|
% |
|
| Net Sales: |
|
|
|
|
|
|
|
|
|
|
|
|
|
| Defense and Space Technologies |
$ |
178,126 |
|
|
$ |
121,621 |
|
|
$ |
56,505 |
|
46.5 |
% |
| Starlab Space Stations |
|
— |
|
|
|
— |
|
|
|
— |
|
— |
|
| Total Net Sales, reportable segments |
|
178,126 |
|
|
|
121,621 |
|
|
|
56,505 |
|
46.5 |
% |
| Intersegment eliminations |
|
(1,419 |
) |
|
|
(1,853 |
) |
|
|
434 |
|
(23.4 |
)% |
| Total Net Sales |
$ |
176,707 |
|
|
$ |
119,768 |
|
|
$ |
56,939 |
|
47.5 |
% |
**TABLE 2 – ADJUSTED EBITDA
**(Unaudited)
|
|
|
|
|
|
|
|
|
|
|
|
|
|
|
|
|
Three Months Ended |
|
|
|
|
|
|
|
Nine Months Ended |
|
|
|
|
|
|
| (dollars in thousands) |
September30, 2026 |
|
|
|
September30, 2025 |
|
|
|
September30, 2026 |
|
|
|
September30, 2025 |
|
|
| Net loss attributable to Voyager Technologies, Inc. |
$ |
(55,680 |
) |
|
$ |
(16,273 |
) |
|
$ |
(146,153 |
) |
|
$ |
(74,593 |
) |
| Finance and interest expense, net |
|
2,695 |
|
|
|
200 |
|
|
|
6,714 |
|
|
|
5,452 |
|
| Depreciation and amortization |
|
10,045 |
|
|
|
3,130 |
|
|
|
23,248 |
|
|
|
8,440 |
|
| Income tax benefit |
|
(3,730 |
) |
|
|
(1,762 |
) |
|
|
(2,699 |
) |
|
|
(1,633 |
) |
| EBITDA |
|
(46,670 |
) |
|
|
(14,705 |
) |
|
|
(118,890 |
) |
|
|
(62,334 |
) |
| Stock-based compensation |
|
5,002 |
|
|
|
2,120 |
|
|
|
12,893 |
|
|
|
15,390 |
|
| Business acquisition costs(1) |
|
1,487 |
|
|
|
482 |
|
|
|
3,906 |
|
|
|
922 |
|
| Restructuring(2) |
|
471 |
|
|
|
613 |
|
|
|
2,181 |
|
|
|
1,560 |
|
| Net loss attributable to noncontrolling interests |
|
(2,693 |
) |
|
|
(2,063 |
) |
|
|
(6,910 |
) |
|
|
(4,737 |
) |
| Interest income |
|
(2,264 |
) |
|
|
(4,313 |
) |
|
|
(9,362 |
) |
|
|
(7,826 |
) |
| Other(3) |
|
(232 |
) |
|
|
173 |
|
|
|
452 |
|
|
|
8,910 |
|
| Adjusted EBITDA |
$ |
(44,899 |
) |
|
$ |
(17,693 |
) |
|
$ |
(115,730 |
) |
|
$ |
(48,115 |
) |
|
|
|
| _________________ |
|
|
| (1) |
|
Business acquisition costs include legal costs and incremental transaction costs associated with an acquisition. |
| (2) |
|
Restructuring includes costs for retention and severance payments related to management’s decision to undertake certain actions to realign our cost structure through workforce reductions and the closure of certain facilities, businesses and product lines. |
| (3) |
|
Other includes capital market and advisory fees related to advisors assisting with transitional activities associated with becoming a public company, changes in fair value of earn out liabilities, and foreign exchange gain/loss that are all individually insignificant for the period. |
**TABLE 3 – FREE CASH FLOW
**(Unaudited)
|
|
|
|
|
|
|
|
|
|
|
|
|
|
|
|
|
Three Months Ended |
|
|
|
|
|
|
|
Nine Months Ended |
|
|
|
|
|
|
| (dollars in thousands) |
September30, 2026 |
|
|
|
September30, 2025 |
|
|
|
September30, 2026 |
|
|
|
September30, 2025 |
|
|
| Net cash used in operating activities |
$ |
(29,704 |
) |
|
$ |
(15,061 |
) |
|
$ |
(113,731 |
) |
|
$ |
(45,964 |
) |
| Purchases of property and equipment |
|
(28,187 |
) |
|
|
(38,435 |
) |
|
|
(114,839 |
) |
|
|
(96,562 |
) |
| Grant funding for property and equipment |
|
10,140 |
|
|
|
3,600 |
|
|
|
41,196 |
|
|
|
41,850 |
|
| Free cash flow |
$ |
(47,751 |
) |
|
$ |
(49,896 |
) |
|
$ |
(187,374 |
) |
|
$ |
(100,676 |
) |
**TABLE 4 – ADJUSTED NET LOSS PER SHARE
**(Unaudited)
|
|
|
|
|
|
|
|
|
|
|
|
|
|
|
|
|
Three Months Ended |
|
|
|
|
|
|
|
Nine Months Ended |
|
|
|
|
|
|
| (dollars in thousands, except per share data) |
September30, 2026 |
|
|
|
September30, 2025 |
|
|
|
September30, 2026 |
|
|
|
September30, 2025 |
|
|
| Net loss attributed to common shareholders |
$ |
(55,680 |
) |
|
$ |
(16,273 |
) |
|
$ |
(146,153 |
) |
|
$ |
(85,852 |
) |
| Stock-based compensation |
|
5,002 |
|
|
|
2,120 |
|
|
|
12,893 |
|
|
|
15,390 |
|
| Business acquisition costs(1) |
|
1,487 |
|
|
|
482 |
|
|
|
3,906 |
|
|
|
922 |
|
| Restructuring(2) |
|
471 |
|
|
|
613 |
|
|
|
2,181 |
|
|
|
1,560 |
|
| Deferred income tax benefit |
|
(3,879 |
) |
|
|
(1,641 |
) |
|
|
(2,894 |
) |
|
|
(1,613 |
) |
| Other(3) |
|
(232 |
) |
|
|
173 |
|
|
|
452 |
|
|
|
8,910 |
|
| Adjusted net loss attributable to common shareholders |
$ |
(52,831 |
) |
|
$ |
(14,526 |
) |
|
$ |
(129,615 |
) |
|
$ |
(60,683 |
) |
| Adjusted net loss per common share |
$ |
(0.87 |
) |
|
$ |
(0.25 |
) |
|
$ |
(2.19 |
) |
|
$ |
(1.78 |
) |
|
|
|
| _________________ |
|
|
| (1) |
|
Business acquisition costs include legal costs and incremental transaction costs associated with an acquisition. |
| (2) |
|
Restructuring includes costs for retention and severance payments related to management’s decision to undertake certain actions to realign our cost structure through workforce reductions and the closure of certain facilities, businesses and product lines. |
| (3) |
|
Other includes capital market and advisory fees related to advisors assisting with transitional activities associated with becoming a public company, changes in fair value of earn out liabilities, and foreign exchange gain/loss that are all individually insignificant for the period. |
**TABLE 5 – INNOVATION SPEND
**(Unaudited)
|
|
|
|
|
|
|
|
|
|
|
|
|
|
|
|
|
Three Months Ended |
|
|
|
|
|
|
|
Nine Months Ended |
|
|
|
|
|
|
| (dollars in thousands) |
September30, 2026 |
|
|
|
September30, 2025 |
|
|
|
September30, 2026 |
|
|
|
September30, 2025 |
|
|
| Qualified research and development under section 174 |
$ |
22,382 |
|
|
$ |
44,080 |
|
|
$ |
100,361 |
|
|
$ |
110,337 |
|
| Development program innovation spend(1) |
|
21,394 |
|
|
|
5,277 |
|
|
|
50,578 |
|
|
|
16,779 |
|
| Innovation spend |
|
43,776 |
|
|
|
49,357 |
|
|
|
150,939 |
|
|
|
127,116 |
|
| Less: Starlab Space Stations innovation spend |
|
11,043 |
|
|
|
41,865 |
|
|
|
72,380 |
|
|
|
101,781 |
|
| Innovation spend excluding Starlab Space Stations |
$ |
32,733 |
|
|
$ |
7,492 |
|
|
$ |
78,559 |
|
|
$ |
25,335 |
|
| Innovation spend as a percentage of net sales |
|
49.3 |
% |
|
|
124.7 |
% |
|
|
85.4 |
% |
|
|
106.1 |
% |
| Innovation spend excluding Starlab Space Stations as a percentage of net sales |
|
36.9 |
% |
|
|
18.9 |
% |
|
|
44.5 |
% |
|
|
21.2 |
% |
|
|
|
| _________________ |
|
|
| (1) |
|
Development program innovation spend represents program spend on designated innovation programs within the business that is necessary for fulfillment of performance obligations on revenue generating programs. |
Source: Voyager Technologies, Inc.
For additional media and information, please follow us:
LinkedIn
X
Investor contact: [email protected]
Media contact: [email protected]
Source: Voyager Technologies
Accelerating the Advantage
Send us a message
Sign up for updates
Sign up
VOYAGER 2026
© Copyright. All rights reserved. Terms of Use
Privacy Policy
T&Cs ZIN Technologies Inc., d.b.a. Voyager Space Solutions
Search