|
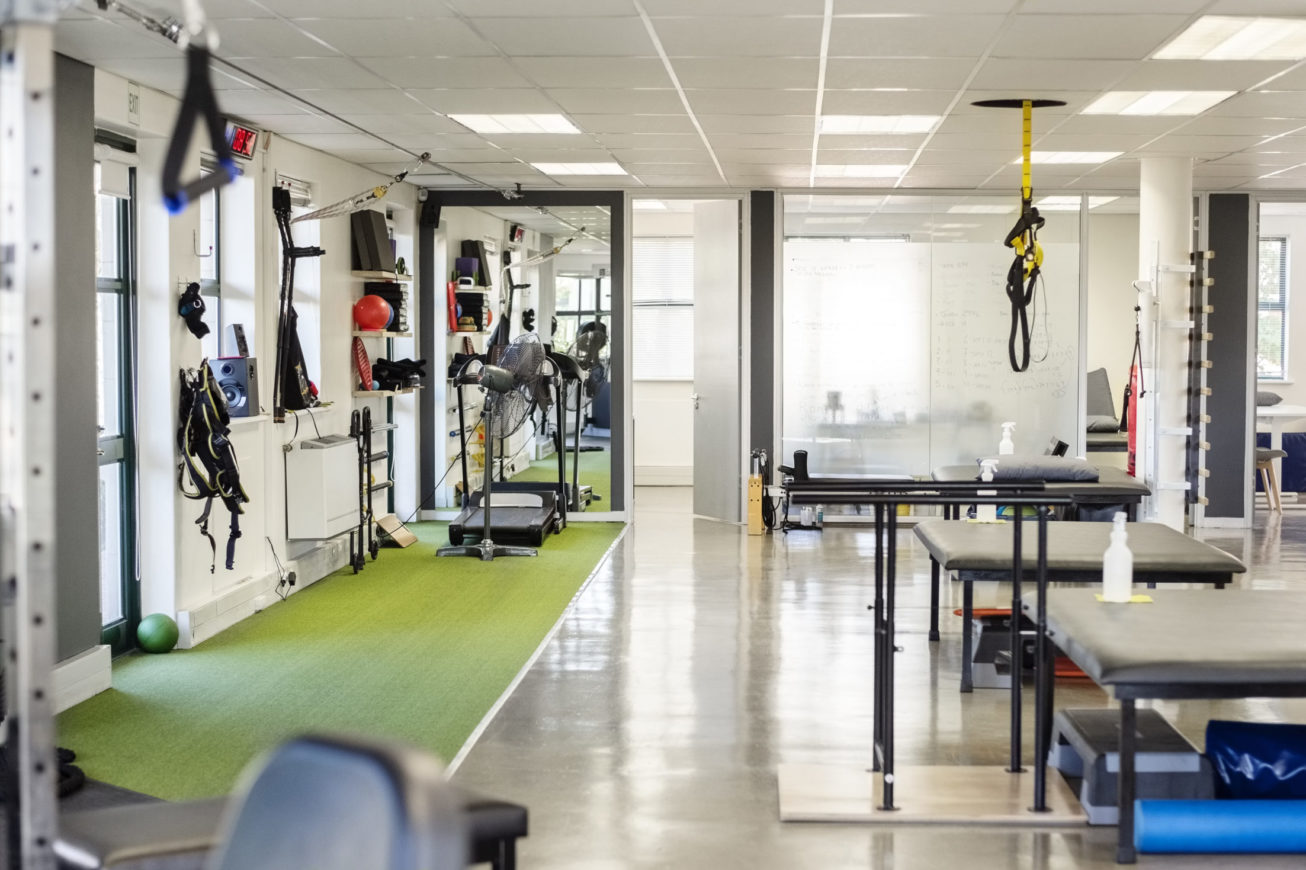
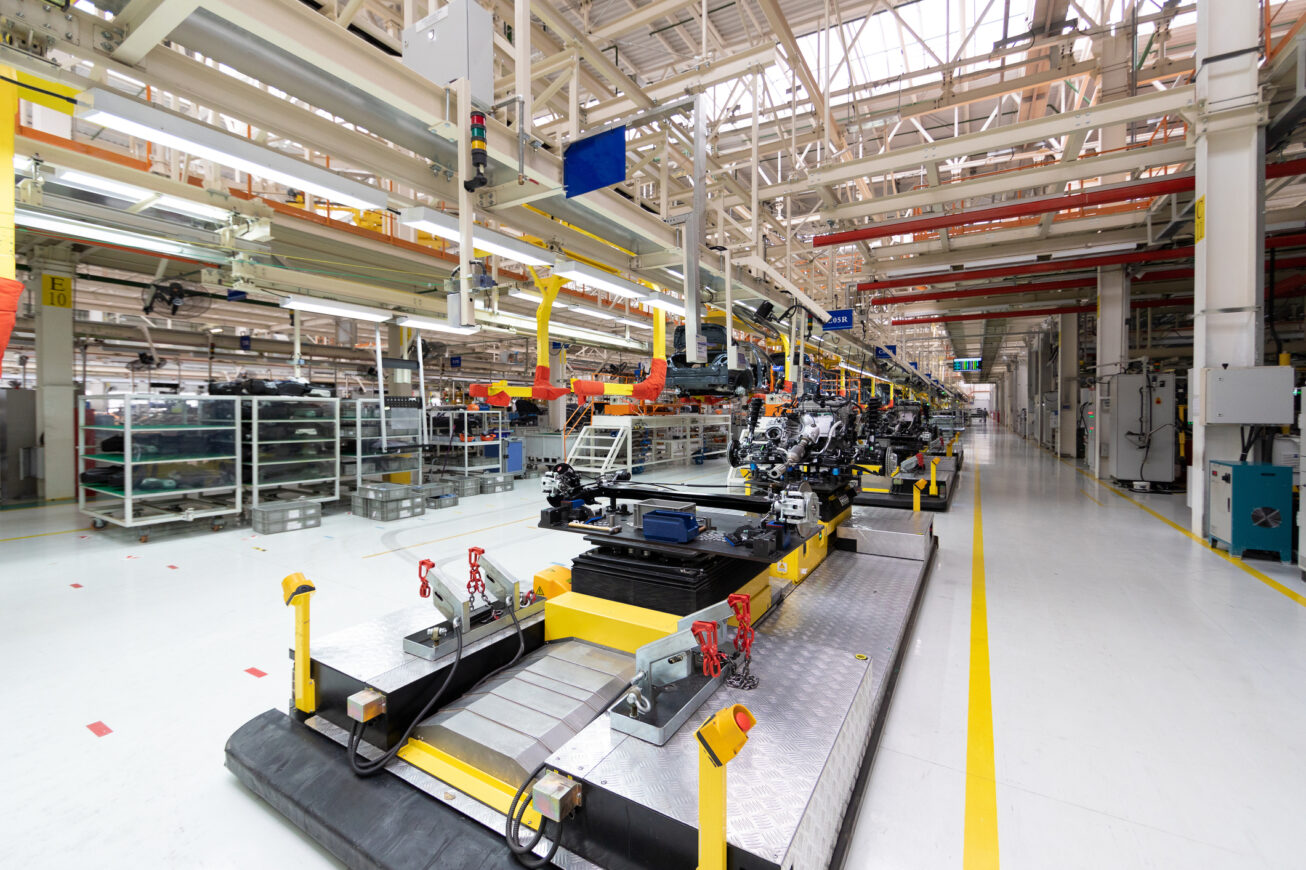
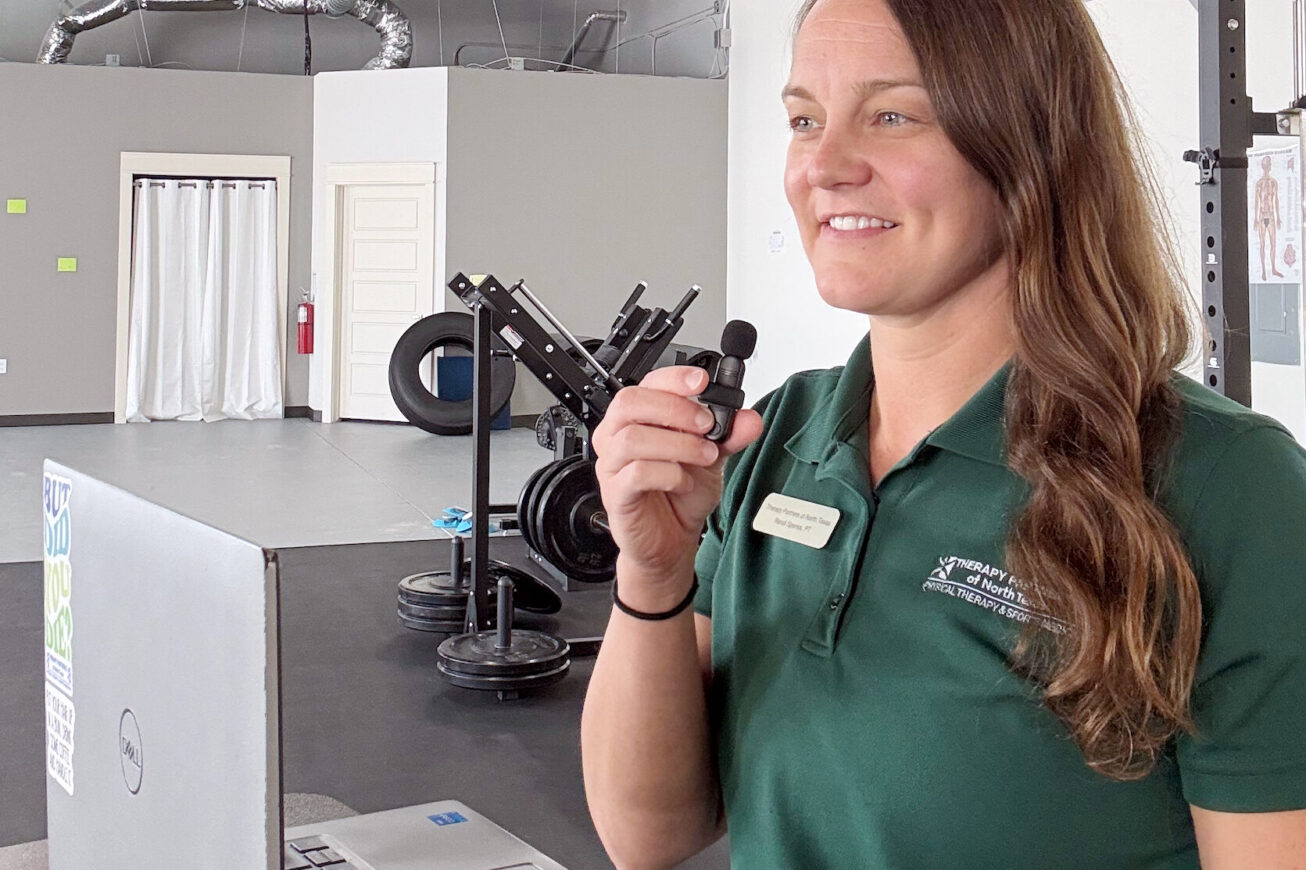
U.S. Physical Therapy, Inc. operates in the healthcare sector through two primary business segments: physical therapy operations and industrial injury prevention (IIP). The physical therapy segment provides outpatient and home-care services, including physical, speech, and occupational therapy, focusing on pre- and post-operative care, orthopedic disorders, sports injuries, and worker rehabilitation. The company serves patients through a network of clinics in 44 states, primarily in the United States, utilizing a partnership model where it acts as the general partner or managing member alongside local healthcare practitioners. The IIP segment offers onsite services to employers, including injury prevention, ergonomic assessments, functional capacity evaluations, and performance optimization, with a client base that includes Fortune 500 companies. The company was re-incorporated in 1992 and has been supporting private practice partnerships since 1990. It generates revenue through per-procedure billing, Medicare standards, and management fees from hospital and physician-owned practices. Key subsidiaries include MSO Metro LLC and Briotix Health Limited Partnership. Summarised from the company's own disclosures, fiscal year ended Feb 2026 |
Industry Medical Care Facilities | Homepage usph.com |
| Sector Healthcare | IR page usph.com/investor-relations | |
|
Tags
physical therapy, occupational therapy, speech therapy, outpatient care, home health, injury prevention, ergonomics, workers compensation, rehabilitation, management services, MSO Metro LLC, Briotix Health Limited Partnership
|
Press page usph.com/press-releases |
Metrics
| Valuation | |
|---|---|
| Market cap | $ 1.484B |
| Market cap (USD) | $ 1.484B |
| P/E | 102.49 |
| PEG | 14.29 |
| P/BV | 3.46 |
| P/S | 1.77 |
| P/OCF | 16.71 |
| P/FCF | 21.48 |
| Dividend yield | 1.8% |
| Turnover / mcap | — |
| Returns | |
|---|---|
| ROE | 8.2% |
| ROI | 6.2% |
| ROIC | 10.1% |
| Profit margin | 5.1% |
| Growth | |
|---|---|
| Revenue growing | Yes |
| Profits growing | Yes |
| Revenue up 3y | Yes |
| Revenue up 5y | Yes |
| Earnings growth 3y (net profit CAGR) | 7.2% |
| Quality | |
|---|---|
| Profitable | Yes |
| Margin expanding | Yes |
| Buying back stock | No |
| Diluting (TTM) | No |
| Debt/Equity | 57.3% |
| Podcast bulls (TTM) | Sign up |
| Podcast bears (TTM) | Sign up |
| Podcast sentiment (TTM) | Sign up |
| Podcast sentiment % (TTM) | Sign up |
| News sentiment (TTM) | 32 |
| Quality score | 22.2% |
| Insiders | |
|---|---|
| Buys, 1w | Sign up |
| Buys, 1m | Sign up |
| Buys, 1y | Sign up |
| Sells, 1w | Sign up |
| Sells, 1m | Sign up |
| Sells, 1y | Sign up |
Sign up to see this company's insider trades
| Figure | FY 2025 | FY 2024 | FY 2023 | FY 2022 | FY 2021 | FY 2020 | FY 2019 | FY 2018 | FY 2017 | FY 2016 | FY 2015 | FY 2014 | FY 2013 | FY 2012 | FY 2011 | FY 2010 | FY 2009 | FY 2008 | FY 2007 | FY 2006 | FY 2005 | FY 2004 | FY 2003 | FY 2002 | FY 2001 | FY 2000 |
|---|---|---|---|---|---|---|---|---|---|---|---|---|---|---|---|---|---|---|---|---|---|---|---|---|---|---|
| Revenue | 780.99M | 671.345M | 604.802M | 553.144M | 495.022M | 422.969M | 481.969M | 453.911M | 414.051M | 356.546M | 331.302M | 305.074M | 264.058M | 252.088M | 237.006M | 211.233M | — | — | — | — | — | — | 105.568M | 94.739M | 80.948M | 63.222M |
| Net profit | 39.583M | 31.424M | 28.239M | 32.158M | 40.831M | 35.194M | 40.039M | 34.873M | 22.256M | 20.551M | 22.279M | 20.853M | 12.723M | 17.933M | 20.974M | 15.645M | 19.974M | 10.004M | 8.738M | 6.296M | 8.791M | 6.678M | 7.331M | 8.488M | 7.071M | 3.735M |
| Free cash flow | 60.987M | 65.754M | 72.684M | 50.289M | 68.205M | 92.356M | 52.259M | 65.812M | 49.431M | 42.79M | 34.98M | 40.027M | 40.158M | 35.015M | 29.433M | 26.848M | 27.068M | 25.873M | 15.013M | 13.817M | 13.725M | 12.914M | 12.399M | 13.959M | 11.828M | 6.034M |
| Figure | FY 2025 | FY 2024 | FY 2023 | FY 2022 | FY 2021 | FY 2020 | FY 2019 | FY 2018 | FY 2017 | FY 2016 | FY 2015 | FY 2014 | FY 2013 | FY 2012 | FY 2011 | FY 2010 | FY 2009 | FY 2008 | FY 2007 | FY 2006 | FY 2005 | FY 2004 | FY 2003 | FY 2002 | FY 2001 | FY 2000 |
|---|---|---|---|---|---|---|---|---|---|---|---|---|---|---|---|---|---|---|---|---|---|---|---|---|---|---|
| Share price | 78.09 | 88.71 | 93.14 | 81.03 | 95.55 | 120.25 | 114.35 | 102.35 | 72.2 | 70.2 | 53.68 | 41.96 | 35.26 | 27.53 | 20.16 | 19.41 | 15 | 9.61 | — | 12.07 | — | — | — | — | — | — |
| Price performance 12m | -0.12 | -0.05 | 0.15 | -0.15 | -0.21 | 0.05 | 0.12 | 0.42 | 0.03 | 0.31 | 0.28 | 0.19 | 0.28 | 0.37 | 0.04 | 0.29 | 0.56 | — | — | — | — | — | — | — | — | — |
Filed figures
Lines the statements and their notes report beside the headline figures, read from the filings' XBRL as filed (no restatement applied), with figures computed from one filing's own lines. Cash-flow lines carry their cash direction: an outflow is negative. Each period links to its filing; a figure's period, report date and tag are in its tooltip.
| Figure | Dec 2016 | Dec 2017 | Dec 2018 | Dec 2019 | Dec 2020 | Dec 2021 | Dec 2022 | Dec 2023 | Dec 2024 | Dec 2025 |
|---|---|---|---|---|---|---|---|---|---|---|
| Balance sheet detail | ||||||||||
| Trade receivables (USD) | 38.8M | 44.7M | 44.8M | 46.2M | 41.9M | 46.3M | 51.9M | 51.9M | 59M | 64.2M |
| ↳ YoY growth | +7.2% | +15.1% | +0.1% | +3.3% | -9.3% | +10.4% | +12.2% | -0.1% | +13.8% | +8.8% |
| ↳ 5y CAGR | +7.0% | +3.0% | +3.6% | +3.0% | +3.0% | +5.0% | +8.9% | |||
| Borrowings, current (USD) | 1.23M | 4.04M | 1.43M | 728,000 | 4.9M | 830,000 | 7.86M | 7.69M | 11M | 9.87M |
| Borrowings, non-current (USD) | 50.6M | 56.7M | 38.4M | 50.4M | 16.6M | 118M | 176M | 139M | 143M | 153M |
| Lease liabilities (USD) | — | — | 0.00 | 86.7M | 89.5M | 105M | 112M | 112M | 142M | 153M |
| Cash and deposits (USD) | 20M | 21.9M | 23.4M | 23.5M | 32.9M | 28.6M | 31.6M | 153M | 41.4M | 35.6M |
| Intangible assets (USD) | 38.1M | 49M | 48.8M | 52.6M | 56.3M | 86.4M | 109M | 110M | 179M | 173M |
| Right-of-use assets (USD) | — | — | 0.00 | 81.6M | 81.6M | 96.4M | 103M | 103M | 134M | 144M |
| Net debt (borrowings + leases - cash) (USD) | 31.8M | 38.8M | 16.5M | 114M | 78.1M | 195M | 264M | 106M | 254M | 280M |
| Cash flow detail | ||||||||||
| Operating cash flow (USD) | 51.1M | 56.5M | 73M | 62.4M | 100M | 76.4M | 58.5M | 82M | 74.9M | 75.1M |
| Purchases of property, plant and equipment (USD) | -8.26M | -7.1M | -7.19M | -10.2M | -7.64M | -8.2M | -8.25M | -9.29M | -9.19M | -14.1M |
| Change in receivables (cash effect) (USD) | -3.28M | -3.45M | -3.43M | -6.38M | 899,000 | -9.42M | -10.3M | -5.65M | -5.35M | -12M |
| Change in payables (cash effect) (USD) | 2.99M | 6.98M | 4.88M | -4.21M | 12.4M | 4.66M | -7.76M | 15,000 | 1.71M | -7.8M |
| Dividends paid (cash effect) (USD) | -8.51M | -10.1M | -11.7M | -14.6M | -4.11M | -18.8M | -21.3M | -24.1M | -26.5M | -27.4M |
| Share buybacks (cash effect) (USD) | — | — | — | — | — | — | — | 0.00 | 0.00 | -5.57M |
| Interest paid (cash effect) (USD) | -784,000 | -2.11M | -2.36M | -1.89M | -1.2M | -1.35M | -5.69M | -8.66M | -7.21M | -9.43M |
| Income taxes paid (cash effect) (USD) | -10.6M | -8.54M | -9.18M | -9.86M | -7.68M | -12.2M | -7.62M | -4.93M | -4.83M | -14.3M |
| Share-based compensation (USD) | 4.96M | 5.03M | 5.94M | 6.99M | 7.92M | 7.87M | 7.26M | 7.24M | 7.82M | 8.27M |
| Operating cash flow before change in receivables (USD) | 54.3M | 60M | 76.4M | 68.8M | 99.1M | 85.8M | 68.8M | 87.6M | 80.3M | 87M |
| Free cash flow (OCF - PPE - intangibles) (USD) | 42.8M | 49.4M | 65.8M | 52.3M | 92.4M | 68.2M | 50.3M | 72.7M | 65.8M | 61M |
| Income detail | ||||||||||
| Total comprehensive income (USD) | — | — | — | — | 52.5M | 57.9M | 47.4M | 36M | 45.6M | 55.9M |
| Comprehensive income to owners (USD) | — | — | — | — | 35.2M | 40.8M | 36.2M | 27M | 31.4M | 37.5M |
| Provision for credit losses (USD) | 4.04M | 3.67M | 4.6M | 4.86M | 4.62M | 5.31M | 5.55M | 6.17M | 6.91M | 7.65M |
| Credit cost ratio (credit losses / average receivables) (%) | 10.8% | 8.8% | 10.3% | 10.7% | 10.5% | 12.0% | 11.3% | 11.9% | 12.5% | 12.4% |
| Reported | Jun 7, 2017 | Mar 14, 2018 | May 6, 2019 | Feb 28, 2020 | Feb 28, 2023 | Feb 28, 2023 | Feb 28, 2023 | Feb 27, 2026 | Feb 27, 2026 | Feb 27, 2026 |
Sign up to see institutional holdings
Sign UpPodcast Mentions
Sign up to see podcast mentions and sentiment
Sign UpMaterial events reported to the SEC on Form 8-K or 6-K, newest first. The link opens the filing itself on EDGAR. Press releases from the company's own website, newest first.
Joe Noyons
(817) 778-8424
USPH Reports Third Quarter 2026 Results,
Record High Visits and Revenue Per Visit
Houston, TX, November 4, 2026 – U.S. Physical Therapy, Inc. (“USPH” or the “Company”) (NYSE, NYSE Texas: USPH), a national operator of outpatient physical therapy clinics and provider of industrial injury prevention services (“IIP”), today reported results for the three and nine months ended September 30, 2026.
• Total net revenue was $223 million for the third quarter ended September 30, 2026 (“Q3 2026”), a 13% increase over the third quarter ended September 30, 2025 (“Q3 2025”).
• Net income attributable to USPH shareholders was $11 million for Q3 2026 compared to $13 million for Q3 2025. The Company reported loss per share of $1.04 in Q3 2026 compared to earnings per share of $0.48 in Q3 2025. Included in pretax income for Q3 2026 was a $0.1 million loss on change in fair value of contingent earn out consideration compared to a gain of $6 million in Q3 2025.





































Prompts
Click prompts to add them under the company line, click again to take one out, then copy the result into your AI chat. Shared by Asian Century Stocks and Uncovered Thai Stocks. Thank you.
ETFs Holding U.S. Physical Therapy, Inc.
Exchange-traded funds whose newest published daily portfolio holds one of the company's listings, largest weight first.
| ETF | Weight in ETF | Shares | Market value | As of |
|---|---|---|---|---|
| SOVF | 2.05% | 22,695 | $ 1.794M | Jul 31, 2026 |
| SMLL | 2.00% | 2,726 | $ 271.51K | Nov 13, 2026 |
| RUSC | 0.32% | 3,731 | $ 256.245K | Jun 30, 2026 |
| ESSC | 0.28% | 1,270 | $ 100.406K | Jul 31, 2026 |
| PSC | 0.06% | 20,392 | $ 1.401M | Jun 30, 2026 |
| DFAT | 0.04% | 143,700 | $ 14.169M | Nov 12, 2026 |
| SMDX | 0.04% | 515 | $ 51.268K | Nov 17, 2026 |
| DFAS | 0.03% | 104,934 | $ 10.346M | Nov 12, 2026 |
| MSSM | 0.01% | 1,353 | $ 105.182K | Aug 31, 2026 |
| DXUV | 0.01% | 7,224 | $ 712.286K | Nov 12, 2026 |
| DFAC | 0.01% | 75,889 | $ 7.483M | Nov 12, 2026 |
| DFUV | 0.01% | 9,068 | $ 894.105K | Nov 12, 2026 |
| DFSU | 0.01% | 1,245 | $ 122.757K | Nov 12, 2026 |
| DCOR | 0.00% | 21,384 | $ 2.108M | Nov 12, 2026 |
| DFAU | 0.00% | 4,165 | $ 410.669K | Nov 12, 2026 |
| DFUS | 0.00% | 5,673 | $ 559.358K | Nov 12, 2026 |
| EBI | 0.00% | 50 | $ 3,887.00 | Aug 31, 2026 |