July 09, 2026 Share: The new Lifestyle Spending Account (LSA) is integrated with UHC Store where eligible members can shop for health, wellness and lifestyle offerings, most at a discount LSA offers employers a flexible, cost-efficient way to help…
July 09, 2026
Share:
-
-
-
-
-
-
The new Lifestyle Spending Account (LSA) is integrated with UHC Store where eligible members can shop for health, wellness and lifestyle offerings, most at a discount
-
LSA offers employers a flexible, cost-efficient way to help employees customize their experiences with the offerings they value most
Close
Share This Story
UnitedHealthcare Launches New Spending Account Benefit, Putting More Choice in the Hands of Consumers
Name
Email To
Message
Cancel
Send
UnitedHealthcare has introduced a Lifestyle Spending Account (LSA), an employer-sponsored benefit that gives companies a flexible way to help fund and support their employees’ individual health and well-being goals. When offered by an employer, the LSA is designed to help empower people to personalize their experience and shop for products and services to complement their other employer-sponsored benefits at any time.
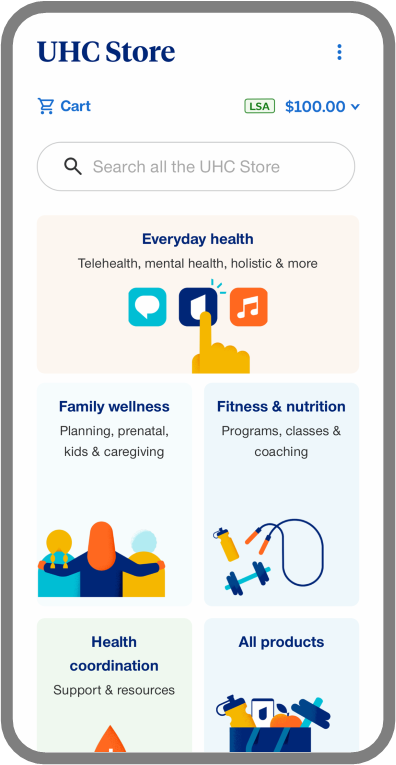
UnitedHealthcare has integrated its LSA with UHC Store
, a consumer-friendly digital shop available within the UnitedHealthcare® app
and myuhc.com
®.
An LSA is an employer-sponsored, post-tax benefit that people can use to make purchases in UHC Store. Offerings include eligible health, wellness and lifestyle products not generally considered qualified expenses for other accounts like Flexible Spending Accounts and Health Savings Accounts.
Because UnitedHealthcare’s LSA is integrated with a member-exclusive digital shop, people don’t have to wait to be reimbursed since the transaction is handled at the point of purchase within the individual’s UHC Store experience.
Through this innovative model, people can use one digital platform to browse, shop and purchase offerings, most of them at a discount, at any time they see fit.
Consumers, especially younger employees, are driving a shift1
in employer benefit strategies with increasing demand for holistic offerings that are integrated into their lifestyles and meet a wider range of personal needs — from familiar wellness offerings for fitness and smoking cessation to a broader range of offerings for sleep, mindfulness, nutrition and appearance.
UHC Store and the integrated LSA offer a way for employers to fund categories of wellness and lifestyle offerings their employees value and increasingly expect, expanding financial support beyond what traditional health accounts and coverage offer.
“People want healthcare to feel personal with more choices to tailor their experience, while employers are seeking opportunities to modernize their strategies,” said Dan Kueter, CEO for UnitedHealthcare’s commercial business. “This is a part of our sustained effort to improve the healthcare experience through flexible, cost-efficient innovations for employers that empower consumer choice.”
The LSA is available to more than 15 million UnitedHealthcare commercial members. More than 30 offerings are currently available in UHC Store from dozens of popular vendors meeting a wide variety of lifestyle, health and wellness needs, including products for mindfulness; women’s health; nutrition; fitness; sleep; chronic conditions; family planning; weight management; and more.
UnitedHealthcare’s consumer-oriented approach to digital offerings — like UHC Store — brings familiar shopping experiences into the healthcare experience.
Modernizing employer health and wellness offerings
Eighty-eight percent of employees believe
well-being is just as important as salary, and 78% expect their employers to support it. Meanwhile, workforce demographics are evolving. Gen Z and millennials represent more than half of UnitedHealthcare’s commercial membership and 54%
of working age individuals overall, and drive more than 40% PDF Navy
of total wellness spend nationwide.
LSAs that enable more consumer choice are increasingly popular, cost-efficient options for employers to modernize
how they invest in employee health and well-being without the cost of a major health plan redesign. Within the next three years, the number of employers offering an LSA or a similar product is expected to reach
76%.
By choosing to fund the LSA, self-insured employers can minimize the number of vendor relationships, reduce administrative burden and meet the individual needs of employees instead of offering a one-size-fits-all approach that may not be relevant for every person.
UHC Store continues to evolve to include more vendors and offerings and to accommodate various employer-contribution models and consumer payment structures.
Healthcare that works better for people
While this is the most recent initiative from UnitedHealthcare to create a more consumer-friendly experience for people, the company is working broadly to address challenges in healthcare by:
Learn more about UnitedHealthcare’s commitment to make healthcare work better for everyone
.
About UnitedHealthcare
UnitedHealthcare is dedicated to helping people live healthier lives and making the health system work better for everyone by simplifying the healthcare experience, meeting consumer health and wellness needs, and sustaining trusted relationships with care providers. The company offers the full spectrum of health benefit programs for individuals, employers, and Medicare and Medicaid beneficiaries, and contracts directly with physicians, care professionals, hospitals and other care facilities. UnitedHealthcare is one of the businesses of UnitedHealth Group (NYSE: UNH), a diversified healthcare company. For more information, visit UnitedHealthcare at www.uhc.com
or follow UnitedHealthcare on LinkedIn
.
UHC Store provides a member-direct purchase of health and wellness offerings. UHC Store is not a product, program nor service, is not insurance, and is not a substitute for health plan benefits nor professional medical advice, diagnosis, or treatment. UnitedHealthcare does not endorse nor guarantee offerings available through UHC Store. UnitedHealthcare is not responsible or liable for services, or advice given by a UHC Store participant of these offerings. Individuals are responsible for understanding potential risks associated with using these offerings. Purchasing any offerings may have tax implications. Health Savings Account (HSA) use and eligibility may be impacted. Individuals should consult with a tax specialist to determine whether they have any tax obligations from purchasing offerings from the UHC Store. Components subject to change. UHC Store is not available in all states or for all members. Amounts paid under a Lifestyle Spending Account (LSA) may be subject to federal, state, and local taxes. Employers should consult with a tax specialist to determine whether they have any tax obligations from members’ use of an LSA to purchase offerings from the UHC Store. LSA offerings and options are subject to change.
Employee benefits including group health plan benefits may be taxable benefits unless they fit into specific exception categories. Please consult with your tax specialist to determine taxability of these offerings.
Administrative services provided by United HealthCare Services, Inc. or their affiliates.
Tags:
Return To Top
Related Stories

UnitedHealthcare Expands Doula Offering to Employer-Sponsored Plans Nationwide
Mar 16, 2026
Mar 16, 2026
Read More
Care in the safety and comfort of home helps improve patients’ experience
Dec 17, 2025
Dec 17, 2025
Read More

How Optum Rx pharmacists are redefining pharmacy and transforming the care experience
Oct 06, 2025
Oct 06, 2025
Read More
©2026 UnitedHealth Group. All rights reserved.
Follow Us.

Your Opt Out Preference Signal is Honored
Do Not Share or Sell My Personal Information
When you visit our website, we store cookies on your browser to collect information. The information collected might relate to you, your preferences or your device, and is mostly used to make the site work as you expect it to and to provide a more personalized web experience. However, you can choose not to allow certain types of cookies, which may impact your experience of the site and the services we are able to offer. Click on the different category headings to find out more and change our default settings according to your preference. You cannot opt out of Strictly Necessary Cookies, as they are deployed in order to ensure the proper functioning of our website (such as prompting the cookie banner and remembering your settings, to log into your account, to redirect you when you log out, etc.). For more information about the First and Third Party Cookies used please follow this link:
More information
Allow All
Manage Consent Preferences
Strictly necessary cookies
Always Active
These cookies are necessary for the website to function and cannot be switched off in our systems. They are usually only set in response to actions made by you which amount to a request for services, such as setting your privacy preferences, logging in or filling in forms. You can set your browser to block or alert you about these cookies, but some parts of the site will not then work. These cookies do not store any personally identifiable information.
Functional cookies
Functional cookies
These cookies enable the website to provide enhanced functionality and personalization. They may be set by us or by third party providers whose services we have added to our pages. If you do not allow these cookies then some or all of these services may not function properly.
Sharing of Personal Information
Sharing of Personal Information
Under the CPRA, you have the right to opt-out of the sharing of your personal information to third parties. These cookies collect information for analytics and to personalize your experience with targeted ads. You may exercise your right to opt out of the sharing of personal information by using this toggle switch. If you opt out we will not be able to offer you personalized ads and will not hand over your personal information to any third parties. If you have enabled privacy controls on your browser (such as a plugin), we have to take that as a valid request to opt-out. This may affect our ability to personalize content according to your preferences.
-
Performance cookies
Switch Label
These cookies allow us to count visits and traffic sources so we can measure and improve the performance of our site. They help us to know which pages are the most and least popular and see how visitors move around the site. All information these cookies collect is aggregated and therefore anonymous. If you do not allow these cookies we will not know when you have visited our site, and will not be able to monitor its performance.
-
Targeting cookies
Switch Label
These cookies may be set through our site by our advertising partners. They may be used by those companies to build a profile of your interests and show you relevant ads on other sites. They do not directly store personal information, but are based on uniquely identifying your browser and internet device. If you do not allow these cookies, you will experience less targeted advertising.
Back Button
Cookie List
Search Icon
Filter Icon
Clear
Apply Cancel
Consent Leg.Interest
checkbox label label
checkbox label label
checkbox label label
Reject All Confirm My Choices