Contact us News Story UL Solutions ComplianceWire® Knowledge Summit: Key Takeaways This two-day conference provides a forum for life sciences industry leaders to discuss key trends and challenges regarding employee training and learning management.…
Contact us
UL Solutions ComplianceWire® Knowledge Summit: Key Takeaways
This two-day conference provides a forum for life sciences industry leaders to discuss key trends and challenges regarding employee training and learning management.
Contact us

May 3, 2023
The 20th Annual UL Solutions ComplianceWire® Knowledge Summit took place at the Hyatt Regency in Princeton, NJ, on April 25 and 26, 2023. The summit was attended by 156 people representing 60 ComplianceWire® customers ranging in size from small startups to some of the world’s largest life science companies, such as AbbVie, AstraZeneca, BMS, Gilead Sciences, Johnson & Johnson and Stryker.
Jim O’Keefe, senior director and general manager of ComplianceWire® at UL Solutions, charged his staff with elevating the UL Solutions core value of customer centricity and prioritizing listening above activity while hosting the event.
Key themes across life sciences training and e-learning
The conference began with an executive session that included representatives from companies including Mix Talent, Sai Life Sciences Ltd, AbbVie, Shionogi Inc., Otsuka Pharmaceutical Co., Ltd., Alkermes and Daiichi Sankyo, Inc., as well as UL Solutions Global Vice President and Product Life Cycle General Manager Diana Coso. Participants provided insights into their internal training and learning management issues as well as their perspectives on broader industry trends and how they leverage their relationships with UL Solutions in developing and executing their global business strategies. In addition, UL Solutions Vice President of Regulatory Services and Chief Scientist Deborah Jennings-Connor attended, advocating for patient safety and tying the work of ComplianceWire® and our life science customers to broader medical safety and effectiveness efforts.
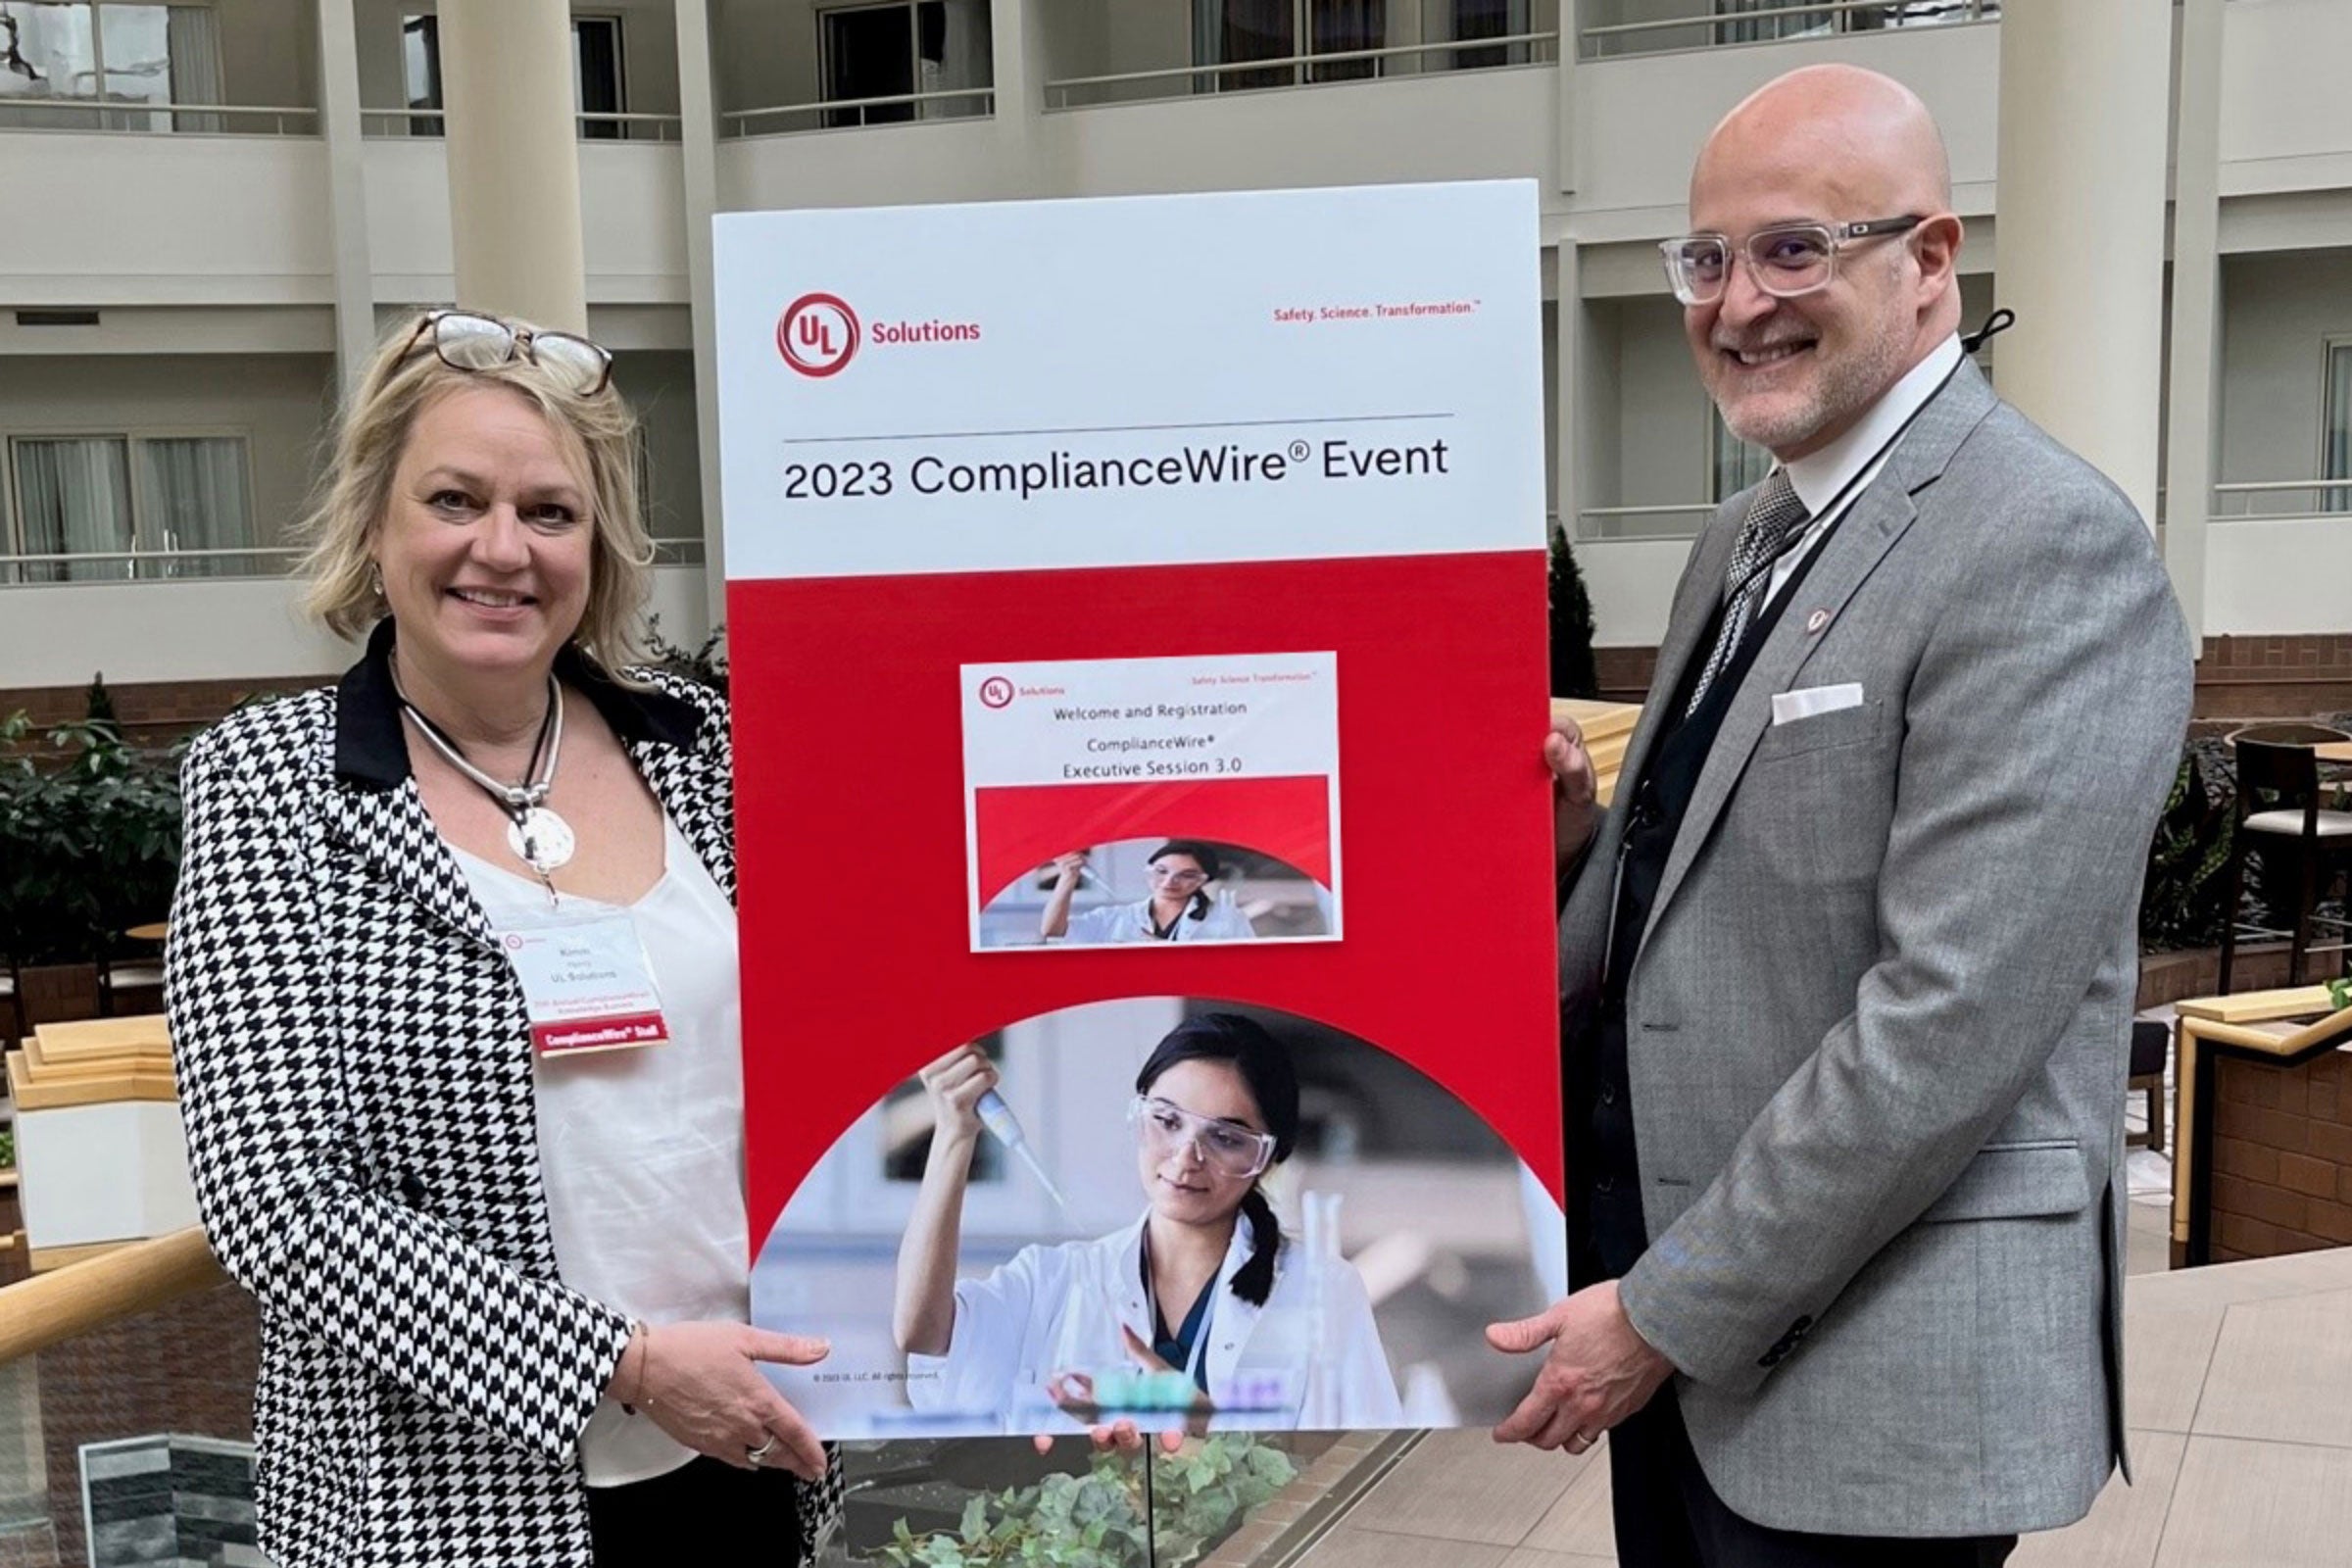
Kimm Henry, UL Solutions Demand Generation & Global Campaigns with Kenneth Perez, UL Solutions ComplianceWire® event marketing team
Over the course of the conference, four key themes emerged:
- Trends in life sciences regulatory findings
- Training versus learning
- The need for coherent and holistic quality management platforms
- Applying emerging technologies such as artificial intelligence (AI) and biosimulation
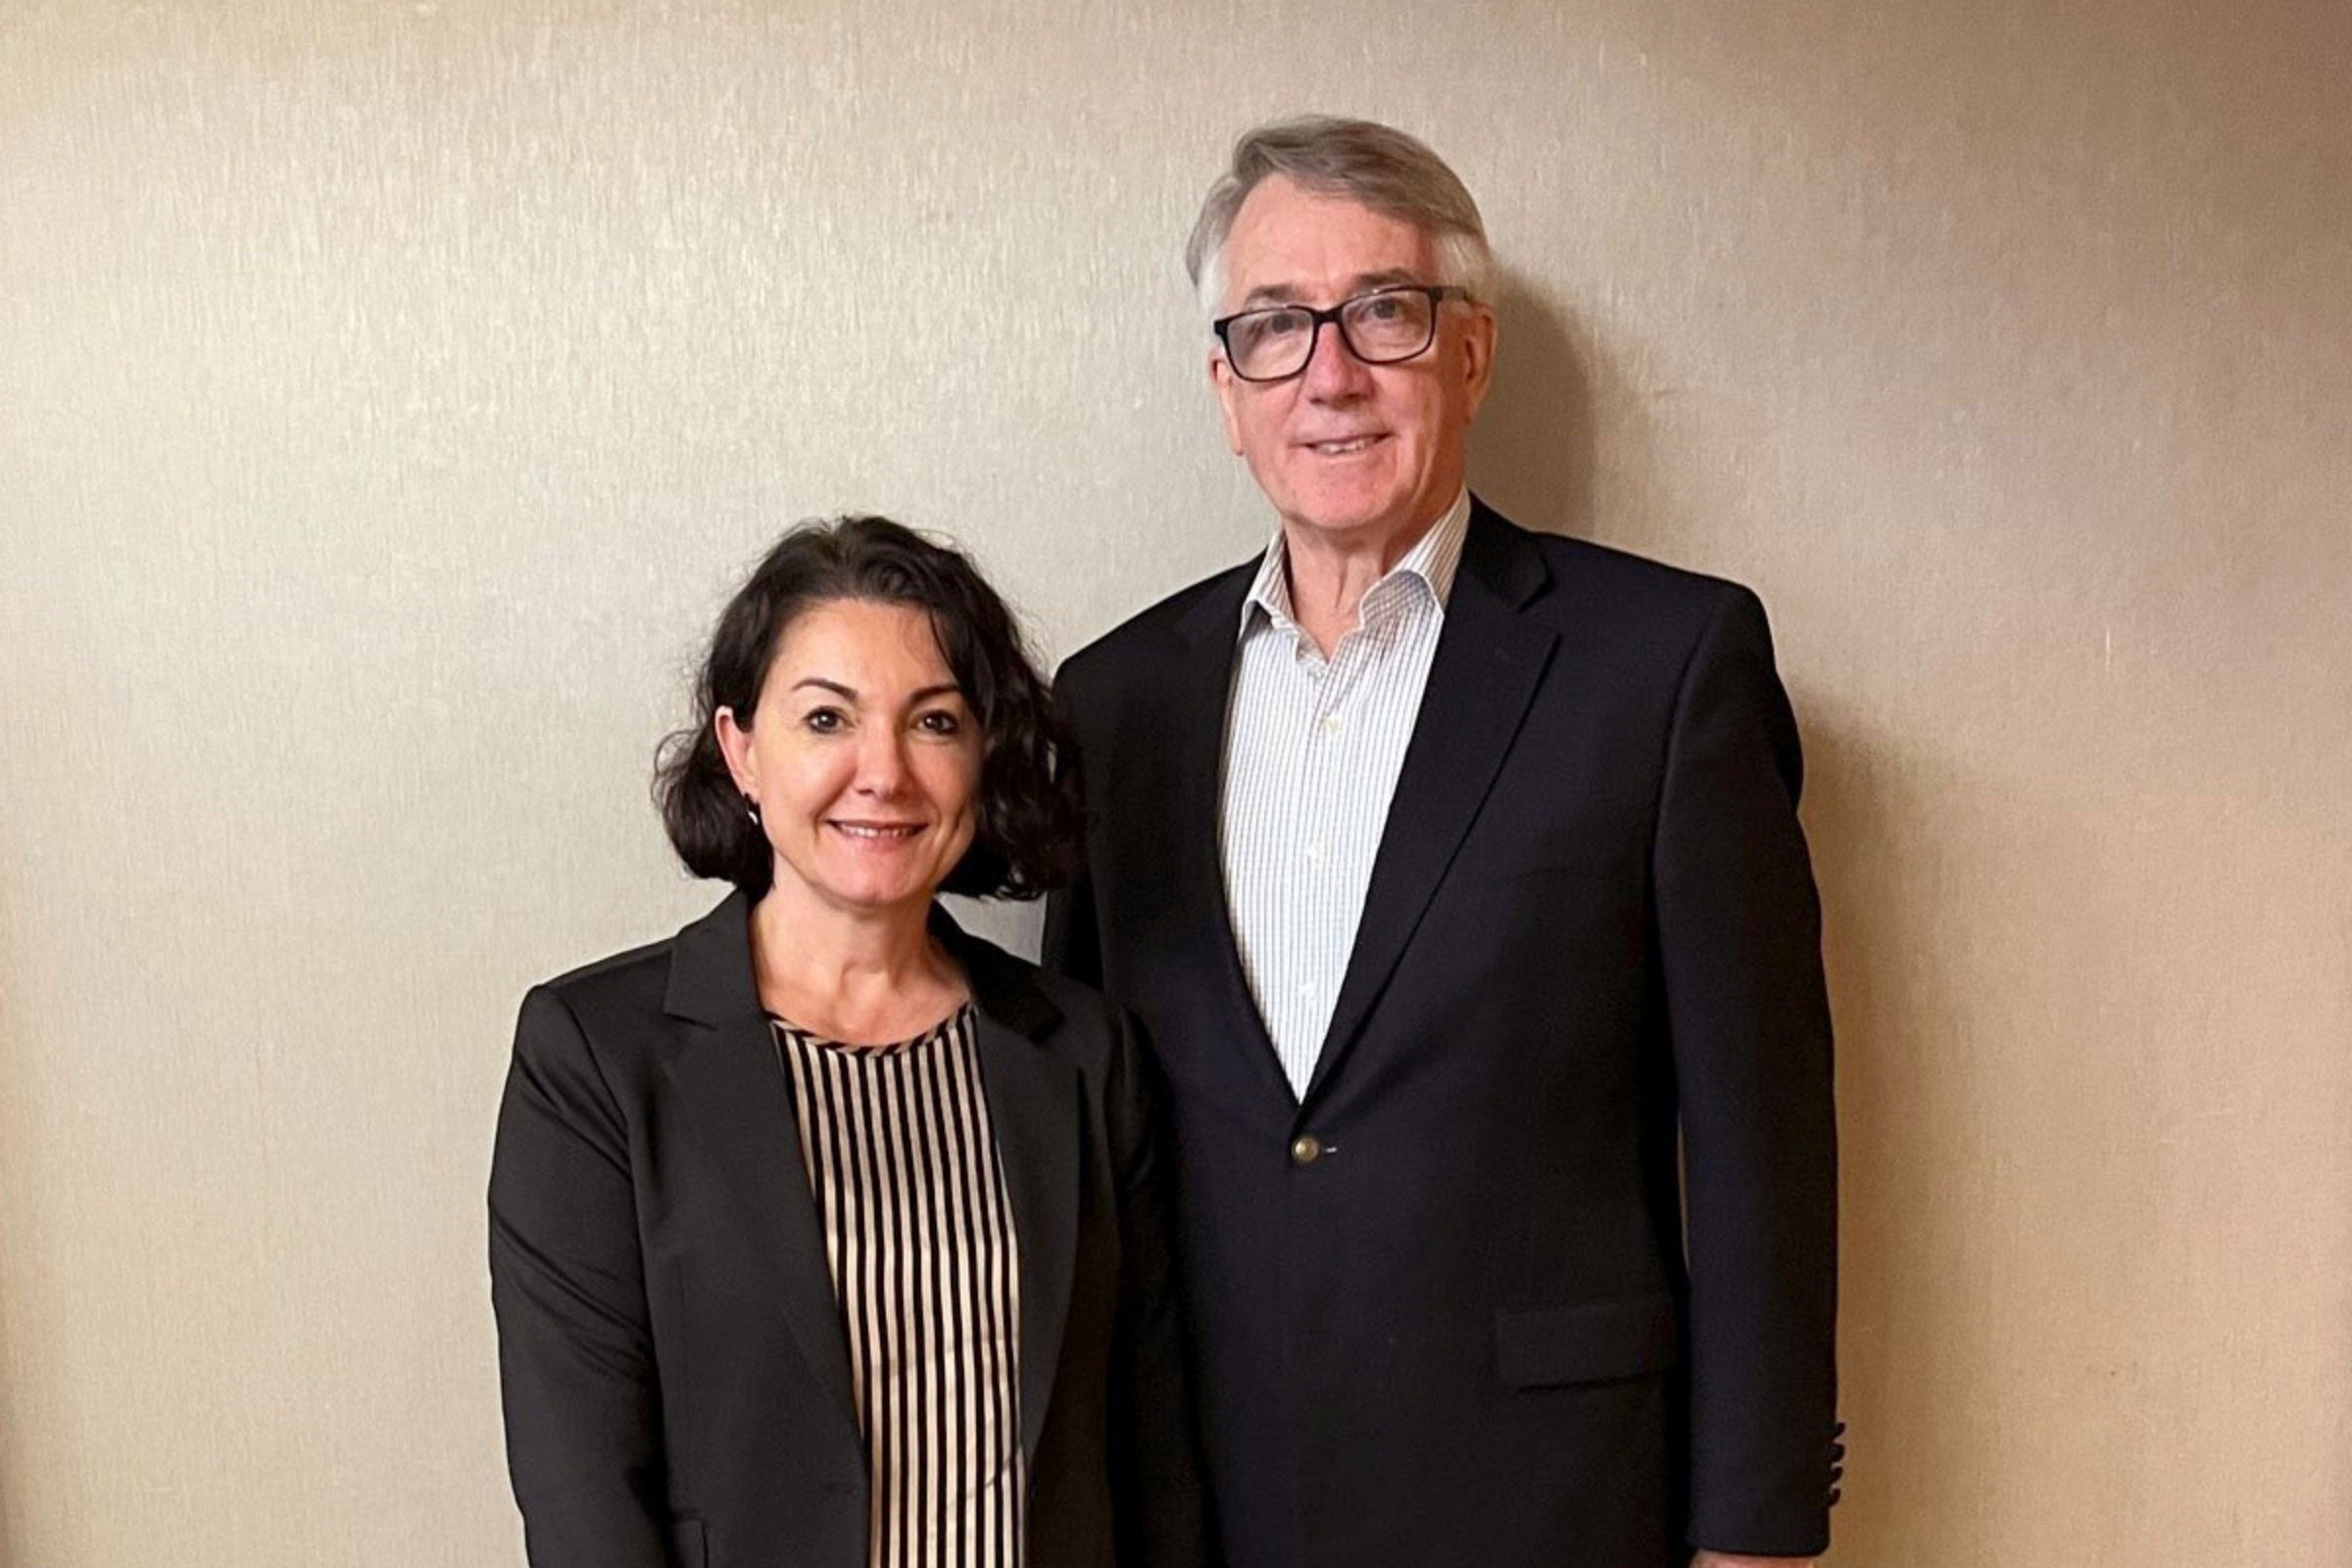
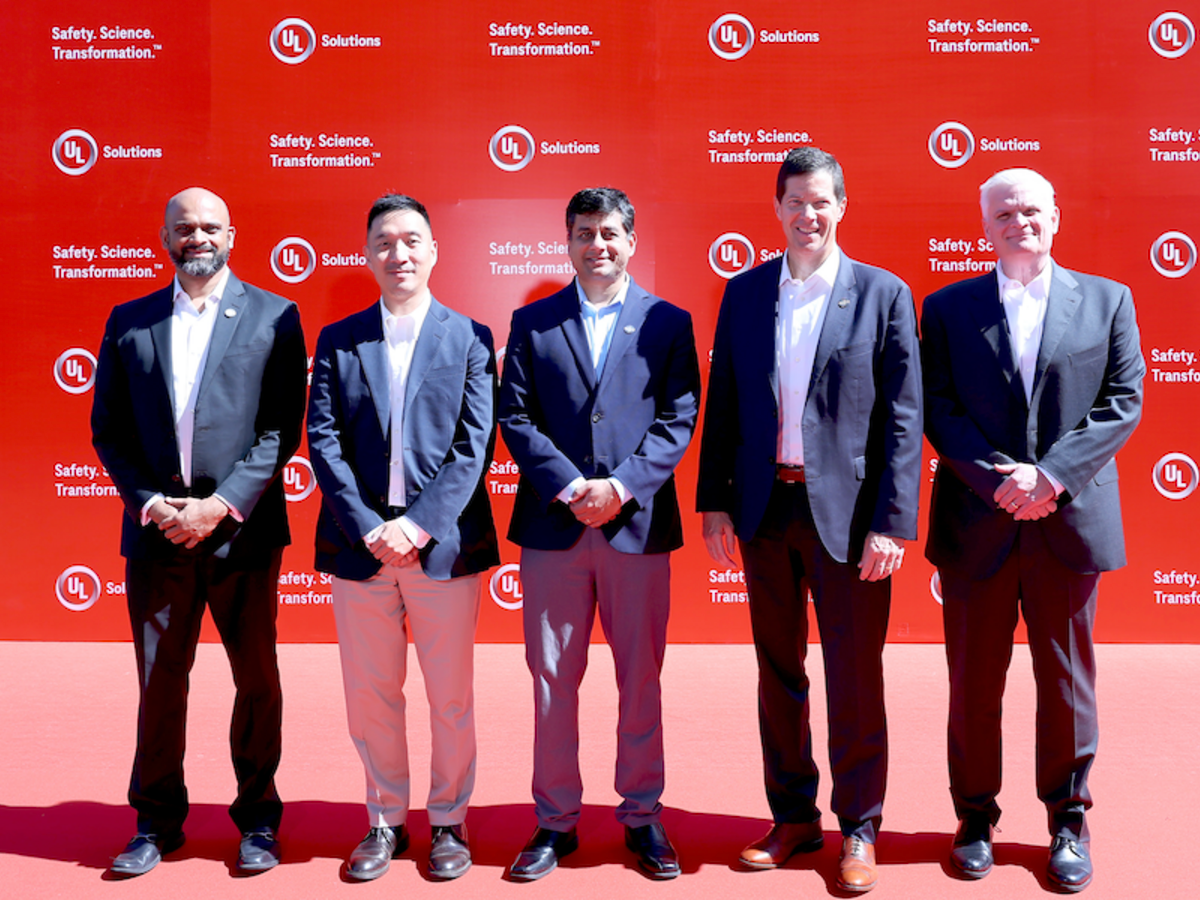
UL Solutions Global Vice President and Product Life Cycle General Manager Diana Coso and Jim O’Keefe, senior director and general manager of ComplianceWire® at UL Solutions
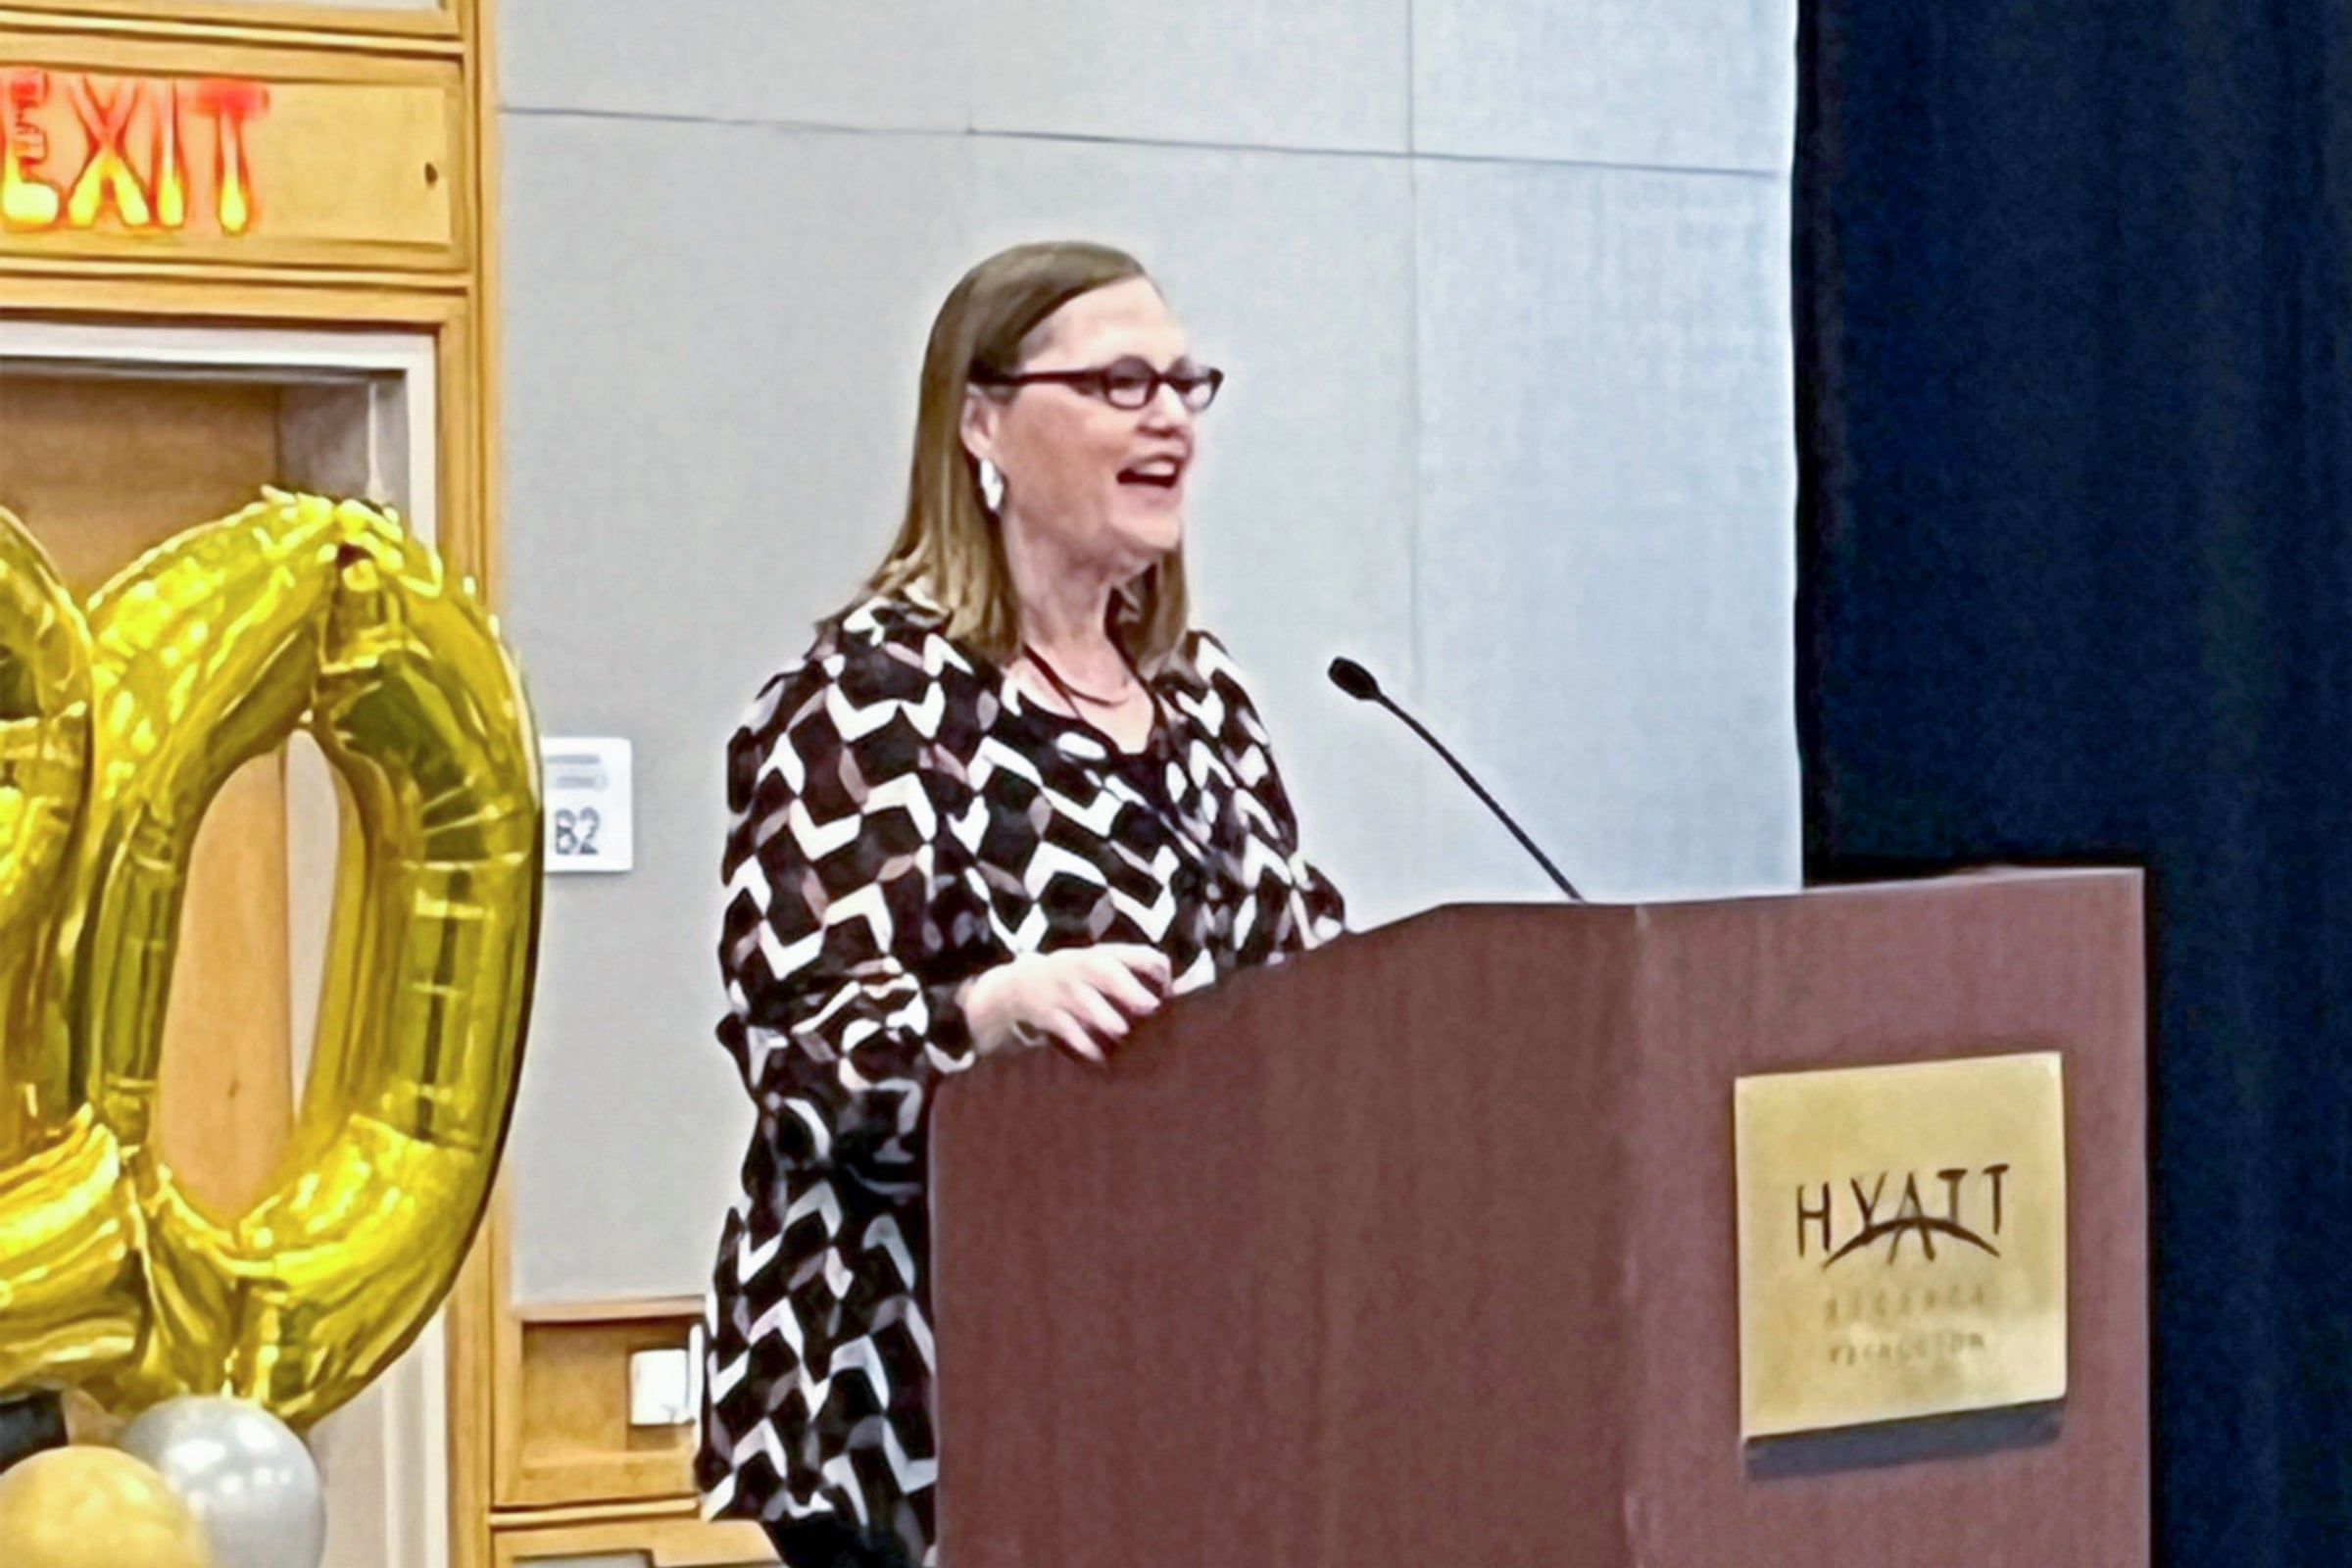
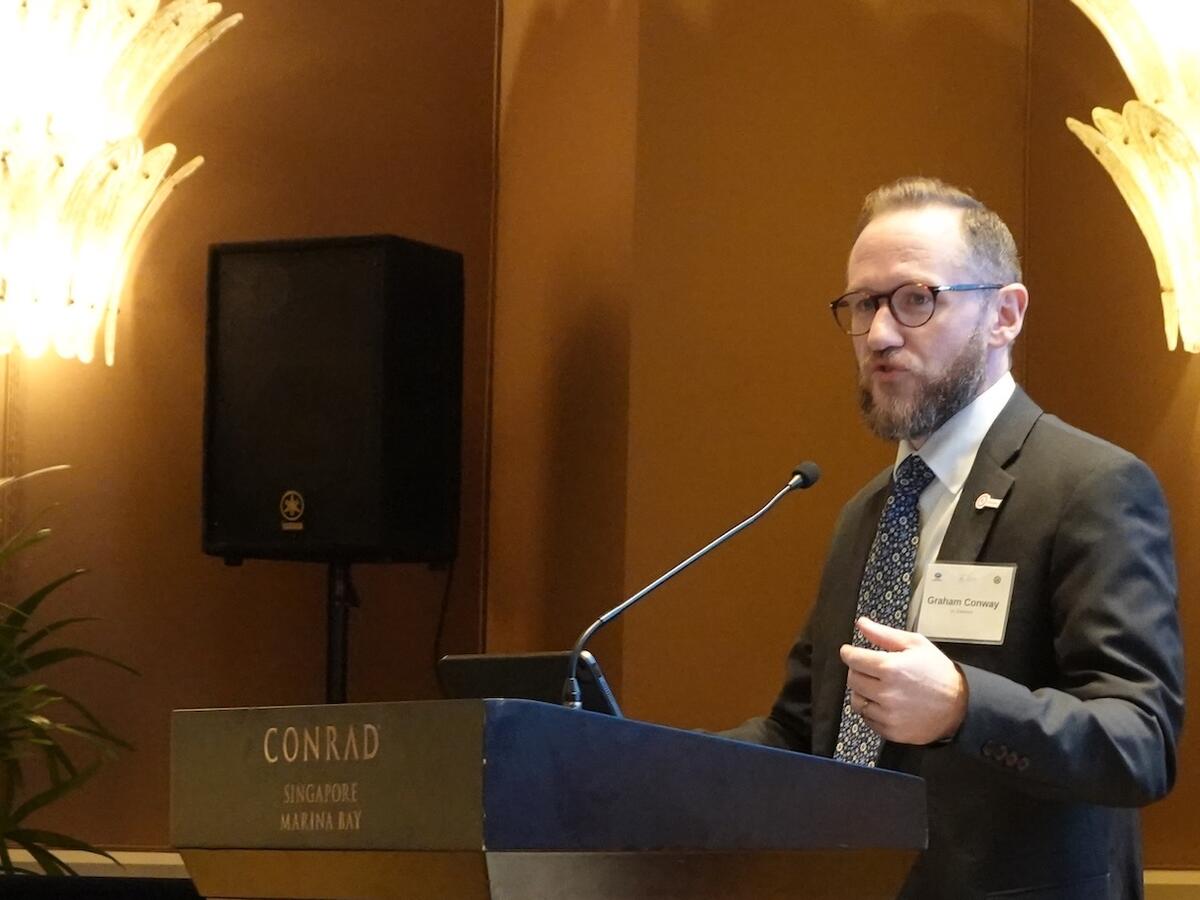
Deborah Jennings-Connor, Vice President of Regulatory Services, describes the full breadth of UL Solutions offerings across the entire environmental, social, and governance (ESG) spectrum throughout our 150 locations around the world.
Increased scrutiny from regulators and auditors
Dr. Mark Lee, head of research, analytics and business development at UL Solutions ComplianceWire®, noted the challenge of increased audit and inspection activities from regulators uncovered in the UL ComplianceWire® Annual Benchmarking Study, which will soon be published as a white paper. As the COVID-19 pandemic ebbs, Dr. Lee explained, entities including the U.S. Food and Drug Administration (FDA), European Medicines Agency (EMA) and Medical Device Single Audit Program (MDSAP) have begun coming out in full force both domestically and internationally, with the FDA providing no advanced notice before arriving at international facilities that may not have seen any in person inspections during the pandemic.
Key findings from auditors include organizations not adequately following their standard operating procedures (SOPs) and overreliance on written SOPs as a method of instruction. Simply providing written SOPs to employees and documenting readership is not an effective learning program. As an industry, we need to focus more on effective learning that ties into business performance and simultaneously supports compliance with regulatory requirements.
Through various data points from his original research, Dr. Lee exposed the problem and its pervasiveness: ineffective training, or training that fails to adequately prepare workers for their roles.
The most common citations FDA inspectors recently issued, for example, involve companies not fully following responsibilities applicable to their quality control units and requiring employees only to read written procedures rather than undergo fully developed, instructionally sound training programs.
Such developments are driving companies to renew their focus on audit and inspection readiness as well as conducting gap assessments to see if they can improve performance and compliance at the same time. In response, the ComplianceWire® team mapped the most common citations to a set of off-the-shelf courseware, co-developed with the FDA, that could help companies proactively address the most common compliance issues. UL Solutions offered that analysis to conference attendees.
Managing variables to quality
Providing a regulatory perspective in her keynote speech to the summit, Captain Jane Kreis, training officer for the FDA Import Operations Program, observed that ignorance of regulatory requirements constitutes the “biggest culprit” among companies whose management includes very good scientists, engineers and clinicians but sometimes lack necessary regulatory awareness. Kreis singled out training as a particular concern when it comes to life science companies adhering to quality and compliance parameters.
“Employees are your greatest variability to quality,” Kreis explained. “Training is successful when the training sticks.”
Related points Kreis raised include:
- Simply delivering training is not an end in itself. Employees are the biggest variable to quality. Competence, therefore, must be the goal to help mitigate this risk.
- Training should be ongoing, delivered via multiple modalities and assessed periodically to identify gaps and measure effectiveness.
- Management is not exempt. They must understand the regulations and their intent, as even top managers can be held accountable for a company’s violative practices, even if they are unaware of them.
- The FDA is receptive to partnership with industry through the Site Tours program. The FDA offers companies in good standing the opportunity to demonstrate their excellent-quality systems and earn recognition as site training facilities. The FDA, in turn, gains training opportunities for agency personnel, especially in new technologies.
Download Capt. Kreis’s full presentation
Industry Trends and Training Expectations FDA Partnership Opportunities: UL ComplianceWire® Knowledge Summit April 2023
1.05 MB
Download
ComplianceWire®-Knowledge-Summit-FDA-2023.pdf
Digestible training content
Moving beyond documenting readership toward more meaningful training can impact compliance as well as performance, according to conference presenters, but it requires active and ongoing effort. Companies must now consider different learning preferences and cognitive capabilities among their employees in addition to incorporating video and other forms of more digestible content. However, training content needs to be meaningful and memorable — not just exciting — to prove effective.
“If new information is not applied, people will forget 75% of your training content,” noted AstraZeneca Associate Director of Global Quality Operations and GxP Training Process Owner Nicole King during a presentation on training effectiveness.
King further highlighted the inadequacy of prevalent training models. Simply inundating personnel with standard operating procedure (SOP) documents on a “read and sign” basis fails to consider, for instance, that fully 20% of the population suffers from dyslexia, she explained.
King then outlined how AstraZeneca successfully broke with the status quo and built a repeatable learning model that employs the science of how human beings retain information.
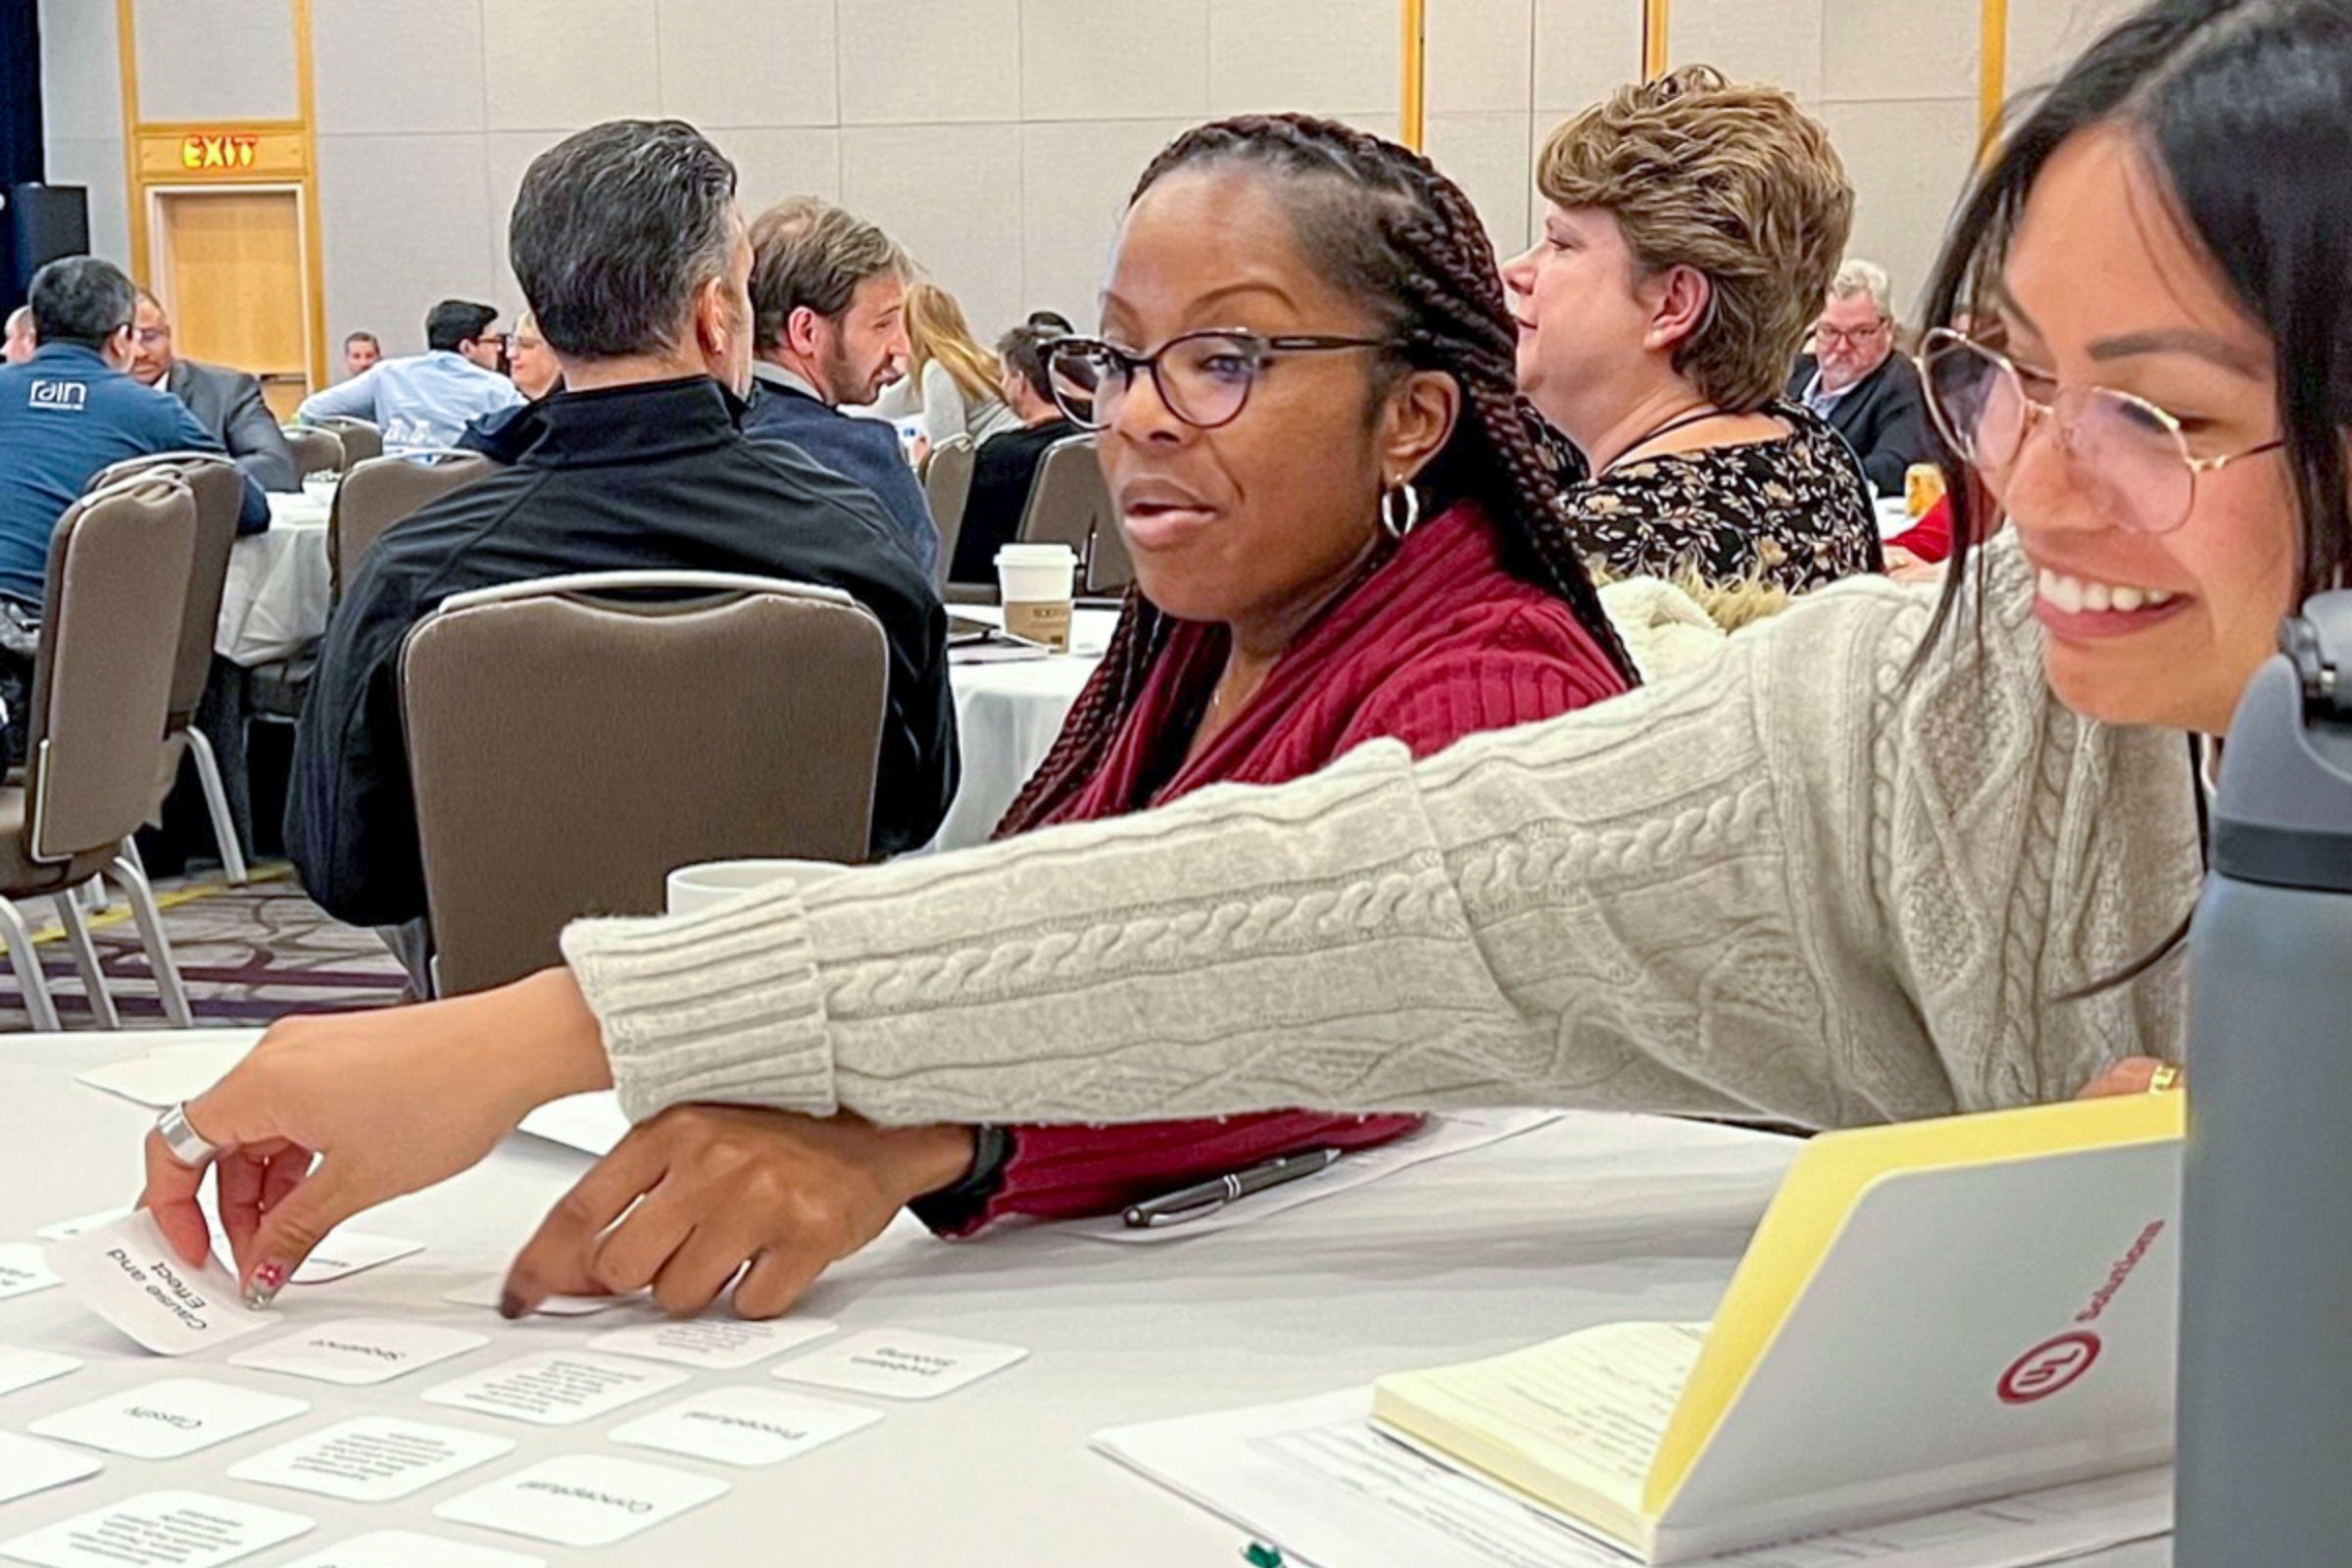
Conference attendees engage in a card game exercise during a presentation on instructional strategies.
Using a “break it, build it, deliver it” framework for implementing the change, AstraZeneca adopted a variety of techniques, including modularized, just-in-time coursework, multiple content modalities and point-of-use documentation and resources.
Tying training to quality management
Another key theme running through the ComplianceWire® Knowledge Summit was the need to nest training functions more fully within companies’ quality management operations, as training-related mistakes can often result in significant quality-related violations.
“Make sure your people know what a quality management system is,” the FDA’s Kreis said.
Jennifer Trundle, director of quality systems at Gilead Sciences Inc., explained the benefits (and risk mitigations) of such an approach during her presentation on GxP training to support more unified quality platforms. Trundle detailed how Gilead Sciences, one of the world’s largest biotechnology companies, marshaled its resources to deliver increased automation, efficiency and superior user experience to Gilead employees. She also explained Gilead’s approach to first modernizing their training, then integrating that training into Gilead’s overall quality ecosystem.
Working from a highly specific set of strategic goals and business drivers, Gilead developed technology to work horizontally across all the company’s learning resources, including ComplianceWire®. This approach delivered content in multiple modalities from multiple sources to Gilead employees with one homogenous user experience tuned to the needs of the modern learner. Application programming interface (API)-based integrations enabled Gilead to weave its learning platform with all quality systems into a coherent ecosystem that connects quality, regulatory and product information. This yielded important efficiencies in system management, reporting and user access.
Emerging life sciences training technologies
As more and more life science companies seek to speed up staff training timeframes in order to ultimately improve productivity, emerging technologies such as AI and biosimulation stand to play larger roles in how firms train and educate their employees.
Bryant Fields, vice president of integrated evidence at Medidata Solutions, and Ellen Leinfuss, senior vice president, commercial at Certara, Inc., discussed applications of AI and biosimulation, respectively, in life sciences operations.
Fields discussed using AI to address clinical research challenges, noting that Medidata maintains the world’s largest historical clinical trial database. He spoke at length about AI’s ability to leverage this data to increase probabilities of regulatory success via predictive simulated outcomes.
Leinfuss presented on biosimulation, which uses computer-based mathematical simulations to replicate biological processes, dynamics and systems. To help support patient safety, in some cases, biosimulation can be used to predict outcomes with minimal (or no) animal or human testing.

Leinfuss made clear that in terms of replacing clinical studies with biosimulation, progress is well underway: Over 100 novel drugs and 325 label claims have been approved by global regulators using Certara biosimulation data in lieu of some types of clinical studies, such as drug-drug interaction studies or formulation changes.
In terms of how these emerging technologies can more directly impact training, Dr. Damodharen Muniyandi, chief quality officer, Global Quality & Regulatory Affairs for Sai Life Sciences Ltd., provided an overview of the company’s innovative use of UL Solutions technology. Beginning with content development using the UL Solutions CREATE™ DIY course creation tool and ending with a course completion on the ComplianceWire® system; and integrating multiple sub-processes in between, Dr. Muniyandi and his team successfully collapsed learning delivery into a single integrated process.
Sai Life’s processes focus on three imperatives: reducing costs, compliance and growth. By consolidating processes, learning optimization and efficiency have dramatically improved at Sai Life, according to Dr. Muniyandi. Using the UL Solutions-powered platform ComplianceWire®, Sai Life’s current project docket includes competency mapping for skills enhancement, operational training modules for electronic systems and case studies that leverage artificial intelligence (AI) technology.
Toward an AI future for life sciences?
ComplianceWire®’s O’Keefe foresees further incorporation of AI and other emerging technologies into UL Solutions life sciences training offerings in order to more effectively support customers’ training and compliance needs.
“UL Solutions has been vital to delivering products to patients and consumers safely and swiftly for more than 100 years,” said O’Keefe during his remarks at the summit. “ComplianceWire® has partnered with the FDA as well as regulatory agencies in India and China for the past 26 years, and today, at our 20th annual summit, we and our industry partners are demonstrating how we’re employing AI to help accelerate compliance for pharmaceutical, medical device and biologics companies into the next decade.”
Acknowledging hundreds of millions of ComplianceWire® completions
Finally, the 20th Annual UL Solutions ComplianceWire® Knowledge Summit provided the opportunity to commemorate two major training milestones that included both the FDA and AbbVie. We were honored to present plaques to the FDA’s Kreis acknowledging the 600 millionth training completion by an agency staff member; and to a member of the AbbVie team commemorating the 500 millionth completion on the ComplianceWire® platform.
Related content
[
\
- Software
ComplianceWire®
---------------
\
[
\
[
\
X
Get connected with our sales team
Thanks for your interest in our products and services. Let's collect some information so we can connect you with the right person.
Please wait…
* Indicates a required field
*First Name:
*Last Name:
*Company name:
*Work email address:
*Service:...AdvisoryAuditing and InspectionCertificationLearning and DevelopmentSoftwareTestingVerificationOther
*Industry:...AppliancesAutomotive and MobilityBatteries and ComponentsBuildings and ConstructionChemicals and MaterialsEnergy and UtilitiesHealthcare and Life SciencesHVACRIndustrial Products and SystemsLightingOtherRetail and Consumer ProductsTechnology and ElectronicsWater and PlumbingWire and Cable
*Tell us more about your need:
Characters remaining: 500
*Purchase Timeframe:...Immediately1-3 months3-6 months6-12 months12-24 monthsNo specific timeframe
*Department:
*Job Title:
*Phone Number:
*Where do you live?...AfghanistanAland IslandsAlbaniaAlgeriaAndorraAngolaAnguillaArgentinaArmeniaAustraliaAustriaAzerbaijanBahamasBahrainBangladeshBarbadosBelgiumBelizeBeninBermudaBoliviaBonaire, Sint Eustatius and SabaBosnia and HerzegovinaBrazilBulgariaBurundiCambodiaCameroonCanadaCayman IslandsChileChinaColombiaComorosCongo, the Democratic Republic of theCongoCosta RicaCote d'IvoireCroatiaCuraçaoCyprusCzech RepublicDenmarkDominican RepublicEcuadorEgyptEl SalvadorEstoniaEthiopiaFijiFinlandFranceFrench PolynesiaGeorgiaGermanyGhanaGreeceGreenlandGuatemalaGuernseyHaitiHondurasHong KongHungaryIcelandIndiaIndonesiaIraqIrelandIsle of ManIsraelItalyJamaicaJapanJerseyJordanKazakhstanKenyaKuwaitKyrgyzstanLatviaLebanonLiechtensteinLithuaniaLuxembourgMacaoMadagascarMalawiMalaysiaMaldivesMaliMaltaMauritiusMexicoMonacoMongoliaMontenegroMoroccoMozambiqueMyanmarNamibiaNepalNetherlandsNew ZealandNicaraguaNigeriaNorwayOmanPakistanPanamaPapua New GuineaParaguayPeruPhilippinesPolandPortugalQatarRepublic of KoreaRepublic of MoldovaRepublic of North MacedoniaRomaniaRwandaSaint HelenaSaint Kitts and NevisSaudi ArabiaSenegalSerbiaSingaporeSlovakiaSloveniaSouth AfricaSouth SudanSpainSri LankaSwedenSwitzerlandTaiwanTanzaniaThailandTrinidad and TobagoTunisiaTürkiyeTurkmenistanUgandaUkraineUnited Arab EmiratesUnited KingdomUnited StatesUruguayUzbekistanVenezuela, Bolivarian Republic ofVietnamVirgin Islands, BritishYemenZambiaZimbabwe
*Preferred Language:...EnglishFrenchGermanItalianJapaneseKoreanPortugueseSimplified ChineseSpanishTraditional Chinese
(loading...)