February 11, 2026 Download (opens in new window) -- Provides 2026 Earnings Outlook -- -- Board Raises Quarterly Cash Dividend by 11% -- NEW YORK--(BUSINESS WIRE)-- Urban Edge Properties (NYSE: UE) (the "Company") today announced its results for the…
February 11, 2026
-- Provides 2026 Earnings Outlook --
-- Board Raises Quarterly Cash Dividend by 11% --
NEW YORK--(BUSINESS WIRE)-- Urban Edge Properties (NYSE: UE) (the "Company") today announced its results for the quarter and year ended December 31, 2025 and provided its initial outlook for full-year 2026.
“Urban Edge delivered an exceptional 2025,” said Jeff Olson, Chairman and CEO. “We signed over 360,000 sf of new leases during the year, generating record cash spreads of 32% and achieving record high shop occupancy of 92.6%. Our strong operating results drove a 6% increase in FFO as Adjusted per share over the prior year, ahead of our target. As a result of the higher earnings and taxable income, we are increasing our dividend by 11%.”
“Looking ahead, Urban Edge has entered 2026 in an excellent position. We remain focused on executing leases with leading retailers, prudent capital allocation, and careful management of our operating expenses while we seek additional acquisition opportunities to continue to provide strong earnings growth.”
Financial Results(1)(2)
|
|
|
|
|
|
|
|
|
|
|
| (in thousands, except per share amounts) |
|
4Q25 |
|
4Q24 |
|
|
FY 2025 |
|
FY 2024 |
|
| Net income attributable to common shareholders |
|
$ |
12,424 |
$ |
30,121 |
|
$ |
93,535 |
$ |
72,563 |
| Net income per diluted share |
|
|
0.10 |
|
0.24 |
|
|
0.74 |
|
0.60 |
| Funds from Operations ("FFO") |
|
|
45,191 |
|
45,350 |
|
|
186,379 |
|
186,732 |
| FFO per diluted share |
|
|
0.35 |
|
0.35 |
|
|
1.43 |
|
1.48 |
| FFO as Adjusted |
|
|
46,489 |
|
44,061 |
|
|
187,140 |
|
169,720 |
| FFO as Adjusted per diluted share |
|
|
0.36 |
|
0.34 |
|
|
1.43 |
|
1.35 |
Net income for the quarter ended December 31, 2025 decreased as compared to 2024 due to a $23.5 million, or $0.18 per diluted share, gain on sale of real estate related to the sale of a single-tenant property in 2024. Net income for the year ended December 31, 2025 increased as compared to the prior year driven by higher rental revenues, higher net recoveries and gains recognized on the sale of real estate in 2025. The increases in FFO as Adjusted for the quarter and year ended December 31, 2025 were driven by higher rental revenues and growth from accretive capital recycling. FFO as Adjusted for the year ended December 31, 2025 also benefited from higher net recovery revenue.
Same-Property Operating Results Compared to the Prior Year Period(1)(3)
|
|
|
|
|
|
|
|
|
4Q25 |
|
|
FY 2025 |
|
| Same-property NOI growth |
|
2.4 |
% |
|
4.3 |
% |
| Same-property NOI growth, including properties in redevelopment |
|
2.9 |
% |
|
5.0 |
% |
Increases in same-property NOI metrics for the quarter and year ended December 31, 2025 were driven by rent commencements on new leases and higher net recovery income, partially offset by higher snow removal expenses.
Leasing and Occupancy Results(1)
- The Company reported same-property portfolio leased occupancy of 96.7%, up 10 basis points compared to September 30, 2025 and down 50 basis points compared to December 31, 2024.
- Consolidated portfolio leased occupancy was 96.7%, up 40 basis points compared to September 30, 2025 and down 10 basis points compared to December 31, 2024.
- Retail shop leased occupancy was 92.6%, up 10 basis points compared to September 30, 2025, and up 170 basis points compared to December 31, 2024.
- The Company executed 47 new leases, renewals and options totaling 238,000 sf during the quarter. New leases totaled 73,000 sf, of which 37,000 sf was on a same-space basis and generated an average cash spread of 11%. New leases, renewals and options totaled 203,000 sf on a same-space basis and generated an average cash spread of 16%.
- During the year, the Company executed 162 new leases, renewals and options totaling 1,500,000 sf. New leases totaled 361,000 sf, of which 206,000 sf was on a same-space basis and generated an average cash spread of 32%. New leases, renewals and options totaled 1,345,000 sf on a same-space basis and generated an average cash spread of 14%.
- As of December 31, 2025, signed leases that have not yet rent commenced are expected to generate an additional $22.3 million of future annual gross rent, representing approximately 8% of 2025 NOI. Approximately $6.2 million of this amount is expected to be recognized in 2026.
Acquisition and Disposition Activity
During 2025, the Company acquired one asset, Brighton Mills, for $39 million at a 5.4% capitalization rate and sold $66.2 million of non-core assets at a 4.9% capitalization rate.
Brighton Mills is a 91,000 sf grocery-anchored property located in Allston, MA, which was acquired on October 23, 2025. It is located less than one mile from Harvard Business School's main campus in an area that has seen extensive growth, driven by Harvard's expansion and several new multi-family developments. The dense trade area has a 3-mile population of 449,000 people with average household incomes of $174,000. The transaction was funded using proceeds from the sales of Kennedy Commons and MacDade Commons in June 2025 via a 1031 exchange.
The Company is currently under contract to acquire a 92,000 sf shopping center, located in Bridgewater, NJ, for a gross purchase price of $54.3 million.
Financing Activity
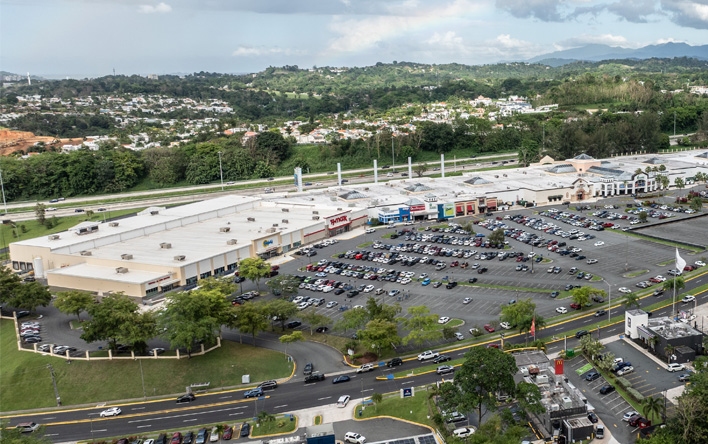
On October 27, 2025, the Company completed the modification of its $80.2 million mortgage loan secured by the Shops at Caguas. The modification resulted in a reduced fixed interest rate of 6.15% and a new maturity date of January 2031, with a three-year extension option to January 2034. Prior to the modification, the loan was bearing interest at a fixed rate of 6.6% and maturing in August 2033. The modification provides annual interest savings of approximately $0.4 million.
On December 10, 2025, the Company paid off the $23.3 million mortgage secured by its property, West End Commons, at maturity. The mortgage had a fixed interest rate of 4.0% and was repaid using cash on hand.
On January 22, 2026, the Company entered into $950 million of unsecured credit facilities, expanding its borrowing capacity by $150 million. The unsecured credit facilities are comprised of an unsecured line of credit and two delayed-draw term loans aggregating $250 million.
The Company’s existing revolving credit agreement was amended to reduce the unsecured line of credit by $100 million to $700 million and extend the maturity date to June 2030 with two six-month extension options. The term loans are $125 million each consisting of a 5-year maturity and a 7-year maturity, both of which have a 12-month delayed-draw feature. Based on the Company's current leverage ratio, borrowings under the unsecured line of credit, 5-year term loan and 7-year term loan bear interest at SOFR plus 1.00%, SOFR plus 1.15% and SOFR plus 1.50%, respectively.
No amounts are currently drawn on the unsecured line of credit or either of the two term loans. The Company expects to use future proceeds for working capital purposes as it executes on its growth plans.
Development and Redevelopment
The Company commenced four redevelopment projects with estimated aggregate costs of $28.1 million and stabilized three projects totaling $11.7 million with the rent commencements of Tesla at Totowa Commons; Dave's Hot Chicken and the expansion of Best Buy at Yonkers Gateway Center; and First Watch at Bergen Town Center. The three projects that were stabilized during the quarter are expected to generate an approximate 26% yield. Completed projects during 2025 totaled $55.3 million of investment with an expected average yield of approximately 19%.
As of December 31, 2025, the Company has $165.5 million of active development and redevelopment projects underway, with estimated remaining costs to complete of $85.6 million. The active development and redevelopment projects are expected to generate an approximate 14% yield.
Balance Sheet and Liquidity(1)(4)(5)
Balance sheet highlights as of December 31, 2025 include:
- Total liquidity of approximately $849 million, consisting of $79 million of cash on hand and $770 million available under the Company's $800 million unsecured line of credit, including undrawn letters of credit.
- Mortgages payable of $1.62 billion, with a weighted average term to maturity of 3.7 years, all of which are fixed rate or hedged.
- No outstanding balance on our $800 million unsecured line of credit that was due to mature on February 9, 2027, with two six-month extension options.
- Total market capitalization of approximately $4.17 billion comprised of 132.7 million fully-diluted common shares valued at $2.55 billion and $1.62 billion of debt.
- Net debt to total market capitalization of 37%.
2026 Outlook
The Company announced its outlook for full-year 2026 performance including anticipated net income of $0.49 to $0.54 per diluted share, FFO of $1.47 to $1.52 per diluted share, and FFO as Adjusted of $1.47 to $1.52 per diluted share, reflecting 4.5% growth at the midpoint compared to 2025. A reconciliation of the range of estimated earnings, FFO and FFO as Adjusted, the assumptions used in our guidance, and a reconciliation bridging 2025 FFO per diluted share to the 2026 estimates can be found on page 4 of this press release
Dividend
On February 10, 2026, the Board of Trustees declared a regular quarterly dividend of $0.21 per common share, resulting in an indicated annual rate of $0.84 per share, an annual increase of $0.08 per share or 11% over the prior annual rate. The dividend will be payable on March 31, 2026 to common shareholders of record on March 13, 2026.
Earnings Conference Call Information
The Company will host an earnings conference call and audio webcast on February 11, 2026 at 8:30 AM ET. All interested parties can access the earnings call by dialing 1-877-407-9716 (Toll Free) or 1-201-493-6779 (Toll/International) using conference ID 13757301. The call will also be webcast and available in listen-only mode on the investors page of our website: www.uedge.com
. A replay will be available at the webcast link on the investors page for one year following the conclusion of the call. A telephonic replay of the call will also be available starting February 11, 2026 at 11:30 AM ET through Wednesday, February 25, 2026 at 11:59 PM ET by dialing 1-844-512-2921 (Toll Free) or 1-412-317-6671 (Toll/International) using conference ID 13757301.
|
|
| (1) |
Refer to "Non-GAAP Financial Measures" and "Operating Metrics" for definitions and additional detail. Reported consolidated portfolio leased occupancy excludes the impact of Sunrise Mall. Including Sunrise Mall, consolidated portfolio leased occupancy was 90.1% at December 31, 2025. |
| (2) |
Refer to page 10 for a reconciliation of net income to FFO and FFO as Adjusted for the quarter and year ended December 31, 2025. |
| (3) |
Refer to page 11 for a reconciliation of net income to NOI and Same-Property NOI for the quarter and year ended December 31, 2025. |
| (4) |
Net debt as of December 31, 2025 is calculated as total consolidated debt of $1.6 billion less total cash and cash equivalents, including restricted cash, of $79 million. |
| (5) |
Availability under the unsecured line of credit is net of letters of credit issued. The Company obtained seven letters of credit aggregating $30.2 million which have reduced the available balance commensurate with their face values but remain undrawn and no separate liability has been recorded. |
2026 Earnings Guidance
The Company's 2026 earnings guidance anticipates net income of $0.49 to $0.54 per diluted share, FFO of $1.47 to $1.52 per diluted share, and FFO as Adjusted of $1.47 to $1.52 per diluted share. Below is a summary of the Company's 2026 outlook, assumptions used in its forecasting, and a reconciliation of the range of estimated earnings, FFO and FFO as Adjusted per diluted share.
The Company's full-year outlook is based on the following assumptions:
- Same-property NOI growth, including properties in redevelopment, of 2.75% to 3.75%.
- Recurring G&A expenses ranging from $34.5 million to $36.5 million.
- Interest and debt expense ranging from $78.9 million to $80.9 million.
- Acquisitions of $54 million, representing properties currently under contract.
- Excludes items that impact FFO comparability, including gains and/or losses on extinguishment of debt, transaction, severance, litigation, and other one-time items outside of the ordinary course of business.
|
|
|
|
|
|
|
|
|
|
|
|
|
|
|
|
|
Guidance 2026E |
|
|
|
|
|
|
|
Per Diluted Share(1) |
|
|
|
|
|
|
| (in thousands, except per share amounts) |
Low |
|
|
|
High |
|
|
|
Low |
|
|
|
High |
|
|
| Net income |
$ |
64,300 |
|
|
$ |
70,800 |
|
|
$ |
0.49 |
|
|
$ |
0.54 |
|
| Less net (income) loss attributable to noncontrolling interests in: |
|
|
|
|
|
|
|
|
|
|
|
|
|
|
|
| Operating partnership |
|
(3,300 |
) |
|
|
(3,600 |
) |
|
|
(0.03 |
) |
|
|
(0.03 |
) |
| Consolidated subsidiaries |
|
800 |
|
|
|
800 |
|
|
|
0.01 |
|
|
|
0.01 |
|
| Net income attributable to common shareholders |
|
61,800 |
|
|
|
68,000 |
|
|
|
0.47 |
|
|
|
0.52 |
|
| Adjustments: |
|
|
|
|
|
|
|
|
|
|
|
|
|
|
|
| Rental property depreciation and amortization |
|
127,100 |
|
|
|
127,100 |
|
|
|
0.97 |
|
|
|
0.97 |
|
| Limited partnership interests in operating partnership |
|
3,300 |
|
|
|
3,600 |
|
|
|
0.03 |
|
|
|
0.03 |
|
| FFO Applicable to diluted common shareholders |
|
192,200 |
|
|
|
198,700 |
|
|
|
1.47 |
|
|
|
1.52 |
|
| Adjustments to FFO: |
|
|
|
|
|
|
|
|
|
|
|
|
|
|
|
| Transaction, severance, litigation expenses and other |
|
600 |
|
|
|
600 |
|
|
|
— |
|
|
|
— |
|
| FFO as Adjusted applicable to diluted common shareholders |
$ |
192,800 |
|
|
$ |
199,300 |
|
|
$ |
1.47 |
|
|
$ |
1.52 |
|
|
|
| (1) |
Amounts may not foot due to rounding. |
The following table is a reconciliation bridging our 2025 FFO per diluted share to the Company's estimated 2026 FFO per diluted share:
|
|
|
|
|
|
|
|
|
Per Diluted Share(1) |
|
|
|
|
|
|
|
Low |
|
|
|
High |
|
|
| 2025 FFO applicable to diluted common shareholders |
$ |
1.43 |
|
|
$ |
1.43 |
|
| 2025 Items impacting FFO comparability(2) |
|
0.01 |
|
|
|
0.01 |
|
| Same-property NOI growth, including redevelopment |
|
0.06 |
|
|
|
0.08 |
|
| Acquisitions net of dispositions NOI growth |
|
0.03 |
|
|
|
0.03 |
|
| Interest and debt expense |
|
(0.02 |
) |
|
|
(0.01 |
) |
| Recurring general and administrative |
|
(0.01 |
) |
|
|
(0.01 |
) |
| Straight-line rent and non-cash items |
|
(0.01 |
) |
|
|
— |
|
| 2026 FFO applicable to diluted common shareholders |
$ |
1.47 |
|
|
$ |
1.52 |
|
|
|
| (1) |
Amounts may not foot due to rounding. |
| (2) |
Includes adjustments to FFO for fiscal year 2025 which impact comparability. See "Reconciliation of Net Income to FFO and FFO as Adjusted" on page 10 for more information. |
The Company is providing a projection of anticipated net income solely to satisfy the disclosure requirements of the Securities and Exchange Commission ("SEC"). The Company's projections are based on management’s current beliefs and assumptions about the Company's business, and the industry and the markets in which it operates; there are known and unknown risks and uncertainties associated with these projections. There can be no assurance that actual results will not differ from the guidance set forth above. The Company assumes no obligation to update publicly any forward-looking statements, including its 2026 earnings guidance, whether as a result of new information, future events or otherwise. Please refer to the “Forward-Looking Statements” disclosures on page 7 of this document and “Risk Factors” disclosed in the Company's annual and quarterly reports filed with the SEC for more information.
Non-GAAP Financial Measures
The Company uses certain non-GAAP performance measures, in addition to the primary GAAP presentations, as we believe these measures improve the understanding of the Company's operational results. We continually evaluate the usefulness, relevance, limitations, and calculation of our reported non-GAAP performance measures to determine how best to provide relevant information to the investing public, and thus such reported measures are subject to change. The Company's non-GAAP performance measures have limitations as they do not include all items of income and expense that affect operations, and accordingly, should always be considered as supplemental financial results. Additionally, the Company's computation of non-GAAP metrics may not be comparable to similarly titled non-GAAP metrics reported by other real estate investment trusts ("REITs") or real estate companies that define these metrics differently and, as a result, it is important to understand the manner in which the Company defines and calculates each of its non-GAAP metrics. The following non-GAAP measures are commonly used by the Company and investing public to understand and evaluate our operating results and performance:
- FFO: The Company believes FFO is a useful, supplemental measure of its operating performance that is a recognized metric used extensively by the real estate industry and, in particular REITs. FFO, as defined by the National Association of Real Estate Investment Trusts ("Nareit") and the Company, is net income (computed in accordance with GAAP), excluding gains (or losses) from sales of depreciable real estate and land when connected to the main business of a REIT, impairments on depreciable real estate or land related to a REIT's main business, earnings from consolidated partially owned entities and rental property depreciation and amortization expense. The Company believes that financial analysts, investors and shareholders are better served by the presentation of comparable period operating results generated from FFO primarily because it excludes the assumption that the value of real estate assets diminishes predictably. FFO does not represent cash flows from operating activities in accordance with GAAP, should not be considered an alternative to net income as an indication of our performance, and is not indicative of cash flow as a measure of liquidity or our ability to make cash distributions.
- FFO as Adjusted: The Company provides disclosure of FFO as Adjusted because it believes it is a useful supplemental measure of its core operating performance that facilitates comparability of historical financial periods. FFO as Adjusted is calculated by making certain adjustments to FFO to account for items the Company does not believe are representative of ongoing core operating results, including non-comparable revenues and expenses. The Company's method of calculating FFO as Adjusted may be different from methods used by other REITs and, accordingly, may not be comparable to such other REITs.
- NOI: The Company uses NOI internally to make investment and capital allocation decisions and to compare the unlevered performance of our properties to our peers. The Company believes NOI is useful to investors as a performance measure because, when compared across periods, NOI reflects the impact on operations from trends in occupancy rates, rental rates, operating costs and acquisition and disposition activity on an unleveraged basis, providing perspective not immediately apparent from net income. The Company calculates NOI using net income as defined by GAAP reflecting only those income and expense items that are incurred at the property level and through the Company's captive insurance program, adjusted for non-cash rental income and expense, impairments on depreciable real estate or land, and income or expenses that we do not believe are representative of ongoing operating results, if any. In addition, the Company uses NOI margin, calculated as NOI divided by total property revenue, which the Company believes is useful to investors for similar reasons.
- Same-property NOI: The Company provides disclosure of NOI on a same-property basis, which includes the results of properties that were owned and operated for the entirety of the reporting periods being compared, which total 65 and 63 properties for the quarters and years ended December 31, 2025 and 2024, respectively. Information provided on a same-property basis excludes properties under development, redevelopment or that involve anchor repositioning where a substantial portion of the gross leasable area ("GLA") is taken out of service and also excludes properties acquired, sold, or that are in the foreclosure process during the periods being compared, and results of our captive insurance program. As such, same-property NOI assists in eliminating disparities in net income due to the development, redevelopment, acquisition, disposition, or foreclosure of properties and results of our captive insurance program during the periods presented, and thus provides a more consistent performance measure for the comparison of the operating performance of the Company's properties. While there is judgment surrounding changes in designations, a property is removed from the same-property pool when it is designated as a redevelopment property because it is undergoing significant renovation or retenanting pursuant to a formal plan that is expected to have a significant impact on its operating income. A development or redevelopment property is moved back to the same-property pool once a substantial portion of the NOI growth expected from the development or redevelopment is reflected in both the current and comparable prior year period, generally one year after at least 80% of the expected NOI from the project is realized on a cash basis. Acquisitions are moved into the same-property pool once we have owned the property for the entirety of the comparable periods and the property is not under significant development or redevelopment. The Company has also provided disclosure of NOI on a same-property basis adjusted to include redevelopment properties. Same-property NOI may include other adjustments as detailed in the Reconciliation of Net Income to NOI and same-property NOI included in the tables accompanying this press release.
- EBITDAre and Adjusted EBITDAre: EBITDAre and Adjusted EBITDAre are supplemental, non-GAAP measures utilized by us in various financial ratios. The White Paper on EBITDAre, approved by Nareit's Board of Governors in September 2017, defines EBITDAre as net income (computed in accordance with GAAP), adjusted for interest expense, income tax (benefit) expense, depreciation and amortization, losses and gains on the disposition of depreciated property, impairment write-downs of depreciated property and investments in unconsolidated joint ventures, and adjustments to reflect the entity's share of EBITDAre of unconsolidated joint ventures. EBITDAre and Adjusted EBITDAre are presented to assist investors in the evaluation of REITs, as a measure of the Company's operational performance as they exclude various items that do not relate to or are not indicative of our operating performance and because they approximate key performance measures in our debt covenants. Accordingly, the Company believes that the use of EBITDAre and Adjusted EBITDAre, as opposed to income before income taxes, in various ratios provides meaningful performance measures related to the Company's ability to meet various coverage tests for the stated periods. Adjusted EBITDAre may include other adjustments not indicative of operating results as detailed in the Reconciliation of Net Income to EBITDAre and Adjusted EBITDAre included in the tables accompanying this press release. The Company also presents the ratio of net debt (net of cash) to annualized Adjusted EBITDAre as of December 31, 2025, and net debt (net of cash) to total market capitalization, which it believes is useful to investors as a supplemental measure in evaluating the Company's balance sheet leverage. The presentation of EBITDAre and Adjusted EBITDAre is consistent with EBITDA and Adjusted EBITDA as presented in prior periods.
The Company believes net income is the most directly comparable GAAP financial measure to the non-GAAP performance measures outlined above. Reconciliations of these measures to net income have been provided in the tables accompanying this press release.
Operating Metrics
The Company presents certain operating metrics related to our properties, including occupancy, leasing activity and rental rates. Operating metrics used by the Company are useful to investors in facilitating an understanding of the operational performance for our properties.
Recovery ratios represent the percentage of operating expenses recuperated through tenant reimbursements. This metric is presented on a same-property and same-property including redevelopment basis and is calculated by dividing tenant expense reimbursements (adjusted to exclude any ancillary income) by the sum of real estate taxes and property operating expenses.
Occupancy metrics represent the percentage of occupied gross leasable area based on executed leases (including properties in development and redevelopment) and include leases signed, but for which rent has not yet commenced. Same-property portfolio leased occupancy includes properties that have been owned and operated for the entirety of the reporting periods being compared, which total 65 and 63 properties for the quarters and years ended December 31, 2025 and 2024, respectively. Occupancy metrics presented for the Company's same-property portfolio exclude properties under development, redevelopment or that involve anchor repositioning where a substantial portion of the gross leasable area is taken out of service and also excludes properties acquired within the past 12 months or properties sold, and properties that are in the foreclosure process during the periods being compared.
Executed new leases, renewals and exercised options are presented on a same-space basis. Same-space leases represent those leases signed on spaces for which there was a previous lease.
The Company occasionally provides disclosures by tenant categories which include anchors, shops and industrial/self-storage. Anchors and shops are further broken down by local, regional, and national tenants. We define anchor tenants as those who have a leased area of >10,000 sf. Local tenants are defined as those with less than five locations. Regional tenants are those with five or more locations in a single region. National tenants are defined as those with five or more locations and operate in two or more regions.
ADDITIONAL INFORMATION
For a copy of the Company’s supplemental disclosure package, please access the "Investors" section of our website at www.uedge.com
. Our website also includes other financial information, including our Annual Report on Form 10-K, Quarterly Reports on Form 10-Q, Current Reports on Form 8-K, and any amendments to those reports.
The Company uses, and intends to continue to use, the “Investors” page of its website, which can be found at www.uedge.com
, as a means of disclosing material nonpublic information and of complying with its disclosure obligations under Regulation FD, including, without limitation, through the posting of investor presentations that may include material nonpublic information. Accordingly, investors should monitor the “Investors” page, in addition to following the Company's press releases, SEC filings, public conference calls, presentations and webcasts. The information contained on, or that may be accessed through, our website is not incorporated by reference into, and is not a part of, this document.
ABOUT URBAN EDGE
Urban Edge Properties is a NYSE listed real estate investment trust focused on owning, managing, acquiring, developing, and redeveloping retail real estate in urban communities, primarily in the Washington, D.C. to Boston corridor. Urban Edge owns 73 properties totaling 17.2 million square feet of gross leasable area.
FORWARD-LOOKING STATEMENTS
Certain statements contained herein constitute forward-looking statements as such term is defined in Section 27A of the Securities Act of 1933, as amended (the "Securities Act"), and Section 21E of the Securities Exchange Act of 1934, as amended (the "Exchange Act"). Forward-looking statements are not guarantees of future performance. They represent our intentions, plans, expectations and beliefs and are subject to numerous assumptions, risks and uncertainties. Our future results, financial condition, business and targeted occupancy may differ materially from those expressed in these forward-looking statements. You can identify many of these statements by words such as “approximates,” “believes,” “expects,” “anticipates,” “estimates,” “intends,” “plans,” “would,” “may” or other similar expressions in this press release. Many of the factors that will determine the outcome of forward-looking statements are beyond our ability to control or predict and include, among others: (i) macroeconomic conditions, including geopolitical conditions and instability, and international trade disputes, including any related tariffs, which may lead to rising inflation, adverse impacts to supply chains, and disruption of, or lack of access to, the capital markets, as well as potential volatility in the Company’s share price; (ii) the economic, political and social impact of, and uncertainty relating to, epidemics and pandemics; (iii) the loss or bankruptcy of major tenants; (iv) the ability and willingness of the Company’s tenants to renew their leases with the Company upon expiration and the Company’s ability to re-lease its properties on the same or better terms, or at all, in the event of non-renewal or in the event the Company exercises its right to replace an existing tenant; (v) the impact of e-commerce on our tenants’ business; (vi) the Company’s success in implementing its business strategy and its ability to identify, underwrite, finance, consummate and integrate diversifying acquisitions and investments; (vii) changes in general economic conditions or economic conditions in the markets in which the Company competes, and their effect on the Company’s revenues, earnings and funding sources, and on those of its tenants; (viii) increases in the Company’s borrowing costs as a result of changes in interest rates, rising inflation, and other factors; (ix) the Company’s ability to pay down, refinance, hedge, restructure or extend its indebtedness as it becomes due and potential limitations on the Company’s ability to borrow funds under its existing credit facility as a result of covenants relating to the Company’s financial results; (x) potentially higher costs associated with the Company’s development, redevelopment and anchor repositioning projects, and the Company’s ability to lease the properties at projected rates; (xi) the Company’s liability for environmental matters; (xii) damage to the Company’s properties from catastrophic weather and other natural events, and the physical effects of climate change; (xiii) the Company’s ability and willingness to maintain its qualification as a REIT in light of economic, market, legal, tax and other considerations; (xiv) information technology security breaches; (xv) the loss of key executives; and (xvi) the accuracy of methodologies and estimates regarding our environmental, social and governance (collectively, our Corporate Responsibility or “CR”) metrics, goals and targets, tenant willingness and ability to collaborate towards reporting CR metrics and meeting CR goals and targets, and the impact of governmental regulation on our CR efforts. For further discussion of factors that could materially affect the outcome of our forward-looking statements, see “Risk Factors” in Part I, Item 1A, of the Company's Annual Report on Form 10-K for the year ended December 31, 2025 and the other documents filed by the Company with the Securities and Exchange Commission (the "SEC").
We claim the protection of the safe harbor for forward-looking statements contained in the Private Securities Litigation Reform Act of 1995 for any forward-looking statements included in this press release. You are cautioned not to place undue reliance on forward-looking statements, which speak only as of the date of this press release. All subsequent written and oral forward-looking statements attributable to us or any person acting on our behalf are expressly qualified in their entirety by the cautionary statements contained or referred to in this section. We do not undertake any obligation to release publicly any revisions to our forward-looking statements to reflect events or circumstances occurring after the date of this press release.
|
|
|
|
|
|
|
|
| URBAN EDGE PROPERTIESCONSOLIDATED BALANCE SHEETS(In thousands, except share and per share amounts) |
|
|
|
|
|
|
|
|
|
|
|
|
|
|
|
|
December 31, |
|
|
|
December 31, |
|
|
|
|
2025 |
|
|
|
2024 |
|
| ASSETS |
|
|
|
|
|
|
|
| Real estate, at cost: |
|
|
|
|
|
|
|
| Land |
$ |
669,078 |
|
|
$ |
660,198 |
|
| Buildings and improvements |
|
2,835,540 |
|
|
|
2,791,728 |
|
| Construction in progress |
|
327,413 |
|
|
|
289,057 |
|
| Furniture, fixtures and equipment |
|
13,059 |
|
|
|
11,296 |
|
| Total |
|
3,845,090 |
|
|
|
3,752,279 |
|
| Accumulated depreciation and amortization |
|
(935,548 |
) |
|
|
(886,886 |
) |
| Real estate, net |
|
2,909,542 |
|
|
|
2,865,393 |
|
| Operating lease right-of-use assets |
|
58,917 |
|
|
|
65,491 |
|
| Cash and cash equivalents |
|
48,881 |
|
|
|
41,373 |
|
| Restricted cash |
|
29,984 |
|
|
|
49,267 |
|
| Tenant and other receivables |
|
26,658 |
|
|
|
20,672 |
|
| Receivables arising from the straight-lining of rents |
|
63,842 |
|
|
|
61,164 |
|
| Identified intangible assets, net of accumulated amortization of $70,514 and $65,027, respectively |
|
87,591 |
|
|
|
109,827 |
|
| Deferred leasing costs, net of accumulated amortization of $21,982 and $22,488, respectively |
|
31,220 |
|
|
|
27,799 |
|
| Prepaid expenses and other assets |
|
55,236 |
|
|
|
70,554 |
|
| Total assets |
$ |
3,311,871 |
|
|
$ |
3,311,540 |
|
|
|
|
|
|
|
|
|
| LIABILITIES AND EQUITY |
|
|
|
|
|
|
|
| Liabilities: |
|
|
|
|
|
|
|
| Mortgages payable, net |
$ |
1,606,774 |
|
|
$ |
1,569,753 |
|
| Unsecured credit facility |
|
— |
|
|
|
50,000 |
|
| Operating lease liabilities |
|
56,329 |
|
|
|
62,585 |
|
| Accounts payable, accrued expenses and other liabilities |
|
97,397 |
|
|
|
89,982 |
|
| Identified intangible liabilities, net of accumulated amortization of $59,668 and $50,275, respectively |
|
174,899 |
|
|
|
177,496 |
|
| Total liabilities |
|
1,935,399 |
|
|
|
1,949,816 |
|
| Commitments and contingencies |
|
|
|
|
|
|
|
| Shareholders’ equity: |
|
|
|
|
|
|
|
| Common shares: $0.01 par value; 500,000,000 shares authorized and 125,912,647 and 125,450,684 shares issued and outstanding, respectively |
|
1,257 |
|
|
|
1,253 |
|
| Additional paid-in capital |
|
1,163,939 |
|
|
|
1,149,981 |
|
| Accumulated other comprehensive (loss) income |
|
(703 |
) |
|
|
177 |
|
| Accumulated earnings |
|
124,566 |
|
|
|
126,670 |
|
| Noncontrolling interests: |
|
|
|
|
|
|
|
| Operating partnership |
|
69,140 |
|
|
|
65,069 |
|
| Consolidated subsidiaries |
|
18,273 |
|
|
|
18,574 |
|
| Total equity |
|
1,376,472 |
|
|
|
1,361,724 |
|
| Total liabilities and equity |
$ |
3,311,871 |
|
|
$ |
3,311,540 |
|
|
|
|
|
|
|
|
|
|
|
|
|
|
|
|
|
| URBAN EDGE PROPERTIESCONSOLIDATED STATEMENTS OF INCOME(In thousands, except per share amounts) |
|
|
|
|
|
|
|
|
|
|
|
|
|
|
|
|
|
|
|
|
|
|
|
|
|
|
|
|
|
|
|
|
Quarter Ended December 31, |
|
|
|
|
|
|
|
Year Ended December 31, |
|
|
|
|
|
|
|
|
2025 |
|
|
|
2024 |
|
|
|
2025 |
|
|
|
2024 |
|
| REVENUE |
|
|
|
|
|
|
|
|
|
|
|
|
|
|
|
| Rental revenue |
$ |
119,489 |
|
|
$ |
116,298 |
|
|
$ |
470,689 |
|
|
$ |
444,465 |
|
| Other income |
|
71 |
|
|
|
69 |
|
|
|
1,246 |
|
|
|
501 |
|
| Total revenue |
|
119,560 |
|
|
|
116,367 |
|
|
|
471,935 |
|
|
|
444,966 |
|
| EXPENSES |
|
|
|
|
|
|
|
|
|
|
|
|
|
|
|
| Depreciation and amortization |
|
32,538 |
|
|
|
37,483 |
|
|
|
139,166 |
|
|
|
150,389 |
|
| Real estate taxes |
|
16,697 |
|
|
|
16,509 |
|
|
|
66,428 |
|
|
|
68,651 |
|
| Property operating |
|
24,101 |
|
|
|
21,588 |
|
|
|
86,435 |
|
|
|
78,776 |
|
| General and administrative |
|
9,751 |
|
|
|
9,645 |
|
|
|
39,975 |
|
|
|
37,474 |
|
| Lease expense |
|
3,187 |
|
|
|
3,493 |
|
|
|
13,168 |
|
|
|
13,169 |
|
| Other expense |
|
— |
|
|
|
— |
|
|
|
349 |
|
|
|
— |
|
| Total expenses |
|
86,274 |
|
|
|
88,718 |
|
|
|
345,521 |
|
|
|
348,459 |
|
| Gain on sale of real estate |
|
— |
|
|
|
23,469 |
|
|
|
49,695 |
|
|
|
38,818 |
|
| Interest income |
|
670 |
|
|
|
639 |
|
|
|
2,768 |
|
|
|
2,667 |
|
| Interest and debt expense |
|
(19,566 |
) |
|
|
(19,583 |
) |
|
|
(78,232 |
) |
|
|
(81,587 |
) |
| (Loss) gain on extinguishment of debt |
|
(857 |
) |
|
|
(4 |
) |
|
|
(534 |
) |
|
|
21,423 |
|
| Income before income taxes |
|
13,533 |
|
|
|
32,170 |
|
|
|
100,111 |
|
|
|
77,828 |
|
| Income tax expense |
|
(739 |
) |
|
|
(664 |
) |
|
|
(2,601 |
) |
|
|
(2,386 |
) |
| Net income |
|
12,794 |
|
|
|
31,506 |
|
|
|
97,510 |
|
|
|
75,442 |
|
| Less net (income) loss attributable to noncontrolling interests in: |
|
|
|
|
|
|
|
|
|
|
|
|
|
|
|
| Operating partnership |
|
(666 |
) |
|
|
(1,571 |
) |
|
|
(4,992 |
) |
|
|
(3,978 |
) |
| Consolidated subsidiaries |
|
296 |
|
|
|
186 |
|
|
|
1,017 |
|
|
|
1,099 |
|
| Net income attributable to common shareholders |
$ |
12,424 |
|
|
$ |
30,121 |
|
|
$ |
93,535 |
|
|
$ |
72,563 |
|
|
|
|
|
|
|
|
|
|
|
|
|
|
|
|
|
| Earnings per common share - Basic: |
$ |
0.10 |
|
|
$ |
0.24 |
|
|
$ |
0.74 |
|
|
$ |
0.60 |
|
| Earnings per common share - Diluted: |
$ |
0.10 |
|
|
$ |
0.24 |
|
|
$ |
0.74 |
|
|
$ |
0.60 |
|
| Weighted average shares outstanding - Basic |
|
125,812 |
|
|
|
124,945 |
|
|
|
125,686 |
|
|
|
121,324 |
|
| Weighted average shares outstanding - Diluted |
|
130,703 |
|
|
|
129,701 |
|
|
|
125,907 |
|
|
|
121,432 |
|
Reconciliation of Net Income to FFO and FFO as Adjusted
The following table reflects the reconciliation of net income to FFO and FFO as Adjusted for the quarters and years ended December 31, 2025 and 2024. Net income is considered the most directly comparable GAAP measure. Refer to "Non-GAAP Financial Measures" on page 5 for a description of FFO and FFO as Adjusted.
|
|
|
|
|
|
|
|
|
|
|
|
|
|
|
|
|
Quarter EndedDecember 31, |
|
|
|
|
|
|
|
Year EndedDecember 31, |
|
|
|
|
|
|
| (in thousands, except per share amounts) |
|
2025 |
|
|
|
2024 |
|
|
|
2025 |
|
|
|
2024 |
|
| Net income |
$ |
12,794 |
|
|
$ |
31,506 |
|
|
$ |
97,510 |
|
|
$ |
75,442 |
|
| Less net (income) loss attributable to noncontrolling interests in: |
|
|
|
|
|
|
|
|
|
|
|
|
|
|
|
| Consolidated subsidiaries |
|
296 |
|
|
|
186 |
|
|
|
1,017 |
|
|
|
1,099 |
|
| Operating partnership |
|
(666 |
) |
|
|
(1,571 |
) |
|
|
(4,992 |
) |
|
|
(3,978 |
) |
| Net income attributable to common shareholders |
|
12,424 |
|
|
|
30,121 |
|
|
|
93,535 |
|
|
|
72,563 |
|
| Adjustments: |
|
|
|
|
|
|
|
|
|
|
|
|
|
|
|
| Rental property depreciation and amortization |
|
32,101 |
|
|
|
37,127 |
|
|
|
137,547 |
|
|
|
149,009 |
|
| Limited partnership interests in operating partnership |
|
666 |
|
|
|
1,571 |
|
|
|
4,992 |
|
|
|
3,978 |
|
| Gain on sale of real estate |
|
— |
|
|
|
(23,469 |
) |
|
|
(49,695 |
) |
|
|
(38,818 |
) |
| FFO Applicable to diluted common shareholders |
|
45,191 |
|
|
|
45,350 |
|
|
|
186,379 |
|
|
|
186,732 |
|
| FFO per diluted common share(1) |
|
0.35 |
|
|
|
0.35 |
|
|
|
1.43 |
|
|
|
1.48 |
|
| Adjustments to FFO: |
|
|
|
|
|
|
|
|
|
|
|
|
|
|
|
| Transaction, severance, litigation expenses and other, net(2) |
|
459 |
|
|
|
248 |
|
|
|
4,997 |
|
|
|
1,402 |
|
| Loss (gain) on extinguishment of debt(3) |
|
857 |
|
|
|
4 |
|
|
|
534 |
|
|
|
(21,423 |
) |
| Impact of property in foreclosure |
|
— |
|
|
|
— |
|
|
|
— |
|
|
|
2,276 |
|
| Non-cash adjustments(4) |
|
— |
|
|
|
(1,541 |
) |
|
|
(4,741 |
) |
|
|
848 |
|
| Tenant bankruptcy settlement income |
|
(18 |
) |
|
|
— |
|
|
|
(29 |
) |
|
|
(115 |
) |
| FFO as Adjusted applicable to diluted common shareholders |
$ |
46,489 |
|
|
$ |
44,061 |
|
|
$ |
187,140 |
|
|
$ |
169,720 |
|
| FFO as Adjusted per diluted common share(1) |
$ |
0.36 |
|
|
$ |
0.34 |
|
|
$ |
1.43 |
|
|
$ |
1.35 |
|
|
|
|
|
|
|
|
|
|
|
|
|
|
|
|
|
| Weighted Average diluted common shares(1) |
|
130,703 |
|
|
|
129,701 |
|
|
|
130,667 |
|
|
|
126,095 |
|
|
|
| (1) |
Weighted average diluted shares used to calculate FFO per share and FFO as Adjusted per share for the years ended December 31, 2025 and December 31, 2024 are higher than the GAAP weighted average diluted shares as a result of the dilutive impact of LTIP and OP units which may be redeemed for our common shares. |
| (2) |
Includes $0.3 million of transaction costs and $0.2 million of severance expense for the quarter ended December 31, 2025. Includes $3.2 million of severance expense, $2.4 million of transaction costs and $0.6 million of other income for the year ended December 31, 2025. |
| (3) |
The gain on extinguishment of debt for the year ended December 31, 2024 relates to the mortgage debt forgiven in the foreclosure settlement of Kingswood Center. |
| (4) |
Includes the acceleration and write-off of lease intangibles related to high-risk tenants, bankruptcies and terminations, net of reinstatements for tenants moved back to accrual basis accounting. |
Reconciliation of Net Income to NOI and Same-Property NOI
The following table reflects the reconciliation of net income to NOI, same-property NOI and same-property NOI including properties in redevelopment for the quarters and years ended December 31, 2025 and 2024. Net income is considered the most directly comparable GAAP measure. Refer to "Non-GAAP Financial Measures" on page 5 for a description of NOI and same-property NOI.
|
|
|
|
|
|
|
|
|
|
|
|
|
|
|
|
|
Quarter EndedDecember 31, |
|
|
|
|
|
|
|
Year EndedDecember 31, |
|
|
|
|
|
|
| (Amounts in thousands) |
|
2025 |
|
|
|
2024 |
|
|
|
2025 |
|
|
|
2024 |
|
| Net income |
$ |
12,794 |
|
|
$ |
31,506 |
|
|
$ |
97,510 |
|
|
$ |
75,442 |
|
| Depreciation and amortization |
|
32,538 |
|
|
|
37,483 |
|
|
|
139,166 |
|
|
|
150,389 |
|
| Interest and debt expense |
|
19,566 |
|
|
|
19,583 |
|
|
|
78,232 |
|
|
|
81,587 |
|
| General and administrative expense |
|
9,751 |
|
|
|
9,645 |
|
|
|
39,975 |
|
|
|
37,474 |
|
| Loss (gain) on extinguishment of debt |
|
857 |
|
|
|
4 |
|
|
|
534 |
|
|
|
(21,423 |
) |
| Income tax expense |
|
739 |
|
|
|
664 |
|
|
|
2,601 |
|
|
|
2,386 |
|
| Other expense |
|
329 |
|
|
|
424 |
|
|
|
1,211 |
|
|
|
897 |
|
| Interest income |
|
(670 |
) |
|
|
(639 |
) |
|
|
(2,768 |
) |
|
|
(2,667 |
) |
| Non-cash revenue and expenses |
|
(3,334 |
) |
|
|
(4,825 |
) |
|
|
(17,129 |
) |
|
|
(11,999 |
) |
| Gain on sale of real estate |
|
— |
|
|
|
(23,469 |
) |
|
|
(49,695 |
) |
|
|
(38,818 |
) |
| NOI |
|
72,570 |
|
|
|
70,376 |
|
|
|
289,637 |
|
|
|
273,268 |
|
| Adjustments: |
|
|
|
|
|
|
|
|
|
|
|
|
|
|
|
| Sunrise Mall net operating loss |
|
329 |
|
|
|
52 |
|
|
|
1,099 |
|
|
|
1,733 |
|
| Tenant bankruptcy settlement income and lease termination income |
|
(18 |
) |
|
|
(160 |
) |
|
|
(185 |
) |
|
|
(1,762 |
) |
| Non-same property NOI and other(1) |
|
(10,229 |
) |
|
|
(9,079 |
) |
|
|
(48,954 |
) |
|
|
(41,629 |
) |
| Same-property NOI |
$ |
62,652 |
|
|
$ |
61,189 |
|
|
$ |
241,597 |
|
|
$ |
231,610 |
|
| NOI related to properties being redeveloped |
|
6,155 |
|
|
|
5,681 |
|
|
|
25,472 |
|
|
|
22,668 |
|
| Same-property NOI including properties in redevelopment |
$ |
68,807 |
|
|
$ |
66,870 |
|
|
$ |
267,069 |
|
|
$ |
254,278 |
|
|
|
| (1) |
Non-same property NOI includes NOI related to properties being redeveloped and properties acquired, disposed, or that are in the foreclosure process during the periods being compared, and results of the Company's captive insurance program. |
Reconciliation of Net Income to EBITDAre and Adjusted EBITDAre
The following table reflects the reconciliation of net income to EBITDAre and Adjusted EBITDAre for the quarters and years ended December 31, 2025 and 2024. Net income is considered the most directly comparable GAAP measure. Refer to "Non-GAAP Financial Measures" on page 5 for a description of EBITDAre and Adjusted EBITDAre.
|
|
|
|
|
|
|
|
|
|
|
|
|
|
|
|
|
Quarter EndedDecember 31, |
|
|
|
|
|
|
|
Year EndedDecember 31, |
|
|
|
|
|
|
| (Amounts in thousands) |
|
2025 |
|
|
|
2024 |
|
|
|
2025 |
|
|
|
2024 |
|
| Net income |
$ |
12,794 |
|
|
$ |
31,506 |
|
|
$ |
97,510 |
|
|
$ |
75,442 |
|
| Depreciation and amortization |
|
32,538 |
|
|
|
37,483 |
|
|
|
139,166 |
|
|
|
150,389 |
|
| Interest and debt expense |
|
19,566 |
|
|
|
19,583 |
|
|
|
78,232 |
|
|
|
81,587 |
|
| Income tax expense |
|
739 |
|
|
|
664 |
|
|
|
2,601 |
|
|
|
2,386 |
|
| Gain on sale of real estate |
|
— |
|
|
|
(23,469 |
) |
|
|
(49,695 |
) |
|
|
(38,818 |
) |
| EBITDAre |
|
65,637 |
|
|
|
65,767 |
|
|
|
267,814 |
|
|
|
270,986 |
|
| Adjustments for Adjusted EBITDAre: |
|
|
|
|
|
|
|
|
|
|
|
|
|
|
|
| Transaction, severance, litigation expenses and other, net(1) |
|
459 |
|
|
|
248 |
|
|
|
4,997 |
|
|
|
1,402 |
|
| Loss (gain) on extinguishment of debt |
|
857 |
|
|
|
4 |
|
|
|
534 |
|
|
|
(21,423 |
) |
| Tenant bankruptcy settlement income |
|
(18 |
) |
|
|
— |
|
|
|
(29 |
) |
|
|
(115 |
) |
| Impact of property in foreclosure |
|
— |
|
|
|
— |
|
|
|
— |
|
|
|
(561 |
) |
| Non-cash adjustments(2) |
|
— |
|
|
|
(1,541 |
) |
|
|
(4,741 |
) |
|
|
1,295 |
|
| Adjusted EBITDAre |
$ |
66,935 |
|
|
$ |
64,478 |
|
|
$ |
268,575 |
|
|
$ |
251,584 |
|
|
|
| (1) |
Includes $0.3 million of transaction costs and $0.2 million of severance expense for the quarter ended December 31, 2025. Includes $3.2 million of severance expense, $2.4 million of transaction costs and $0.6 million of other income for the year ended December 31, 2025. |
| (2) |
Includes the acceleration and write-off of lease intangibles related to high-risk tenants, terminations and bankruptcies, net of reinstatements for tenants moved back to accrual basis accounting. The adjustment to EBITDAre in calculating Adjusted EBITDAre is inclusive of the portion attributable to the noncontrolling interest in Sunrise Mall. |
For additional information:
Mark Langer, EVP and
Chief Financial Officer
212-956-0082
Source: Urban Edge Properties
View All News

12 East 49th Street
New York NY 10017
General Inquiries: (212) 956-2556
Leasing: (844) 614-4114
Subscribe to Investor Email Alerts
To opt-in for investor email alerts, please enter your email address in the field below and select at least one alert option. After submitting your request, you will receive an activation email to the requested email address. You must click the activation link in order to complete your subscription. You can sign up for additional alert options at any time.
At COMPANY NAME, we promise to treat your data with respect and will not share your information with any third party. You can unsubscribe to any of the investor alerts you are subscribed to by visiting the ‘unsubscribe’ section below. If you experience any issues with this process, please contact us for further assistance.
By providing your email address below, you are providing consent to COMPANY NAME to send you the requested Investor Email Alert updates.
* Required
Email Address *
Investor Alert OptionsInvestor Alert Options *
|
| News |
| Quarterly Reports |
| Annual Reports |
| SEC Filings |
| End of Day Stock Quote |
| Events & Presentations |
Unsubscribe
Email Alert Sign Up Confirmation
Powered By Q4 Inc. 5.191.0.1 (opens in new window)
© 2024 Urban Edge Properties
Powered By Q4 Inc. 5.191.0.1 (opens in new window)