Letter from the CEO Key Financials Board of Directors Letter from the CEO Key Financials Board of Directors Letter from the CEO Letter from the CEOKey FinancialsBoard of Directors July 15, 2026 Dear Shareholders, Fiscal 2026 was another important…
- Letter from the CEO
- Key Financials
- Board of Directors
Letter from the CEO Key Financials Board of Directors Letter from the CEO
Letter from the CEOKey FinancialsBoard of Directors
July 15, 2026
Dear Shareholders,
Fiscal 2026 was another important step in rebuilding Under Armour.
When I returned as CEO, I did so with deep belief in this brand and a clear understanding that we had work to do. Under Armour has always been at its best when we're focused, disciplined, and relentlessly committed to making athletes better. Over time, complexity had slowed us down. We were trying to be too many things to too many people, which made it harder to operate with the speed, clarity, and conviction required to win.
Over the past two years, we’ve intentionally addressed that.
We've simplified the organization, improved accountability, reduced complexity, and become more deliberate about where we compete and how we invest. While there is still much work to be done, I believe the foundation we're building is taking hold and positioning Under Armour for a stronger future. We’re operating with great conviction in where we’re going.
Fiscal 2026 presented its share of challenges. A dynamic macroeconomic environment and higher U.S. tariffs created additional pressure across our business. Despite those headwinds, we continued to execute against our transformation plan and made meaningful progress in strengthening our company. Revenue declined 4% to approximately $5 billion, primarily reflecting continued softness in North America. Gross margin declined 240 basis points to 45.5%, with higher tariffs representing the largest driver of that pressure. Even so, adjusted operating income and adjusted earnings per share exceeded the outlook we provided midway through the year. While we've made progress, we're not satisfied. Simply put, we're not improving profitability fast enough. As someone who has spent most of his adult life building this company, accountability starts with leadership, and it starts with me.
The work we're doing today isn't about change for the sake of change. It's about rebuilding a stronger foundation underneath this brand. One that enables Under Armour to compete and win over the next decade and beyond, with the discipline and continuity needed to sustain durable growth.
What gives me confidence isn't that we've solved every problem. We haven't. It's that we're becoming more focused, more disciplined, and clearer about who we serve, what we stand for, and where we're going to win.

Share

Share
At the center of everything we do is product. Under Armour was built on the belief that one great product can change an athlete's life. Thirty years later, I still believe that. Great brands are built on great products and great storytelling. They always have been. They always will be.
This spring, Under Armour athlete Sharon Lokedi captured her second consecutive Boston Marathon title wearing the Velociti Elite 3. On one of the most demanding stages in sport, she delivered once again. Moments like these reinforce what Under Armour stands for: helping athletes perform at their best when it matters most.
Running remains the largest category opportunity in global sports. Sharon's performance proves we have the innovation, product capability, and athlete credibility to compete at the very highest level. Our opportunity now is to commercialize that authenticity, turning breakthrough performance into broader consumer demand and profitable growth.
Our responsibility is to take that performance credibility and put it into products athletes everywhere can experience for themselves. Across our business, we're embracing a simple philosophy: selling so much more of so much less at a higher retail price.

Share

Share
That mindset is increasingly visible across iconic franchises like HeatGear and ColdGear, premium apparel platforms like Meridian and Unstoppable, and our growing run business. Whether supporting elite competition or everyday training, our objective remains the same: deliver meaningful innovation that earns athletes' trust, strengthens our premium positioning, and fuels sustainable, profitable growth.
We're also leaning into our apparel strength while continuing to refine our footwear business for greater consistency and stronger returns. Our goal is not simply to sell more units. It is to create better products with intentional storytelling, strengthen margins, and increase the impact of the Under Armour brand.
Over the last two years, we've reduced SKUs by approximately 25%, and we expect to drive even greater clarity and focus in future seasons. Fewer products with more concentrated demand create healthier economics for both Under Armour and our partners while making it easier for consumers to understand what we stand for.
That same discipline is extending into our marketing approach. We’re rebalancing our marketing investments to ensure effectiveness and efficiency across all activations. This includes concentrating our investments behind the products, athletes, and stories that most clearly communicate our performance heritage and differentiate Under Armour in the marketplace.
In fiscal 2027, we are working to stabilize the business while recognizing that the broader consumer environment remains uncertain. We are making deliberate choices that may pressure revenue in the short term because we believe they will create a healthier, more profitable, and more durable business over the long term.
Around the world, our regions are at different stages of evolution. In North America, we're restoring marketplace discipline and rebuilding momentum. In EMEA, we're protecting a position of strength while expanding thoughtfully. And in APAC, we're sharpening our focus and improving execution.

Share

Share

Share
What is taking shape at Under Armour is a company with clearer priorities, stronger accountability, and a renewed commitment to making athletes better. In that context, we’re moving from a period defined by correction toward one increasingly defined by execution, with the benefit of the wisdom and experience we’ve gained over the years.
Great companies aren't built during easy periods. They're built during difficult times. They're built by teams willing to confront reality, make hard decisions, and continue moving forward even when the outcome isn't obvious. That's exactly what I see across Under Armour today.
As we celebrate our 30th anniversary this year, I'm reflective on the market wisdom we’ve gained and reminded of just how far we've come since founding Under Armour in 1996 with a simple idea: make athletes better through innovation.
What started with one product has grown into a brand serving athletes worldwide. Along the way, we've experienced tremendous success, faced meaningful challenges, and learned valuable lessons. Because of that journey, our purpose has remained unchanged.
Thirty years later, I remain grateful for the teammates, athletes, partners, and shareholders who have helped build this company and continue to believe in where we're headed. Even with work still ahead, I believe we're building a stronger Under Armour with a clearer sense of who we are and what we stand for.
Thank you for your continued support and your belief in Under Armour.
Humble & Hungry,
KEVIN PLANK
President & CEO
Under Armour, Inc.
Year2026
2020202120222023202420252026
Net Revenue By Product¹
(PERCENT OF FY26 TOTAL)
Net Revenue By Region¹
(PERCENT OF FY26 TOTAL)
Net Revenue By Channel¹
(PERCENT OF FY26 TOTAL)
- Corporate Other revenue, which primarily relates to foreign currency hedge gains and losses managed through our central foreign exchange risk management program, is not presented as it is not material
Year2026
2020202120222023202420252026
Net Revenue
($ in Billions)
Gross Margin1
(Percent of Revenue)
Income from Operations2
($ in Millions and Percent of Revenue)
- Adjusted basis for FY26: Excludes 0.2% of restructuring impacts in FY26. GAAP Basis: 45.5%, 47.9%, and 46.1% for FY26, FY25, and FY24, respectively
- Adjusted basis: Excludes $99M in litigation reserve expense, $141M in restructuring charges, and $31M in restructuring-related transformation expenses in FY26. Excludes $266M in litigation reserve expense, $58M in restructuring charges, $31M in restructuring-related transformation expenses, and $28M of other impairment charges in FY25. Excludes $80M in litigation reserve expense in FY24. GAAP Basis: ($163M), $(185M), and $230M for FY26, FY25, and FY24, respectively.
Board of Directors
View All Human Capital and Compensation Committee Board of Directors Audit Committee UA Executive Corporate Governance and Sustainability Committee CEO Founder Chairman of the board Finance and Capital Planning Committee Management View All
View AllHuman Capital and Compensation CommitteeBoard of DirectorsAudit CommitteeUA ExecutiveCorporate Governance and Sustainability CommitteeCEOFounderChairman of the boardFinance and Capital Planning CommitteeManagement
Mohamed A. El-Erian
Chair of the Board of Directors;
Former CEO Co-Chief Investment Officer of PIMCO
Biography
Dr. El-Erian served as CEO and Co-Chief Investment Officer of PIMCO, one of the world’s premier global investment management firms, from December 2007 to March 2014. He currently serves as Chief Economic Advisor of Allianz, the corporate parent of PIMCO, a role he has held since March 2014. Dr. El-Erian joined PIMCO in 1999 as a senior member of the portfolio management and investment strategy group. In February 2006, he became president and CEO of Harvard Management Company, the entity responsible for managing the university’s endowment, before returning to PIMCO in December 2007 to serve as co-CEO and co-CIO. From December 2012 to January 2017, he was chair of the U.S. President’s Global Development Council. Previously, he was a managing director at Salomon Smith Barney/Citigroup in London and worked at the International Monetary Fund for 15 years, rising to the position of Deputy Director. Dr. El-Erian served as non-executive director of Barclays plc and as a member of its Board Risk and Board Nomination Committees from January 2020 to September 2024. He served as the President of Queens’ College, Cambridge from October 2020 through September 2025. He is a trustee of the National Bureau of Economic Research and a contributing editor at the Financial Times. Dr. El-Erian serves as Chair of the Board of Directors of the Center for Global Development. Dr. El-Erian is also a Senior Global Fellow at the Joseph H. Lauder Institute of Management and International Studies and the Rene M. Kern Practice Professor at the Wharton School of the University of Pennsylvania.

Kevin A. Plank
President and Chief Executive Officer
Biography
Mr. Plank became Under Armour’s President and Chief Executive Officer in April 2024, after serving as Executive Chair and Brand Chief from January 2020 to March 2024. Prior to that, he served as Chief Executive Officer and Chair of the Board of Directors from 1996 to 2019, and President from 1996 to July 2008 and August 2010 to July 2017. Founded in 1996 out of frustration that cotton T-shirts were unable to keep him dry and comfortable while playing football at the University of Maryland, Mr. Plank designed and created a new apparel innovation that efficiently wicked sweat to optimize athletic performance. Over a quarter of a century later and Under Armour has grown into one of the world’s leading developer, marketer, and distributor of branded performance apparel, footwear and accessories. Mr. Plank also serves on the Board of Directors of the National Football Foundation and College Hall of Fame, Inc., and is a member of the Board of Trustees of the University of Maryland College Park Foundation.

Douglas E. Coltharp
Executive Vice President and Chief Financial Officer, Encompass Health Corporation
Biography
Since May 2010, Mr. Coltharp has served as Executive Vice President and Chief Financial Officer of Encompass Health Corporation (formerly HealthSouth Corporation). Before that, Mr. Coltharp served as a partner at Arlington Capital Advisors and Arlington Investment Partners, a Birmingham, Alabama based financial advisory and private equity business from May 2007 to April 2010 and as Executive Vice President and Chief Financial Officer of Saks Incorporated and its predecessor organization from 1996 to May 2007.

Jerri L. DeVard
Former Executive Vice President, Chief Customer Officer of Office Depot, Inc.
Biography
Ms. DeVard served as Executive Vice President, Chief Customer Officer of Office Depot, Inc. from January 2018 to March 2020, leading their eCommerce and Customer Service functions and Marketing and Communications and as Executive Vice President and Chief Marketing Officer from September 2017 to December 2017. Before that, Ms. DeVard served as Senior Vice President and Chief Marketing Officer of The ADT Corporation, a leading provider of home and business security services, from March 2014 through May 2016. From July 2012 to March 2014, she was Principal of DeVard Marketing Group, a firm specializing in advertising, branding, communications and marketing strategies. Before that, she served as Executive Vice President of Marketing for Nokia. Ms. DeVard served in a number of senior marketing roles throughout her career, including as Senior Vice President of Marketing and Senior Vice President, Marketing Communications and Brand Management of Verizon Communications, Inc., Chief Marketing Officer of the e-Consumer business at Citibank N.A. and other senior marketing positions at Revlon Inc., Harrah’s Entertainment, the NFL’s Minnesota Vikings and the Pillsbury Company. In 2021, Ms. DeVard founded the Black Executive CMO Alliance (BECA), an alliance designed to champion corporate diversity and help build the next generation of C-suite marketing executives. Ms. DeVard currently serves on the Board of Directors of Root, Inc. and is Chair of its Nominating and Corporate Governance Committee and on the Board of Directors of Dow Inc. and is a member of its Audit and Environment, Health, Safety and Technology Committees. Ms. DeVard previously served on the Board of Directors of Cars.com from May 2017 to June 2026 and on the Board of Directors of Focus Impact Acquisition Corp. from October 2021 to January 2022.

Carolyn N. Everson
Senior Advisor for Permira;
Former Vice President Global Business Group of Meta
Biography
Ms. Everson has served since January 2023 as a Senior Advisor for Permira, a private equity firm focused on technology and consumer brands. She has also served since September 2023 as a Senior Advisor for Boston Consulting Group (BCG) in the Technology, Media & Telecom and Marketing, Sales & Pricing practice areas. Before joining Permira and BCG, she served as President of Instacart from September to December 2021; before that, she was Vice President of the Global Business Group at Meta Platforms, Inc. from March 2011 to June 2021. Before joining Meta, Ms. Everson held leadership positions in advertising at Microsoft Corporate and MTV Networks Company. Ms. Everson serves on the Board of Directors of The Walt Disney Company and is a member of its Compensation Committee and on the Board of Directors of The Coca-Cola Company and is a member of its Finance and Talent and Compensation Committees. She also serves on the International Advisory Board for Banco Santander, the Americas Advisory Board for Temasek and as an Advisor for Visible Ventures. In addition, she is a member of the Council of Foreign Relations. Ms. Everson earned a bachelor’s degree in liberal arts and communications from Villanova University and a master’s degree in business administration from Harvard Business School.

Dawn N. Fitzpatrick
Chief Executive Officer & Chief Investment Officer, Soros Fund Management, LLC
Biography
Since 2017, Ms. Fitzpatrick has been the Chief Executive Officer and Chief Investment Officer of Soros Fund Management, LLC, a privately held investment management firm. Before joining Soros in 2017, she spent 25 years at UBS and its predecessor organizations, where she most recently served as Head of Investments for UBS Asset Management and was a member of the UBS Asset Management Executive Committee. Earlier, she held several positions at the UBS O’Connor hedge fund business, including Chief Executive Officer and Chief Investment Officer. Ms. Fitzpatrick serves as a non-executive director of Barclays plc and serves on its Remuneration, Risk, and Sustainability Committees. Additionally, she serves on the Federal Reserve Bank of Dallas Financial Sector Advisory Council, where she is Chair, the Advisory Council of The Bretton Woods Committee, and the Bloomberg New Economy Advisory Board. She previously completed a six-year term on the Investor Advisory Committee on Financial Markets at the Federal Reserve Bank of New York. Ms. Fitzpatrick earned her bachelor’s degree from the Wharton School of Business at the University of Pennsylvania, where she ran track and cross country.

David W. Gibbs
Former Chief Executive Officer of Yum! Brands, Inc.
Biography
Mr. Gibbs served as Chief Executive Officer of Yum! Brands, Inc. (“YUM”), from January 2020 to September 2025 and as a member of YUM’s Board of Directors from November 2019 to September 2025. Since October 2025, he has held an advisory role at YUM. Prior to serving as Chief Executive Officer, he served as President and Chief Operating Officer from August 2019 to December 2019, as President, Chief Financial Officer and Chief Operating Officer from January 2019 to August 2019 and as President and Chief Financial Officer from May 2016 to December 2018. Before these positions, he served as Chief Executive Officer of Pizza Hut Division from January 2015 to April 2016. From January 2014 to December 2014, Mr. Gibbs served as President of Pizza Hut U.S. Before these positions, Mr. Gibbs served as President and Chief Financial Officer of Yum! Restaurants International, Inc. (“YRI”) from May 2012 through December 2013. Mr. Gibbs served as Chief Financial Officer of YRI from January 2011 to April 2012. He served as Chief Financial Officer of Pizza Hut U.S. from September 2005 to December 2010. Mr. Gibbs serves on the Board of Directors for PepsiCo, Inc. and is a member of its Audit Committee.

Eric T. Olson
Admiral U.S. Navy (Retired) and former Commander, U.S. Special Operations Command
Biography
Admiral Olson retired from the United States Navy in 2011 as an Admiral after 38 years of military service. He served in special operations units throughout his career, during which he earned a Master’s Degree in National Security Affairs and was awarded several decorations for leadership and valor including the Defense Distinguished Service Medal and the Silver Star. Admiral Olson’s career culminated as the head of the United States Special Operations Command from July 2007 to August 2011, where he was responsible for the mission readiness of all Army, Navy, Air Force, and Marine Corps special operations forces. In this capacity, he led over 60,000 people and managed an annual budget in excess of ten billion dollars. Admiral Olson served as Chief Executive Officer of HANS Premium Water, a clean water solution for homes, from June 2019 to May 2020. He has served as President and Managing Member of ETO Group, LLC since September 2011, supporting a wide range of private and public sector organizations. Admiral Olson serves on the Board of Directors of Iridium Communications, Inc. and is Chair of its Compensation Committee and on the Board of Directors of Palladyne AI (previously Sarcos Technology & Robotics Corp) and is a member of its Nominating and Corporate Governance Committee and Chair of its Compensation Committee. Admiral Olson also serves as Chairman Emeritus of the non-profit Special Operations Warrior Foundation.

Eugene D. Smith
Former SVP, Athletic Director, Ohio State University
Biography
Mr. Smith served as Senior Vice President and Athletic Director at Ohio State University from 2005 to 2024. Throughout his tenure, he co-chaired the NCAA’s Federal-State Legislative Working Group, which advised the NCAA on name, image, and likeness issues, chaired the 2011 NCAA Men’s Basketball Committee and was a member of the College Football Playoff Selection Committee. Additionally, he participated in the NCAA’s Management Council, the Committee on Infractions, the Executive Committee, the Football Rules Committee, and the President’s Commission Liaison Committee. As the first Black president of the National Association of Collegiate Directors of Athletics (NACDA) and a former president of the Division I-A Athletics Directors Association, Smith was the Director of Athletics at Arizona State from 2000 to 2005, at Iowa State from 1993 to 2000 and at Eastern Michigan from 1986 to 1993. He played football as an undergraduate at Notre Dame, where he was a defensive end on the 1973 national championship team and earned a bachelor’s degree in business administration. After graduation, he joined the coaching staff at Notre Dame and contributed to the Irish victory in the 1977 national championship. Since 2024, Mr. Smith has served as President of Gene Smith Consulting, LLC, providing leadership training services with a particular focus on assisting athletic conference commissioners, athletic directors and coaches in the collegiate environment. Mr. Smith serves on the Board of Directors for M/I Homes, Inc. and is a member of its Compensation Committee.

Robert J. Sweeney
Former President, Sycamore Partners
Biography
Robert J. Sweeney has been a director of Under Armour since April 2025. Mr. Sweeney served as the President of Sycamore Partners, a private equity firm focused on consumer, distribution, and retail-related investments from September 2019 to August 2025. Since August 2025, he has held a Senior Advisor role at Sycamore Partners. Before joining Sycamore Partners, he spent 22 years at Goldman Sachs, most recently as a partner and Global Head of the Consumer/Retail Investment Banking Group. During his tenure at Goldman Sachs, he provided advisory support to Under Armour on various matters, including the company’s initial public offering in 2005. Mr. Sweeney served as an officer in the U.S. Navy’s Submarine Force from 1989 to 1995, holding various roles aboard the USS Annapolis and at the Submarine Officer Advanced Course training command. He graduated from the Wharton School of the University of Pennsylvania with a bachelor’s degree and MBA, and he was recognized as a Palmer Scholar.

Patrick W. Whitesell
CEO & Founder, WIN Sports Group & WTSL
Biography
In May 2025, Mr. Whitesell launched WIN Sports Group, a football representation firm, and WTSL, an investment firm supporting entrepreneurs and companies in media, entertainment and sports. He currently serves as the Founder and CEO of both firms. From October 2017 through March 2025, Mr. Whitesell served as Executive Chairman of Endeavor Group Holdings, a global sports and entertainment company composed of industry-leading entities including entertainment agency WME; sports, fashion, events and media company IMG; and premier mixed martial arts organization UFC. Previously, Mr. Whitesell served as Endeavor’s Co-Chief Executive Officer, following his role as Co-Chief Executive Officer of WME. He served as a member of Endeavor’s Board of Directors from 2001 to March 2025. Mr. Whitesell serves on the Board of Directors of Omaha Productions and Diamond Baseball Holdings, is a member of the Academy of Motion Picture Arts and Sciences and is a graduate of Luther College.

Download Report Now
View More Financials
More From UA News
[
\
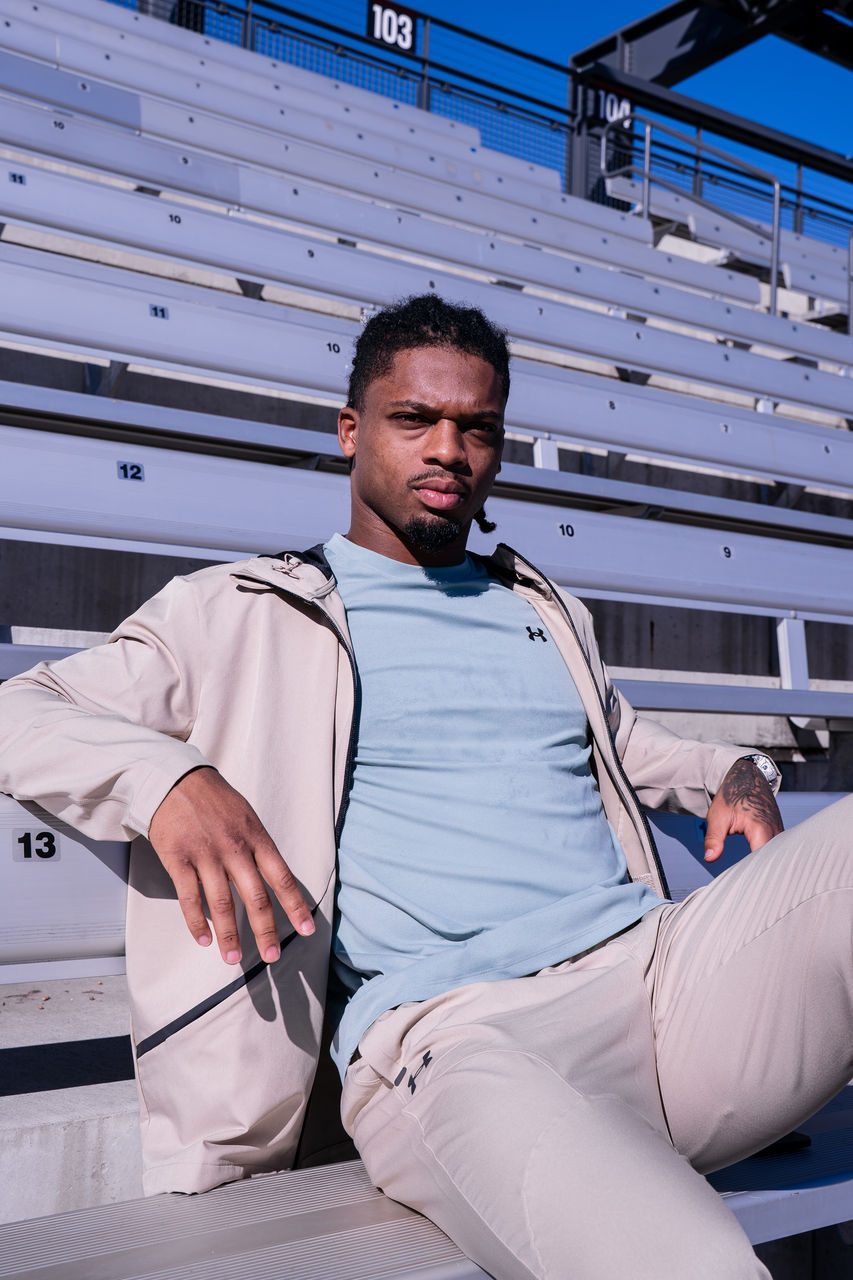
Damar Hamlin Joins Under Armour as Brand Ambassador, Championing Mental Wellness for the Next Generation\
Damar Hamlin is joining Under Armour as a brand ambassador, bringing his passion for co...](https://about.underarmour.com/en/stories/2026/11/damar-hamlin-joins-under-armour-as-brand-ambassador--championing.html)
[
\
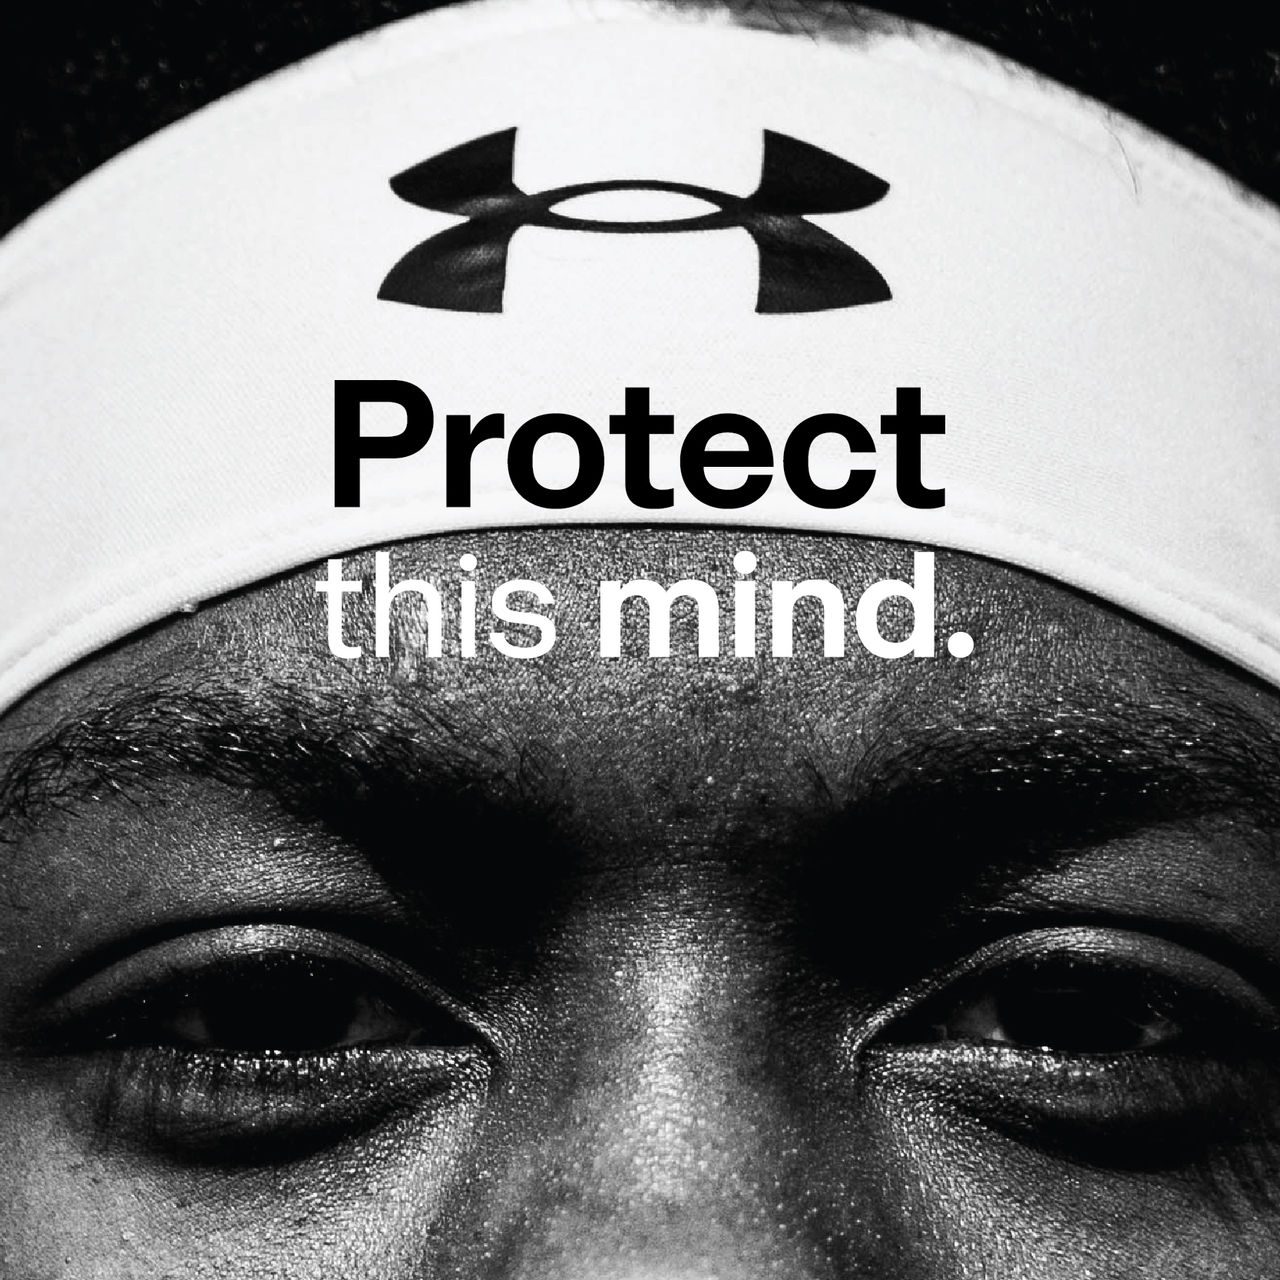
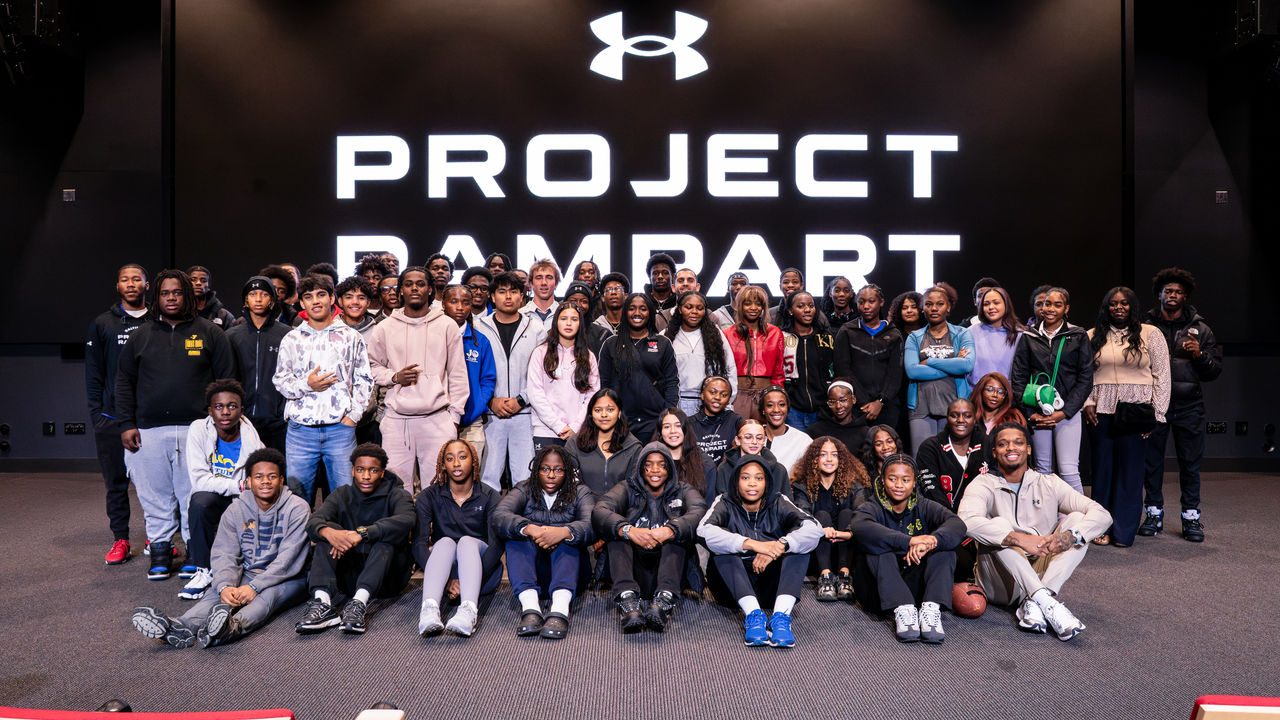
Under Armour Launches "Protect This Mind," A New Mental Wellness Initiative for Student Athletes, Alongside Athlete Ambassador Damar Hamlin\
Under Armour today announced Protect This Mind, a mental wellness initiative building o...](https://about.underarmour.com/en/stories/2026/11/under-armour-launches--protect-this-mind---a-new-mental-wellness.html)
[
\
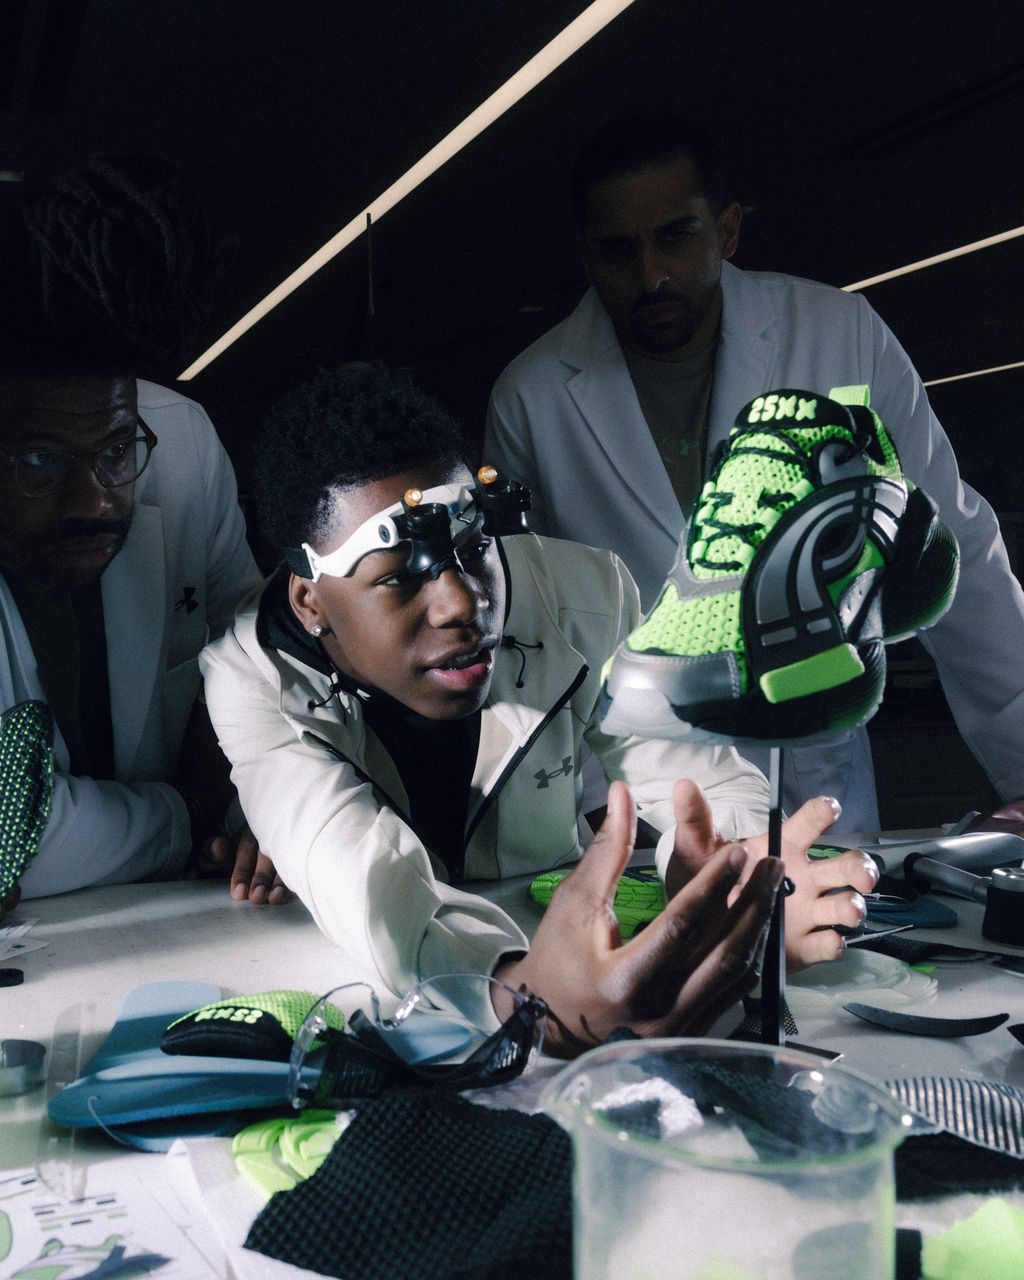
RaKai and Under Armour Take Their Partnership to the Next Level With the Launch of the UA Arc 96 “25XX”\
Launching RaKai’s first-ever footwear collaboration with UA, called the 25XX — RaKai’s ...](https://about.underarmour.com/en/stories/2026/10/rakai-and-under-armour-take-their-partnership-to-the-next-level-.html)
[
\
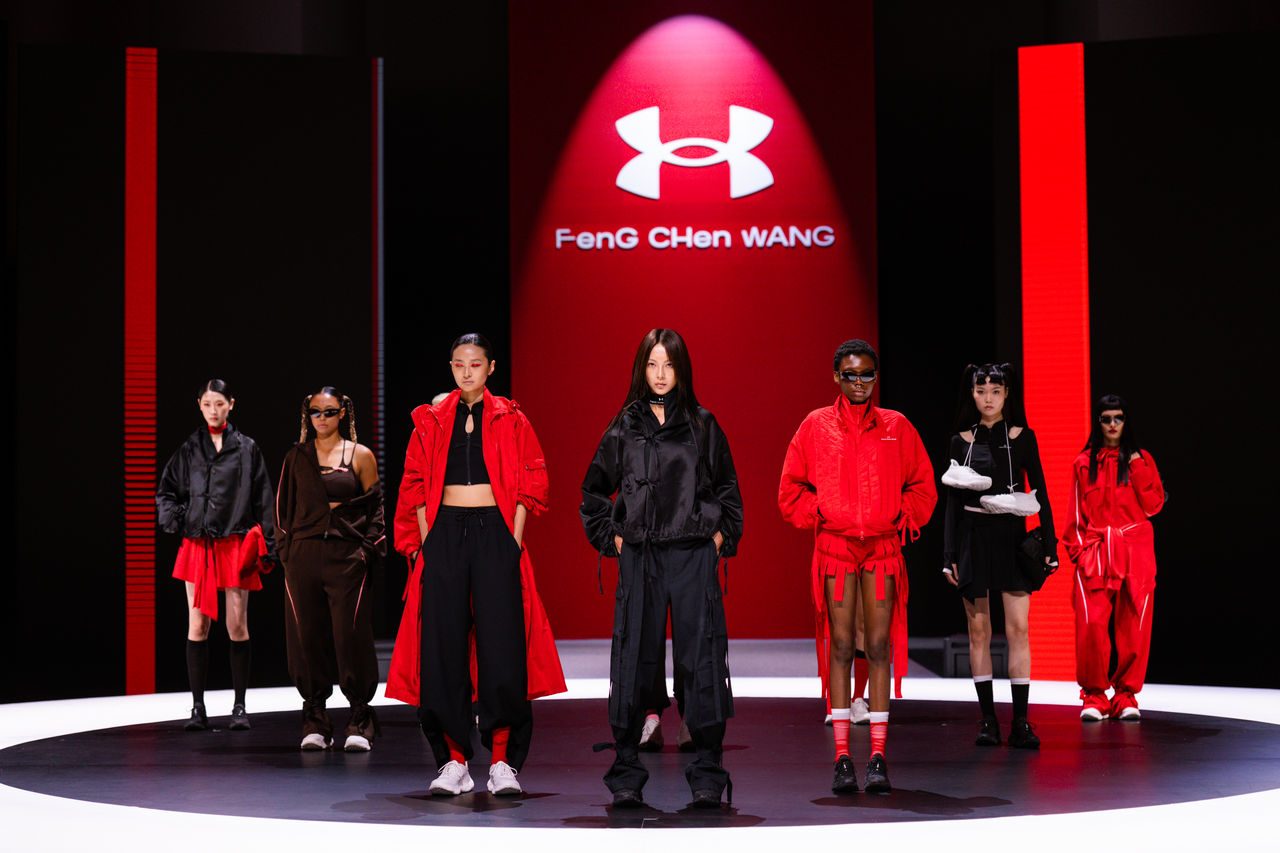
Under Armour and Feng Chen Wang Bring Rebel Daughter to China, Celebrating the Power of Modern Women\
Rebel Daughter reflects Under Armour and Feng Chen Wang's shared understanding of cont...](https://about.underarmour.com/en/stories/2026/10/under-armour-and-feng-chen-wang-bring-rebel-daughter-to-china---.html)
[
\
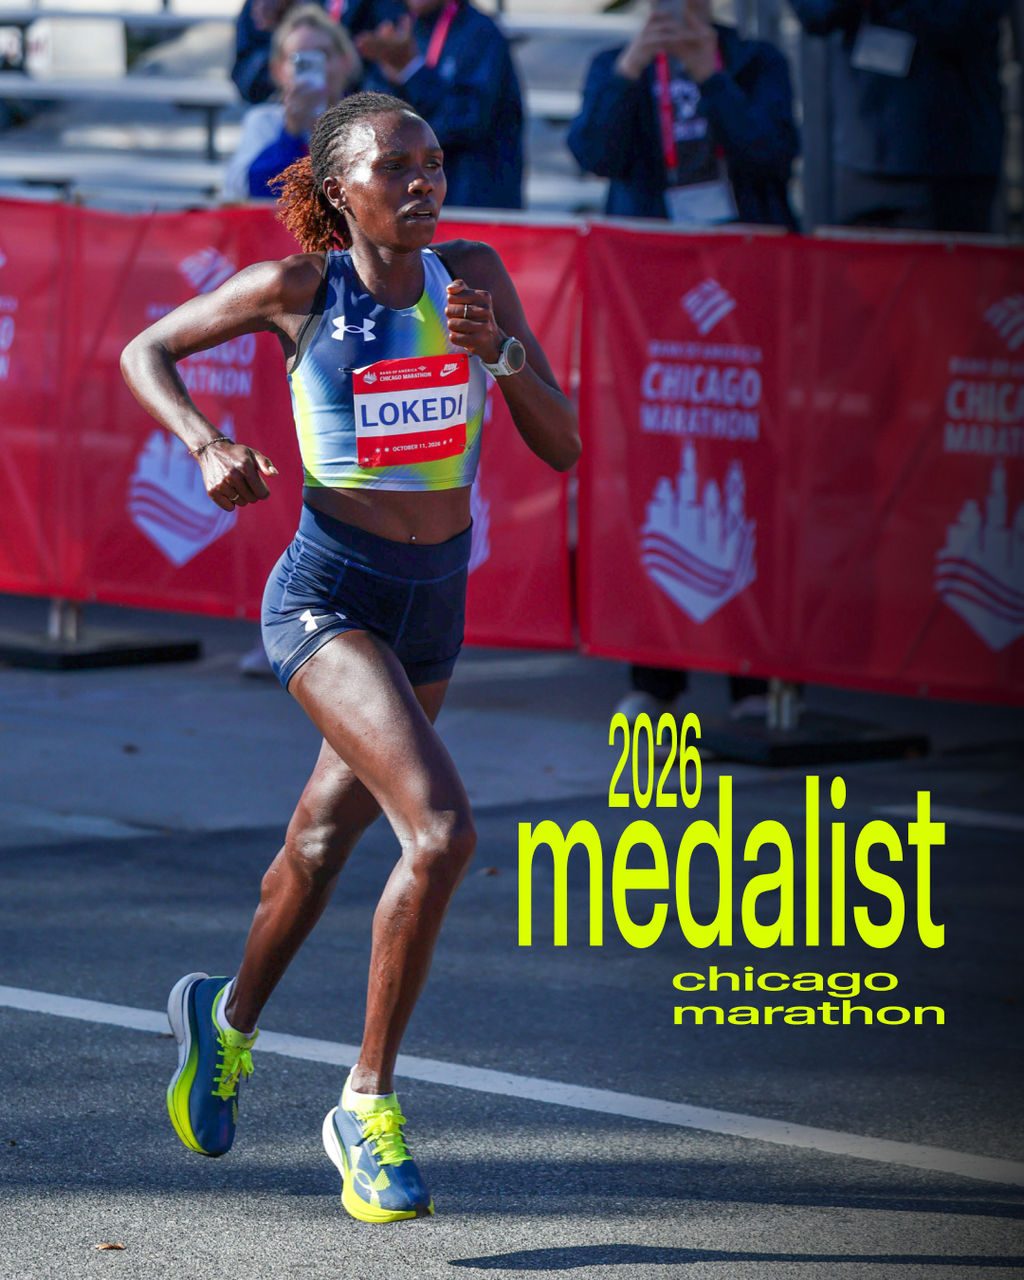
Sharon Lokedi Captures Seventh Abbott World Marathon Major Podium in Chicago\
With a second-place finish at the 2026 Chicago Marathon, Lokedi secured the seventh Abb...](https://about.underarmour.com/en/stories/2026/10/sharon-lokedi-chicago-marathon-2026.html)
[
\
Massachusetts Athletics and Under Armour Announce Long-term Apparel Partnership\
AMHERST, Mass. – Massachusetts Athletics and Under Armour are excited to announce an ei...](https://about.underarmour.com/en/stories/2026/10/massachusetts-athletics-and-under-armour-announce-long-term-appa.html)
[
\
Northwestern Athletics and Under Armour Announce Landmark 10-Year Partnership Extension Through 2037\
Northwestern University Athletics and Under Armour (NYSE: UA) today announced a landmar...](https://about.underarmour.com/en/stories/2026/10/northwestern-athletics-and-under-armour-announce-landmark-10-yea.html)
[
\
Under Armour Debuts We Love Football Campaign\
Under Armour is celebrating the sport where the brand began with, We Love Football, a s...](https://about.underarmour.com/en/stories/2026/10/under-armour-debuts-we-love-football-campaign.html)
[
\
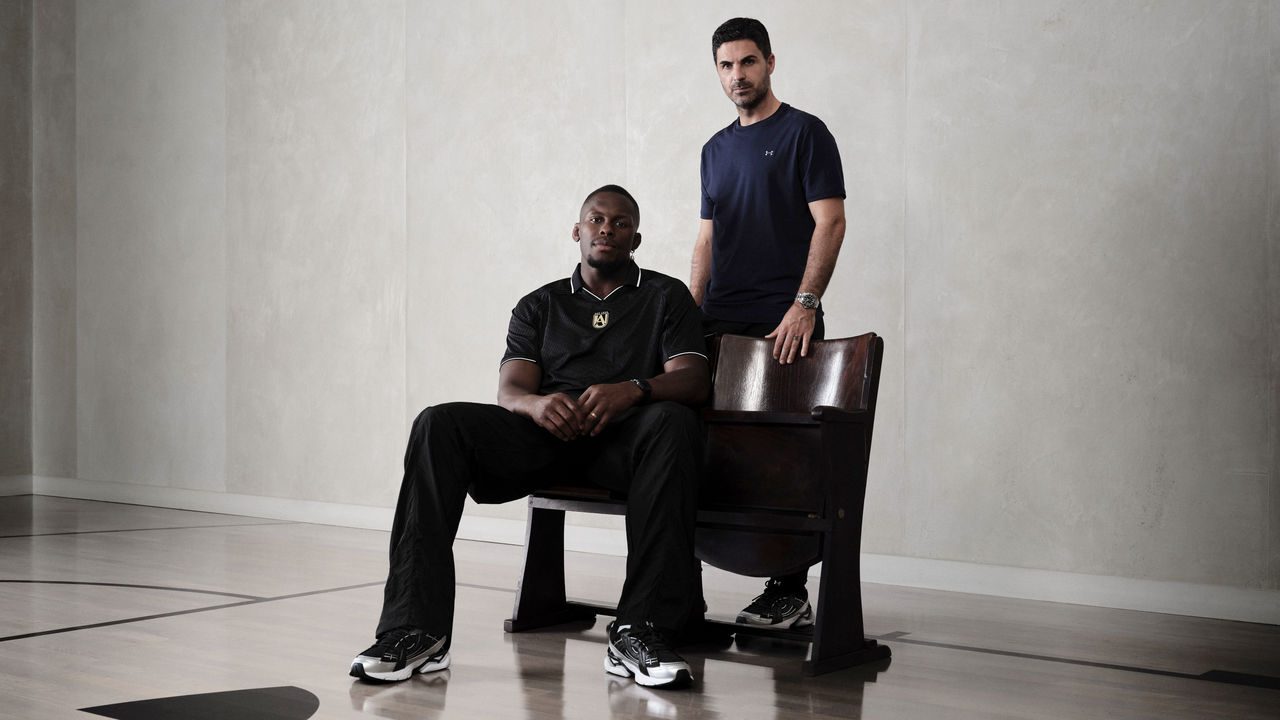
Maro Itoje Meets Mikel Arteta: Two Leaders, Two Mindsets, Two Champions\
Under Armour brought together England and Saracens rugby captain Maro Itoje and Arsenal...](https://about.underarmour.com/en/stories/2026/10/maro-itoje-meets-mikel-arteta--two-leaders--two-mindsets--two-ch.html)
[
\
UNLESS Collective Moves to UA.com\
The full UNLESS brand is moving to UA.com, bringing its products and approach to materi...](https://about.underarmour.com/en/stories/2026/09/unless-collective-moves-to-ua-com.html)
[
\
Under Armour and Syzmik Sports Announce Global Partnership to Advance the Future of Flag Football & 7v7\
Under Armour and SYZMIK Sports today announced a strategic licensing partnership that w...](https://about.underarmour.com/en/stories/2026/09/under-armour-and-syzmik-sports-announce-global-partnership-to-ad.html)
[
\
Under Armour Opens First Montana Store\
Under Armour officially opened the doors to its first Montana retail location on Septem...](https://about.underarmour.com/en/stories/2026/09/under-armour-opens-first-montana-store--introduces-new-retail-co.html)
[
\
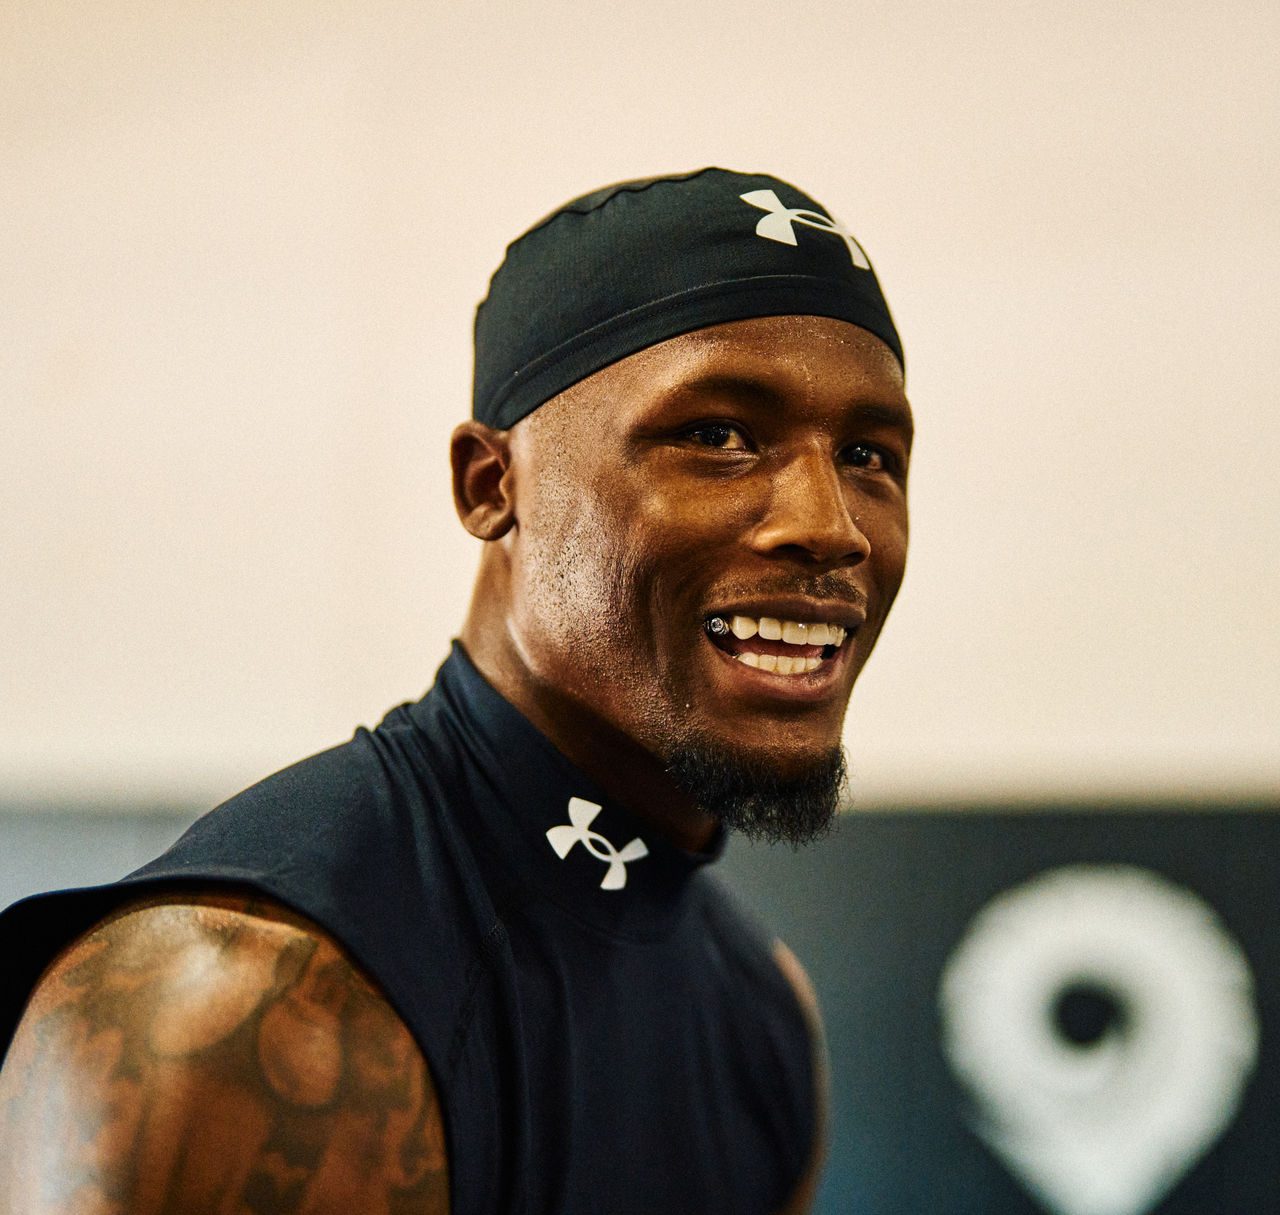
Under Armour Welcomes NFL Star Tee Higgins to its Football Roster\
Under Armour welcomes Cincinnati Bengals wide receiver Tee Higgins as the newest additi...](https://about.underarmour.com/en/stories/2026/09/under-armour-welcomes-nfl-star-tee-higgins-to-its-football-roste.html)
[
\
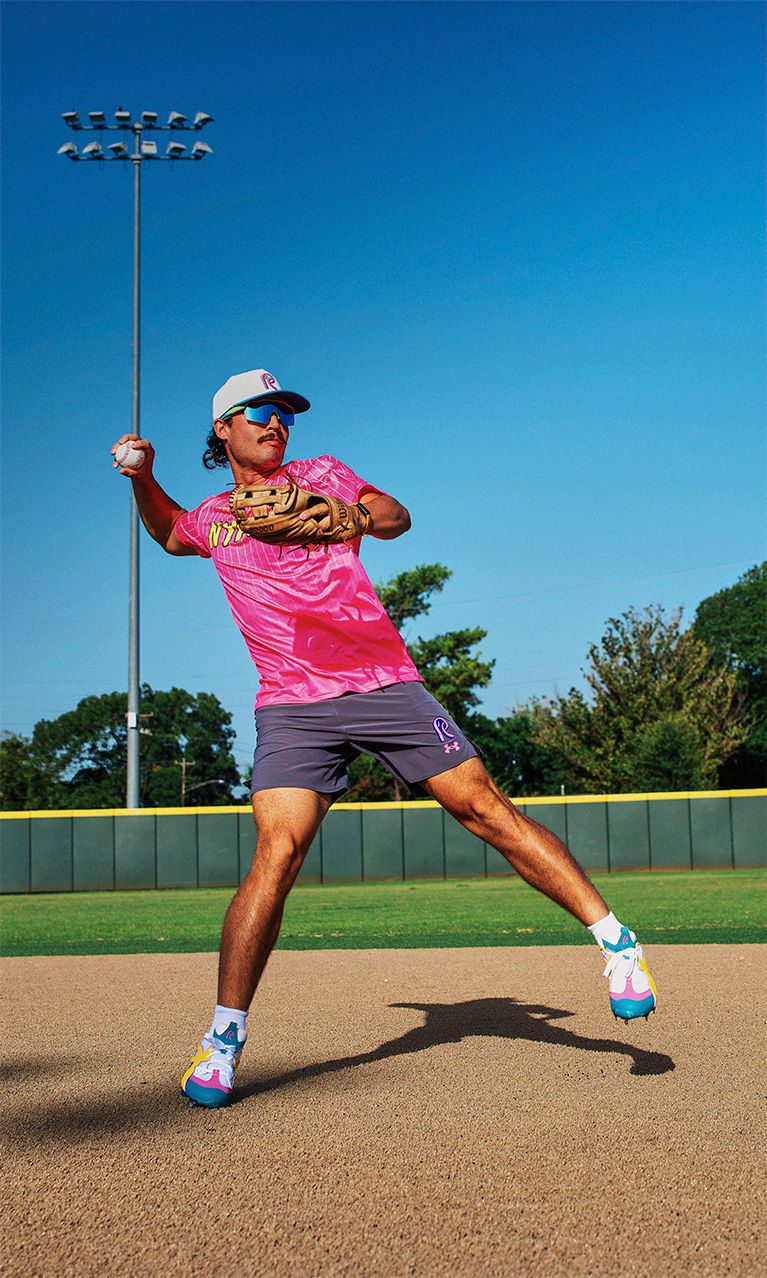
Under Armour and Coach RAC Launch New Capsule\
Coach RAC and Under Armour are expanding their brand partnership with the launch of the...](https://about.underarmour.com/en/stories/2026/08/under-armour-and-coach-rac-launch-new-capsule.html)
[
\
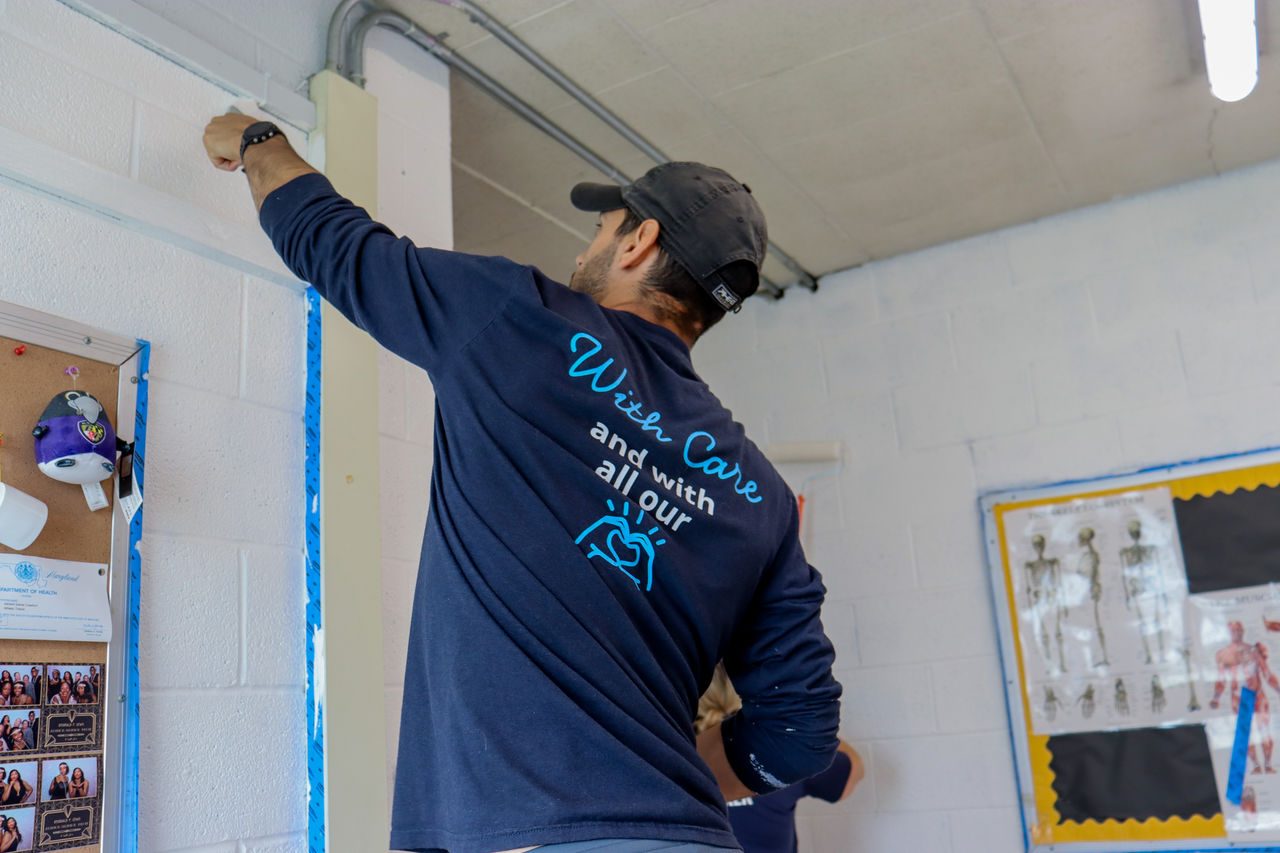
CareFirst and Under Armour Partner to Advance Youth Health and Well-Being Across Baltimore and Washington, DC\
— CareFirst BlueCross BlueShield (CareFirst), one of the region's largest not-for-profi...](https://about.underarmour.com/en/stories/2026/09/carefirst-and-under-armour-partner-to-advance-youth-health-and--.html)
[
\
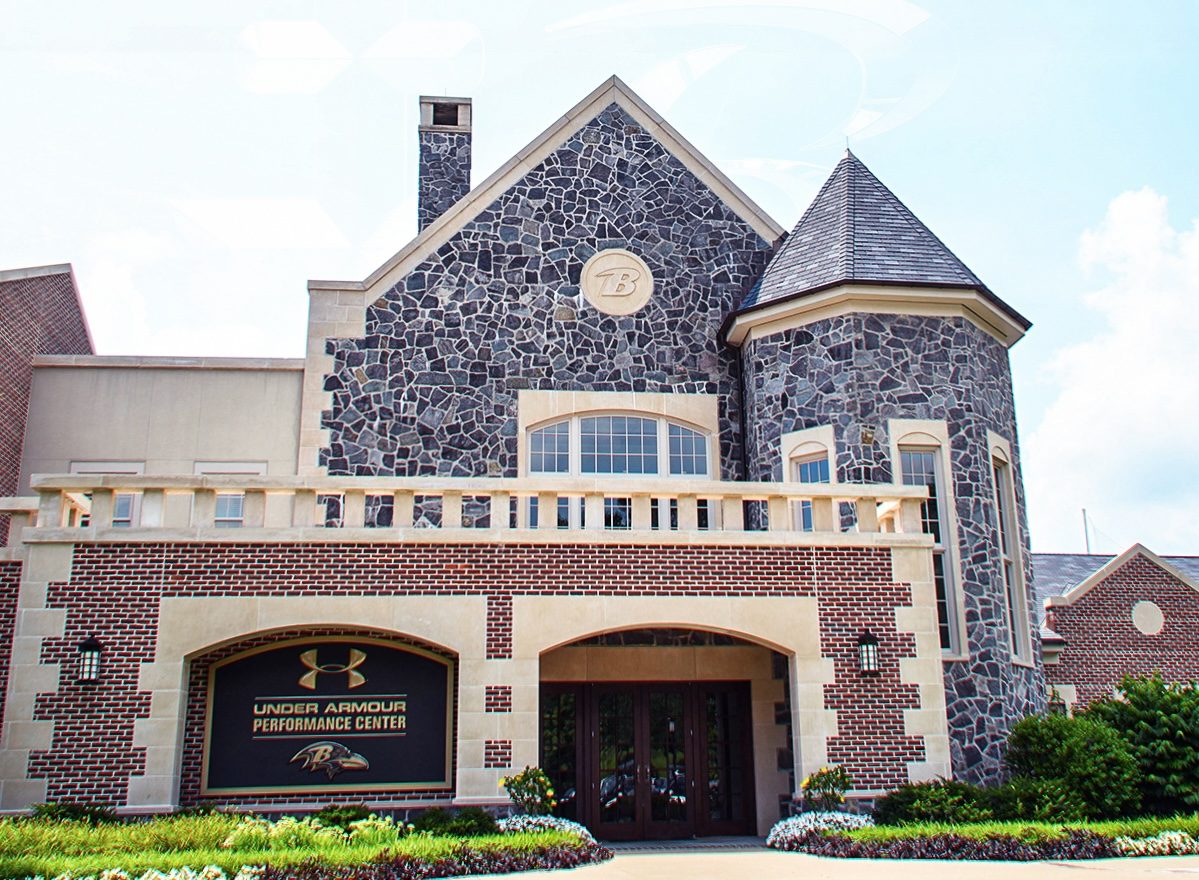
Under Armour and Baltimore Ravens Announce 10-year Partnership Extension\
The Baltimore Ravens and Under Armour announced Tuesday a 10-year extension of their lo...](https://about.underarmour.com/en/stories/2026/08/under-armour-and-baltimore-ravens-announce-10-year-partnership-e.html)
[
\
Under Armour Names Gunna Global Brand Ambassador and Creative Director of P-Star\
Under Armour announces the appointment of multi-platinum, Grammy-nominated artist Gunna...](https://about.underarmour.com/en/stories/2026/08/under-armour-names-gunna-global-brand-ambassador-and-creative-di.html)
[
\
Under Armour Launches New Brand Platform Centered on Commit, Spotlighting the Growth and Rewards Found in Sport\
Under Armour has introduced a new brand platform that brings to life the commitment sto...](https://about.underarmour.com/en/stories/2026/08/under-armour-launches-new-brand-platform-centered-on-commit--spo.html)
[
\
Under Armour Launches its Latest Football Boot Innovation: The Magnetico Elite 6\
Building on the legacy of its control-focused boot range, Under Armour has unveiled the...](https://about.underarmour.com/en/stories/2026/08/under-armour-launches-its-latest-football-boot-innovation--the-m.html)
[
\
How Rachael Kirkconnell Is Styling the UA Bouncy Tee This Fall\
The new UA Bouncy Tee for women combines a clean, flattering fit with the performance t...](https://about.underarmour.com/en/stories/2026/08/how-rachael-kirkconnell-is-styling-the-bouncy-tee-this-fall.html)
[
\
Under Armour Signs Rising Canadian Hockey Star Jade Iginla\
Under Armour today announced the signing of Jade Iginla, a rising force in women's hock...](https://about.underarmour.com/en/stories/2026/08/under-armour-signs-rising-canadian-hockey-star-jade-iginla.html)
[
\
Under Armour Basketball Introduces the Fox 3\
The Under Armour Fox 3 was built to meet the lightning-quick first step, elite end-to-e...](https://about.underarmour.com/en/stories/2026/08/under-armour-basketball-introduces-the-fox-3.html)
[
\
UA Next All-America Game Returns to Camden Yards for Second Straight Year\
Under Armour and Baseball Factory will host the UA Next All-America Game at Oriole Park...](https://about.underarmour.com/en/stories/2026/08/ua-next-all-america-game-returns-to-camden-yards-for-second-stra.html)
[
\
Your Softest Legging Just Got Better: UA Meridian\
Meridian Legging is back with its most refined update yet. An upgraded fabric delivers ...](https://about.underarmour.com/en/stories/2026/08/your-softest-legging-just-got-better--ua-meridian.html)
[
\
Under Armour Names BOYNEXTDOOR as Global Brand Ambassadors\
Under Armour has named K-pop’s authentic new wave BOYNEXTDOOR as its newest global bran...](https://about.underarmour.com/en/stories/2026/07/under-armour-names-boynextdoor--as-global-brand-ambassadors.html)
[
\
Under Armour Welcomes Li Yueru\
Under Armour today announces the signing of WNBA player Li Yueru, one of the most accom...](https://about.underarmour.com/en/stories/2026/07/under-armour-welcomes-li-yueru.html)
[
\
Under Armour to Host UA Next: City Classic Baltimore\
This year, UA is bringing 20 of the best boys and girls high school basketball players ...](https://about.underarmour.com/en/stories/2026/07/under-armour-to-host-ua-next--city-classic-baltimore.html)
[
\
Under Armour Names François Arnaud as Global Brand Ambassador\
Under Armour announces actor François Arnaud as a global brand ambassador adding a powe...](https://about.underarmour.com/en/stories/2026/07/under-armour-names-francois-arnaud-as-global-brand-ambassador.html)
[
\
Under Armour Celebrates the Off-Season in New "Rest Less" Sportswear Campaign\
The campaign spotlights the moment pressure lifts, the curtain drops, and summer begins...](https://about.underarmour.com/en/stories/2026/07/under-armour-celebrates-the-off-season-in-new--rest-less--sports.html)
[
\
Ferran Torres Delivers on Soccer's Biggest Stage Wearing Under Armour\
Under Armour athlete Ferran Torres etched his name into soccer history in the UA Shadow...](https://about.underarmour.com/en/stories/2026/07/ferran-torres-delivers-on-soccer-s-biggest-stage-wearing-under-a.html)
[
\
Sharpie and Under Armour Launch Limited-Edition D. Fox x Sharpie Capsule Collection\
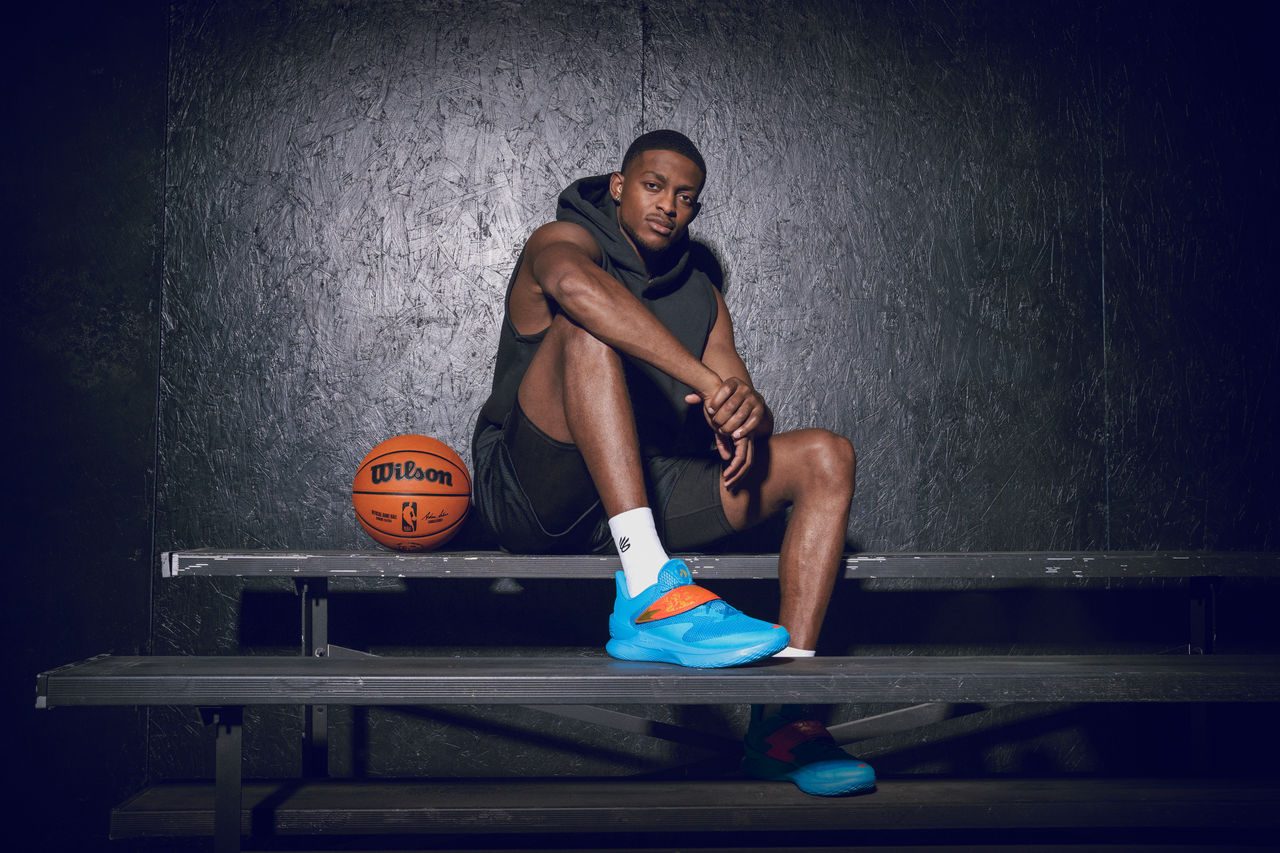
Inspired by De'Aaron Fox's journey and creative instincts, the collaboration celebrates...](https://about.underarmour.com/en/stories/2026/07/sharpie-and-under-armour-launch-limited-edition-d--fox-x-sharpie.html)
[
\
Under Armour and Lapstone & Hammer Celebrate MLB All-Star Week with Exclusive Sneaker Release and Launch Party\
As Philadelphia prepares to welcome MLB All-Star Week, Under Armour and Lapstone & Hamm...](https://about.underarmour.com/en/stories/2026/07/under-armour-and-lapstone---hammer-celebrate-mlb-all-star-week-w.html)
[
\
Under Armour and Bryce Harper Celebrate Philadelphia with the Launch of the Harper 11\
Bryce Harper and Under Armour introduce the Harper 11, the latest evolution of Harper's...](https://about.underarmour.com/en/stories/2026/07/under-armour-and-bryce-harper-celebrate-philadelphia-with-the-la.html)
[
\
Introducing the UA Flare\
IntroducING the UA Flare: a bold new sportswear silhouette inspired by the fluidity of ...](https://about.underarmour.com/en/stories/2026/07/introducing-the-ua-flare.html)
[
\
UA Expands Award-Winning No Weigh Bag Collection with Two New Additions\
Under Armour's No Weigh collection is expanding with No Weigh Lite and No Weigh Playmak...](https://about.underarmour.com/en/stories/2026/06/ua-expands-award-winning-no-weigh-bag-collection-with-two-new-ad.html)
[
\
Under Armour and 424 Unveil Collaborative Capsule at Paris Fashion Week\
Under Armour and LA-based label 424 debuted their first capsule at Paris Fashion Week S...](https://about.underarmour.com/en/stories/2026/06/under-armour-and-424-unveil-collaborative-capsule-at-paris-fashi.html)
[
\
Dodge and Under Armour Unleash a High-Octane Collection\
Dodge and Under Armour today announce a bold new collaboration for those who move fast,...](https://about.underarmour.com/en/stories/2026/06/dodge-and-under-armour-unleash-a-high-octane-collection.html)
[
\
Under Armour and Bobby Witt Jr. Bring the Thrill of the “Perfect Pull” to the Diamon with the Dream Pull PE\
Bobby Witt Jr. and Under Armour introduce the Dream Pull PE, the shortstop’s first play...](https://about.underarmour.com/en/stories/2026/06/under-armour-and-bobby-witt-jr--bring-the-thrill-of-the--perfect.html)
[
\
Under Armour Welcomes Tinx as New Brand Ambassador\
Under Armour today welcomes Tinx, as its newest brand ambassador, representing both UA ...](https://about.underarmour.com/en/stories/2026/06/under-armour-welcomes-tinx-as-new-brand-ambassador.html)
[
\
SSC Welcomes Under Armour as Official Conference Apparel Partner\
The Sunshine State Conference and Under Armour announce a new five-year agreement, nami...](https://about.underarmour.com/en/stories/2026/06/ssc-welcomes-under-armour-as-official-conference-apparel-partner.html)
[
\
Diana Flores and Under Armour Champion the Next Generation of Flag Football Athletes with the Third Annual UA Next Flag Football Camp\
Diana Flores and Under Armour joined forces to inspire the next generation of athletes ...](https://about.underarmour.com/en/stories/2026/06/diana-flores-and-under-armour-champion-the-next-generation-of-fl.html)
[
\
Record Graduation and GPA Rates Highlight the Impact of Under Armour's Project Rampart\
For thousands of Baltimore City high school students, Project Rampart is proving what h...](https://about.underarmour.com/en/stories/2026/06/record-graduation-and-gpa-rates-highlight-the-impact-of-under-ar.html)
[
\
Marine Serre and Under Armour Introduce a New Vision of Performance\
A debut capsule collection with Marine Serre and Under Armour, Marine — inspired by Und...](https://about.underarmour.com/en/stories/2026/05/marine-serre-and-under-armour-introduce-a-new-vision-of-performa.html)
[
\
Under Armour Advances Its T-Shirt Legacy with the Launch of The Bouncy Tee\
The Bouncy Tee–Designed to look and feel like your favorite premium cotton tee while pe...](https://about.underarmour.com/en/stories/2026/05/under-armour-advances-its-t-shirt-legacy-with-the-launch-of-the-.html)
[
\
Under Armour Signs Multi-Platinum Country Music Star Parker McCollum to Multi-Year Partnership\
Parker joins Under Armour as an official ambassador for footwear and apparel as it cont...](https://about.underarmour.com/en/stories/2026/05/under-armour-signs-multi-platinum-country-music-star-parker-mcco.html)
[
\
Justin Jefferson and Under Armour Elevated JJets Flight School to New Heights in its Second Year\
Justin Jefferson and Under Armour elevated JJets Flight School powered by UA Next to n...](https://about.underarmour.com/en/stories/2026/05/justin-jefferson-flight-school-2026.html)
[
\
Save & Close Jordan Thompson and Under Armour Host First Collegiate Volleyball Camp\
Jordan Thompson and Under Armour hosted its fifth-annual Jordan Thompson Rise Academy v...](https://about.underarmour.com/en/stories/2026/05/jordan-thompson-and-under-armour-host-first-collegiate-volleybal.html)
[
\
Under Armour's FC Barcelona Stars Rise to the Pressure of Tradition Ahead of El Clásico\
Under Armour and FC Barcelona’s rising stars Fermín López and Marc Casadó stepped away ...](https://about.underarmour.com/en/stories/2026/05/under-armour-s-fc-barcelona-stars-rise-to-the-pressure-of-tradit.html)
[
\
Under Armour Brings Fit For The Pit Experience to Rolling Loud 2026 as the Festival’s Exclusive Performance Apparel Partner\
Under Armour is coming to hip‑hop’s biggest weekend as the exclusive performance appare...](https://about.underarmour.com/en/stories/2026/04/under-armour-brings-fit-for-the-pit-experience-to-rolling-loud-2.html)
[
\
Inside Under Armour's Project Rampart Summit\
Under Armour's Project Rampart invests in student athletes as competitors and future le...](https://about.underarmour.com/en/stories/2026/04/inside-under-armour-s-project-rampart-summit.html)
[
\
Under Armour Unveils First UA NEXT Performance Lab in China\
Powered by the UA Next Combine System to deliver data-driven testing and advanced train...](https://about.underarmour.com/en/stories/2026/04/under-armour-unveils-first-ua-next-performance-lab-in-china.html)
[
\
What Running Shoe Do I Need? Understanding the UA Velociti Lineup\
Welcome Spring. Miles move outdoors. And once again, all eyes turn to Boston. Whether y...](https://about.underarmour.com/en/stories/2026/04/what-running-shoe-do-i-need--understanding-the-ua-velociti-lineu.html)
[
\
Under Armour and UNLESS Collective Unveil Regenerative Earth Day Capsule, “Earth Essentials”\
This Earth Day, Under Armour and UNLESS Collective introduce “Earth Essentials”, a new ...](https://about.underarmour.com/en/stories/2026/04/unless-earth-day.html)
[
\
Under Armour Joins U.S. Cotton Trust Protocol, Advancing Responsible Cotton Sourcing\
Under Armour is joining the U.S. Cotton Trust Protocol (USCTP), strengthening efforts t...](https://about.underarmour.com/en/stories/2026/04/under-armour-joins-u-s--cotton-trust-protocol--advancing--respon.html)
[
\
Sharon Lokedi Makes History Defending Her Crown in Boston\
Sharon Lokedi cemented her place in marathon history at the 2026 Boston Marathon, succe...](https://about.underarmour.com/en/stories/2026/04/sharon-lokedi-makes-history-defending-her-crown-in-boston.html)
[
\
The Future of Stretch\
In 1996, Under Armour proved a single shirt can change the game forever. The brand’s or...](https://about.underarmour.com/en/stories/2026/04/the-future-of-stretch.html)
[
\
Under Armour Launches its Most Innovative Boot to Date: The Shadow Elite 4\
Under Armour has raised the stakes further with the new Shadow Elite 4. Engineered for ...](https://about.underarmour.com/en/stories/2026/04/under-armour-launches-its-most-innovative-boot-to-date--the-shad.html)
[
\
The Coachella Survival Guide\
Coachella isn’t just a music festival; it’s a high-endurance athletic event. Between th...](https://about.underarmour.com/en/stories/2026/04/the-coachella-survival-guide.html)
[
\
Unrivaled Sports Partners with Under Armour and DICK'S Sporting Goods to Build the Future of Youth Sports Experiences\
Under Armour and DICK'S will partner with Unrivaled Sports to collaborate to elevate t...](https://about.underarmour.com/en/stories/2026/04/unrivaled-sports-partners-with-under-armour-and-dick-s-sporting-.html)
[
\
Under Armour Unveils Tysons Corner Sports House \
On March 26, 2026, Under Armour officially opened the doors to its new Tysons Corner Sp...](https://about.underarmour.com/en/stories/2026/03/under-armour-unveils-tysons-corner-sports-house-.html)
[
\
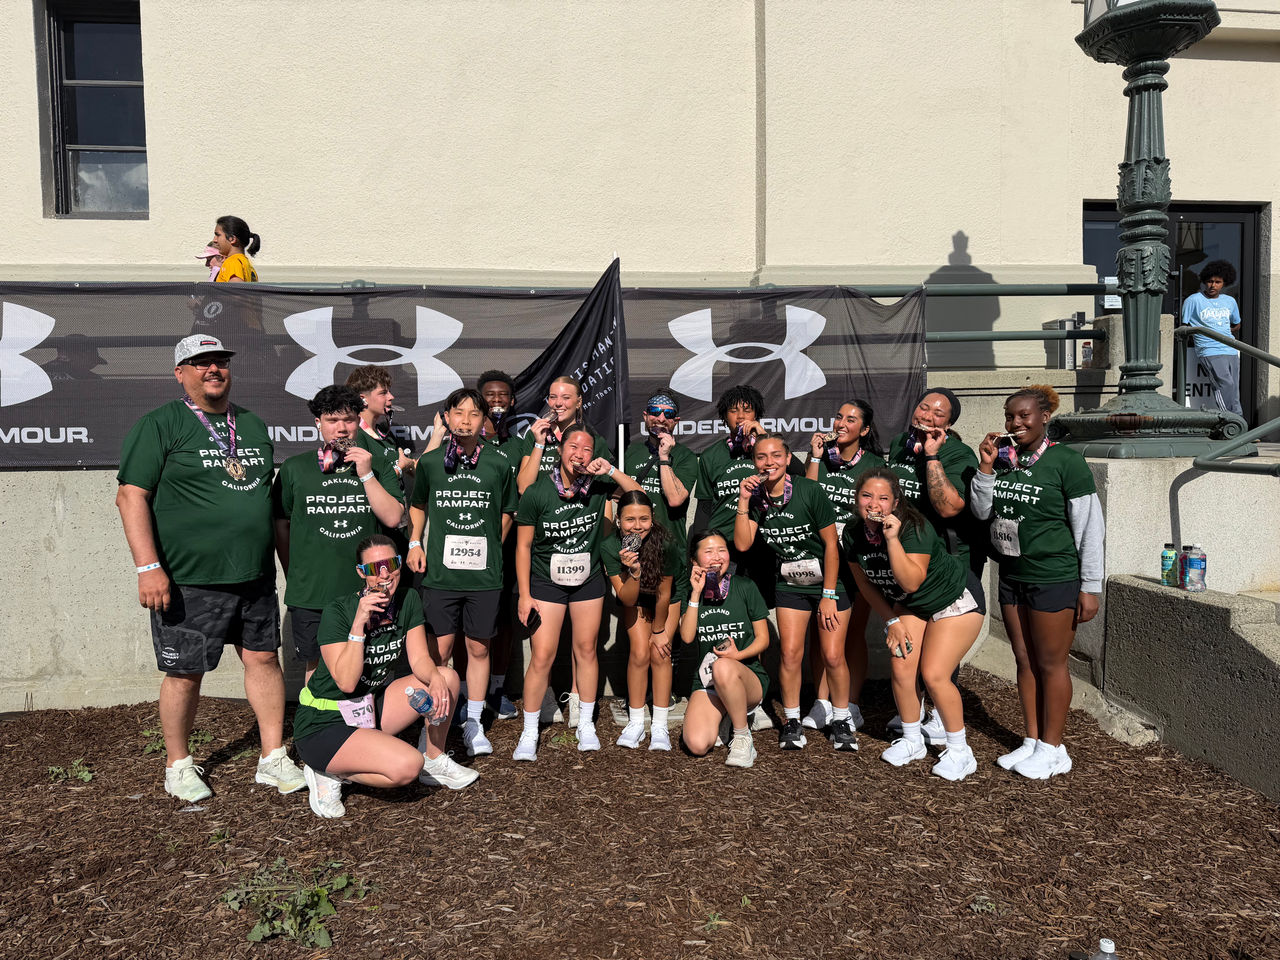
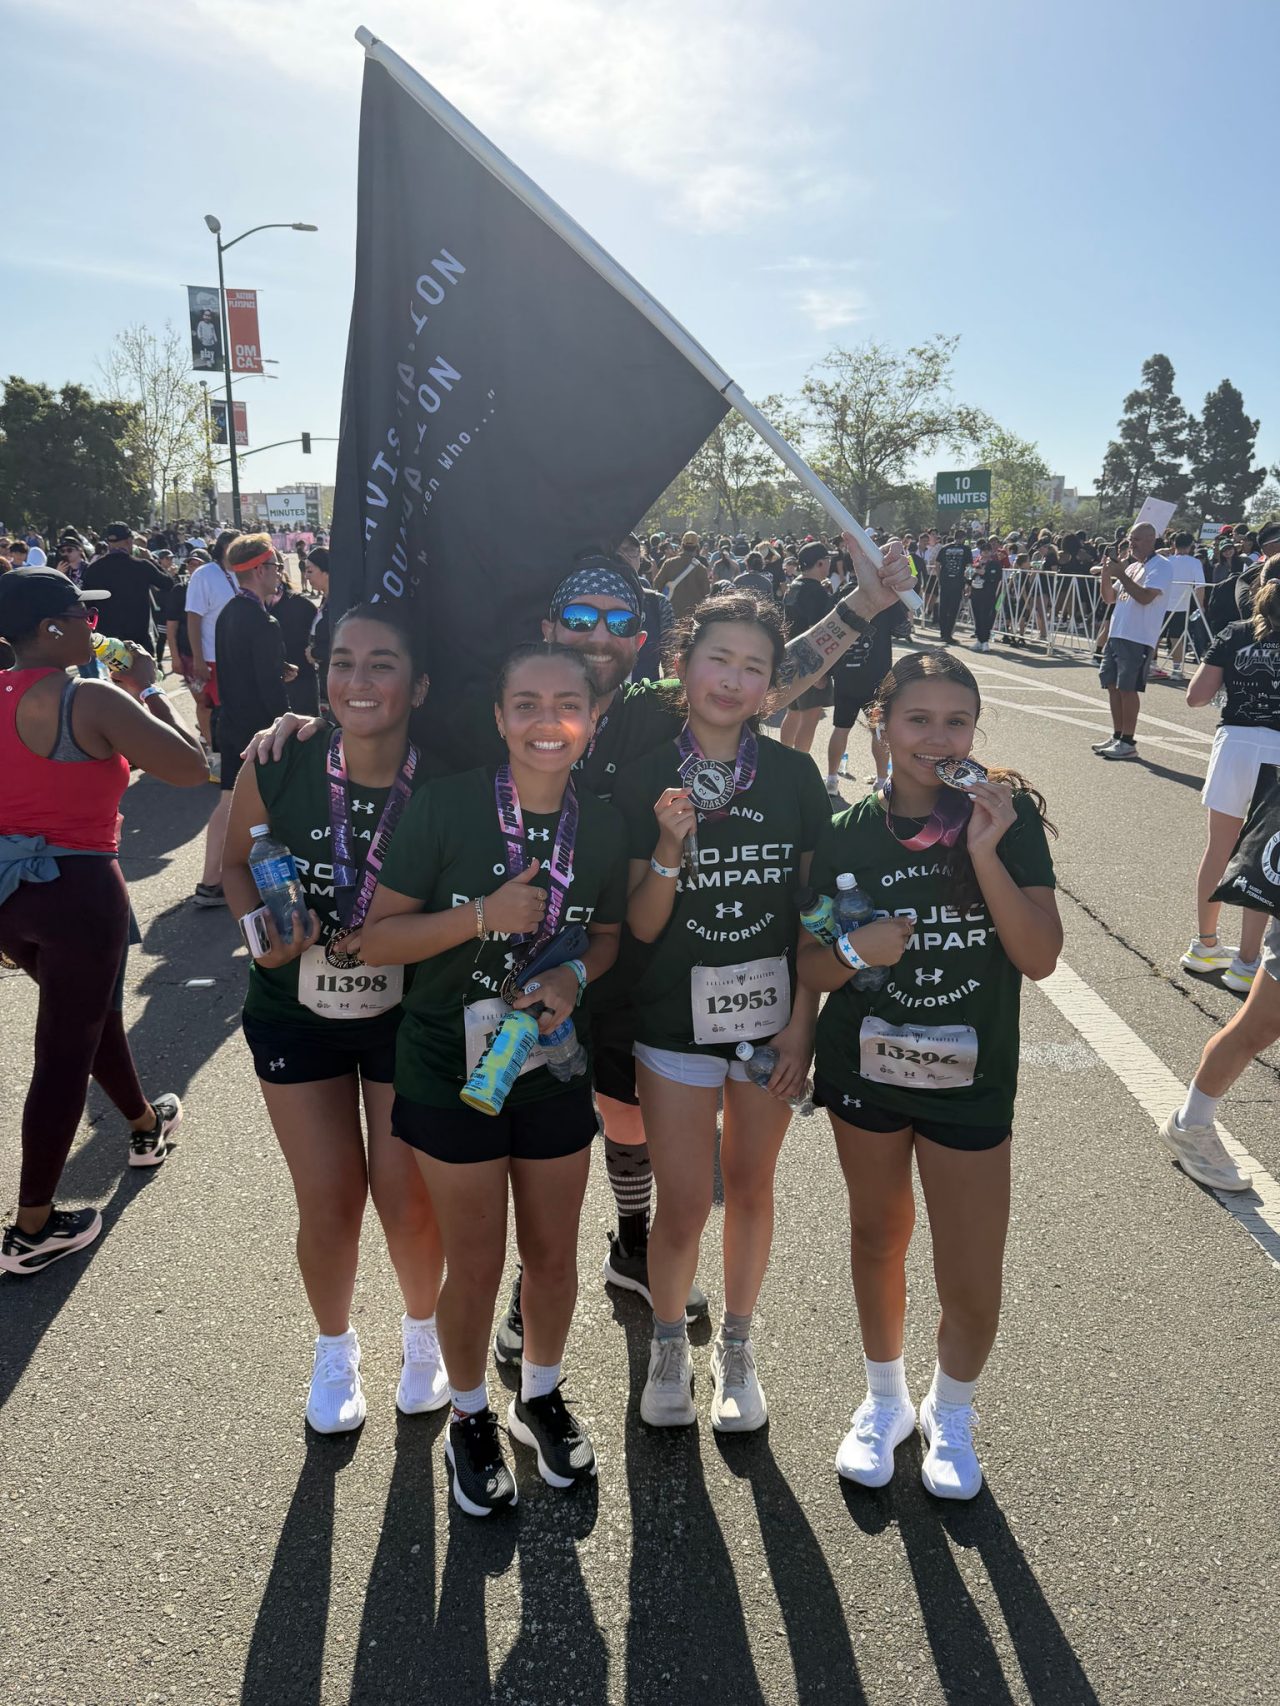
Under Armour Deepens Commitment to Oakland Student-Athletes with $100,000 Project Rampart Matching Opportunity\
Company pairs a matching commitment with on-the-ground presence at the Oakland Marathon...](https://about.underarmour.com/en/stories/2026/03/under-armour-deepens-commitment-to-oakland-student-athletes-with.html)
[
\
Orioles And Under Armour Announce Multi-Year Partnership\
The Orioles and Under Armour announced a new multi-year partnership, bringing together ...](https://about.underarmour.com/en/stories/2026/03/orioles-and-under-armour-announce-multi-year-partnership.html)
[
\
Your SXSW Lineup Just Got Upgraded\
Under Armour (UA) and UNLESS are bringing a significant presence to SXSW. Get ready for...](https://about.underarmour.com/en/stories/2026/03/your-sxsw-lineup-just-got-upgraded.html)
[
\
SXSW to Debut First-ever Official Filmmakers Jackets\
South by Southwest (SXSW) will unveil this year its first-ever official Filmmakers Jack...](https://about.underarmour.com/en/stories/2026/03/sxsw-to-debut-first-ever-official-filmmakers-jackets.html)
[
\
Under Armour Completes the Next Generation of Velociti with the Distance and Pace Models\
Under Armour has expanded its next generation Velociti franchise with the addition of t...](https://about.underarmour.com/en/stories/2026/02/under-armour-completes-the-next-generation-of-velociti-with-the-.html)
[
\
Cale Makar Wins Silver With Team Canada at the 2026 Winter Games\
Under Armour athlete Cale Makar has added another milestone to his already remarkable c...](https://about.underarmour.com/en/stories/2026/02/cale-makar-wins-silver-with-team-canada-at-the-2026-winter-games.html)
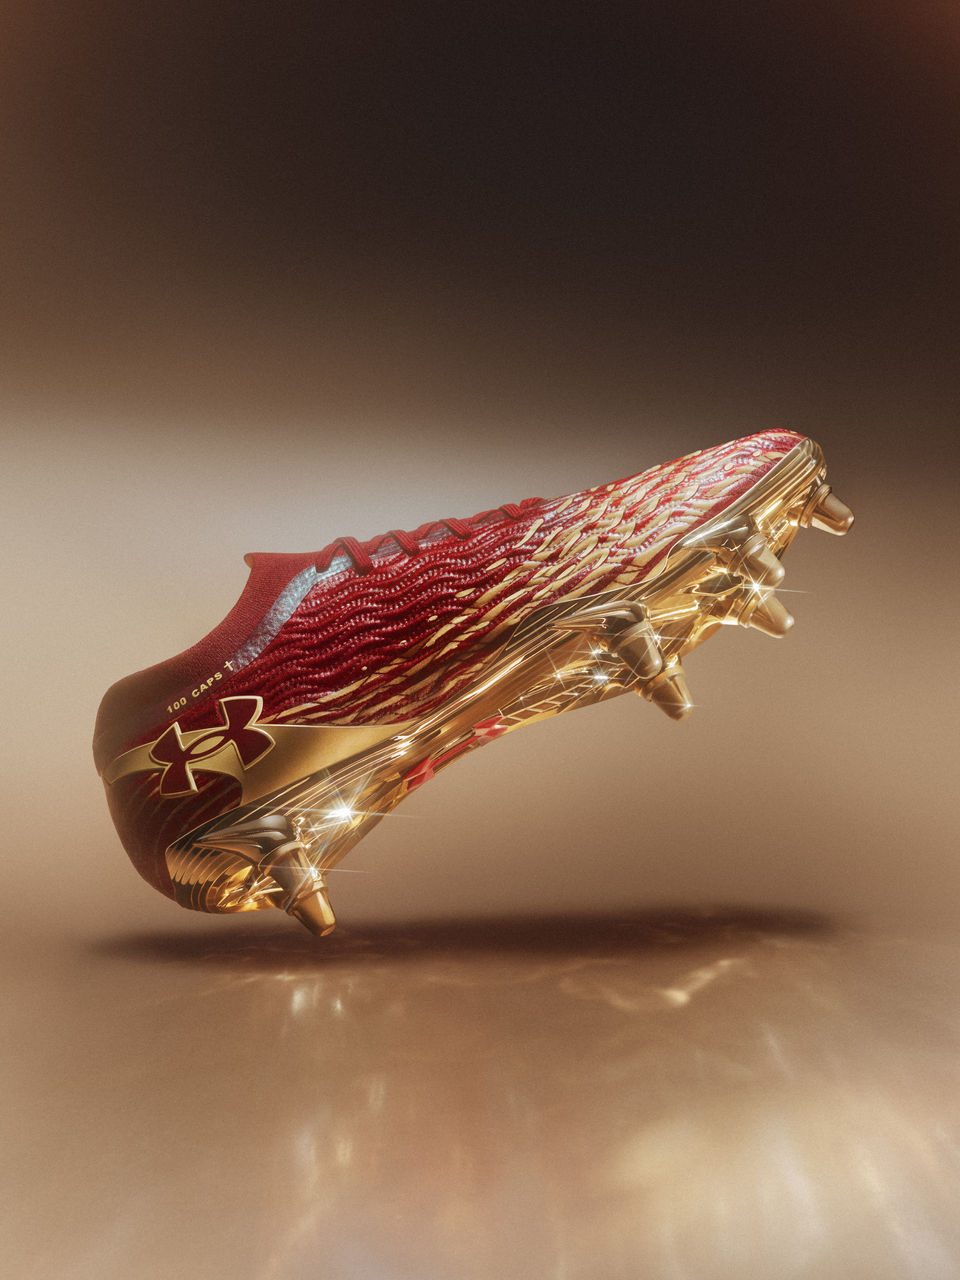
[
\
MI100: Under Armour and Maro Itoje unveil bespoke boot to mark England centurion milestone\
Maro Itoje has collaborated with Under Armour to design a player-exclusive boot celebra...](https://about.underarmour.com/en/stories/2026/02/mi100--under-armour-and-maro-itoje-unveil-bespoke-boot-to-mark-e.html)
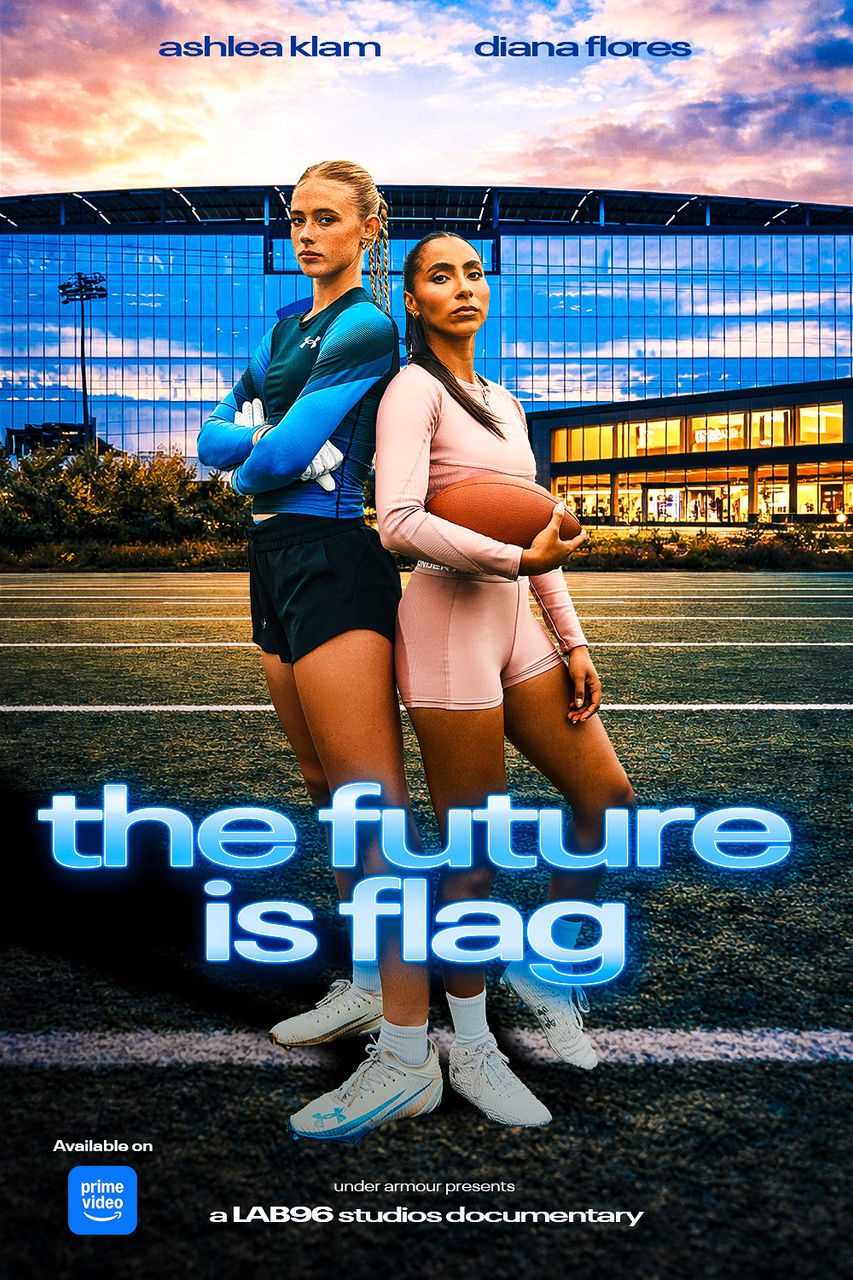
[
\
Under Armour’s Lab96 Studios and SMAC Entertainment Highlight the Global Rise of Women’s Flag Football in The Future Is Flag on Prime Video\
The Future Is Flag, a definitive documentary exploring the rapid evolution and rising g...](https://about.underarmour.com/en/stories/2026/02/the-future-is-flag.html)
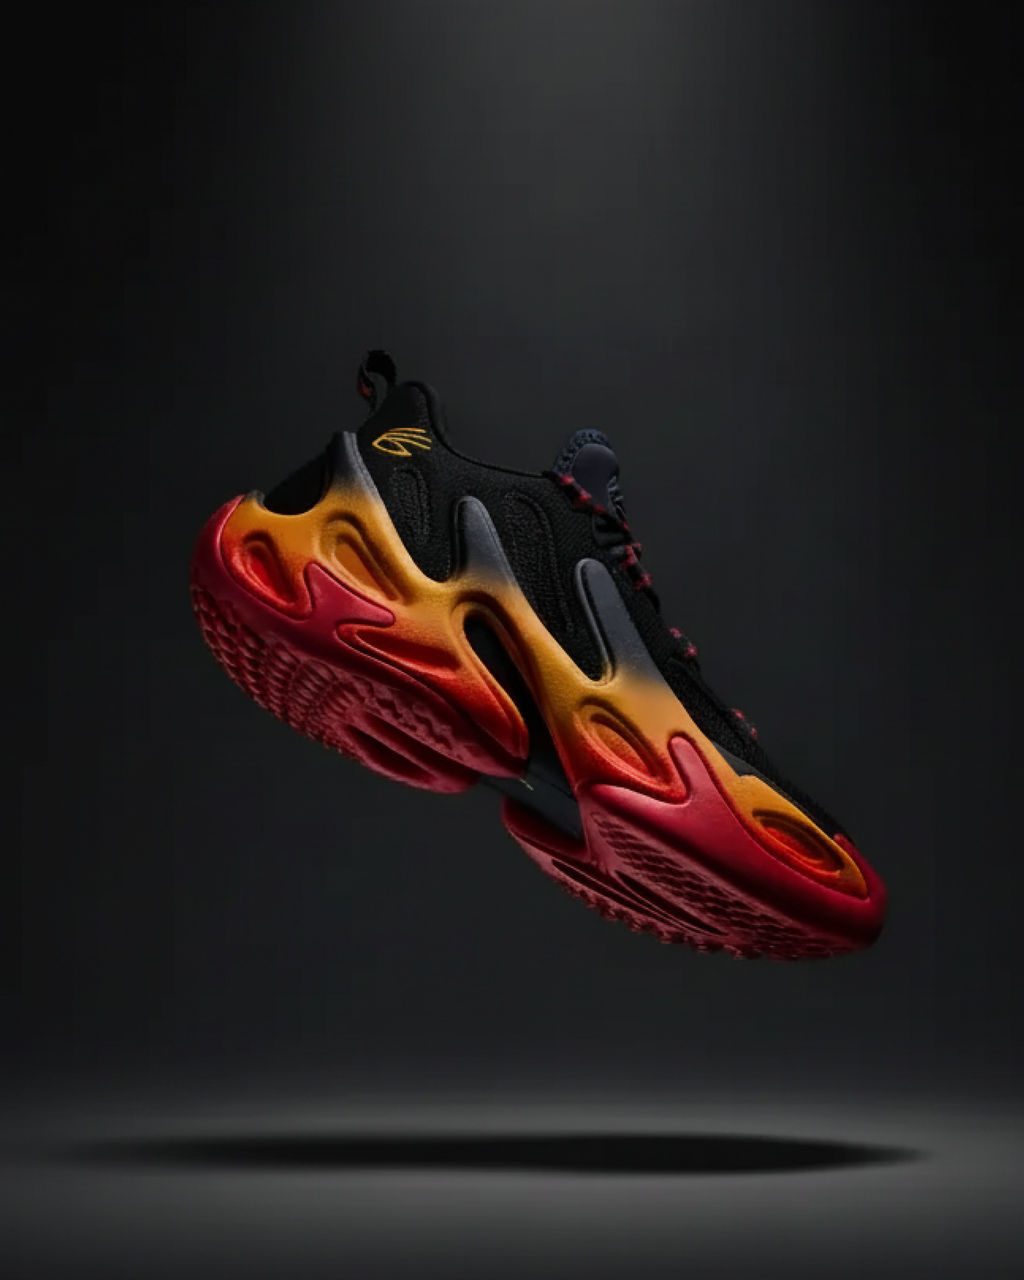
[
\
Under Armour Drops the Curry 13 - The Final Chapter in a Signature Era\
Under Armour today introduces the Curry 13, the final signature sneaker in the Curry Br...](https://about.underarmour.com/en/stories/2026/02/under-armour-drops-the-curry-13---the-final-chapter-in-a-signatu.html)
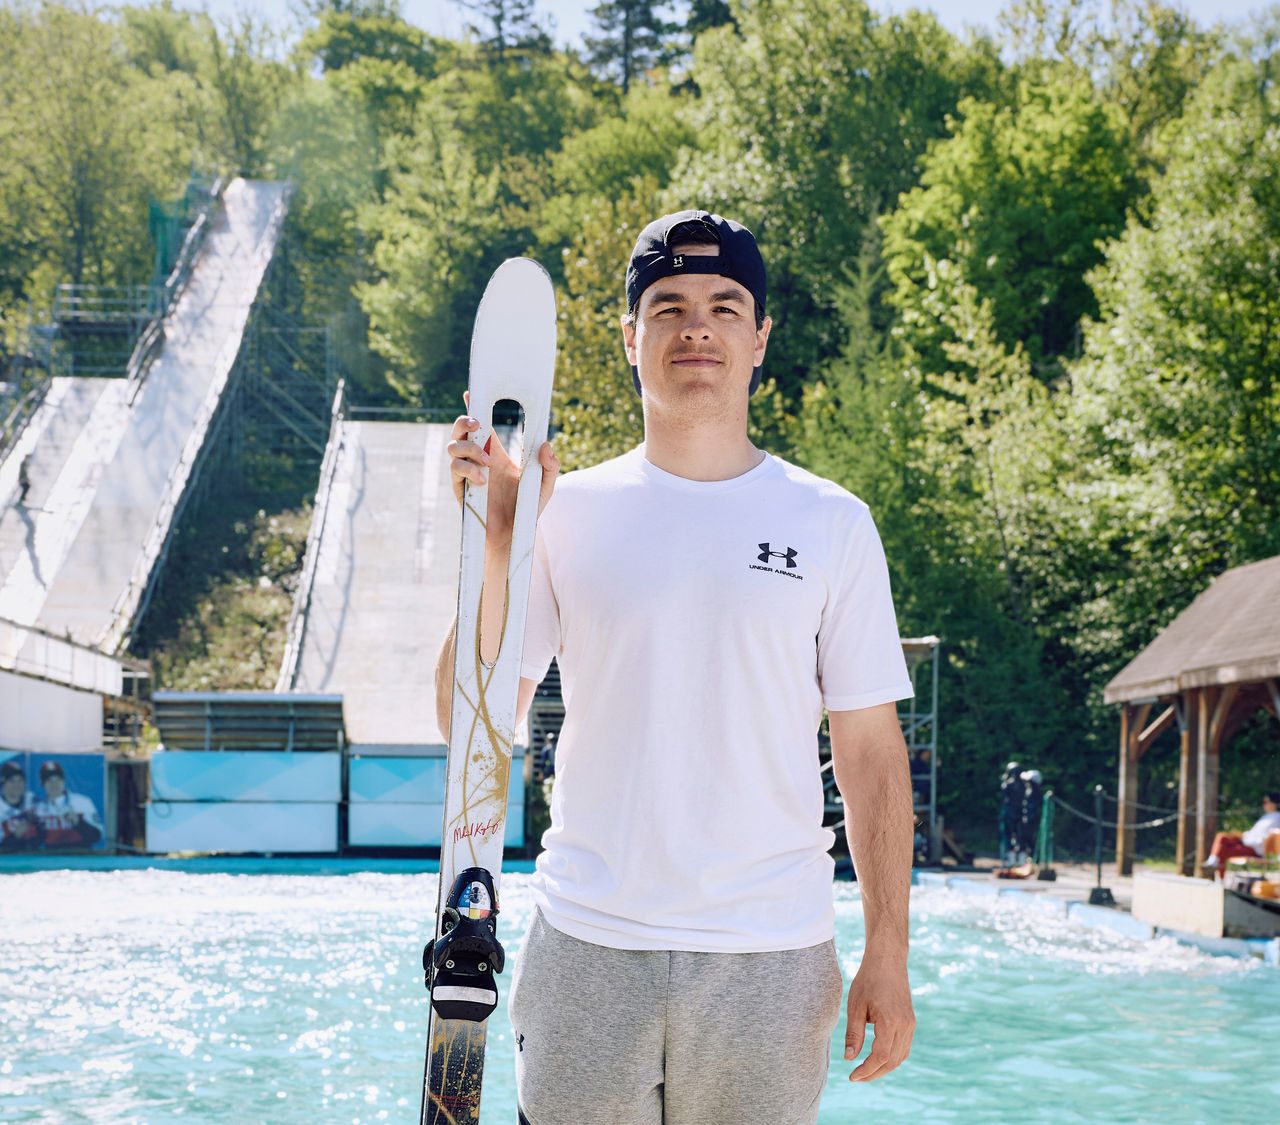
[
\
Mikaël Kingsbury Extends His Legacy with Another Podium Finish\
The Canadian superstar and the most decorated moguls skier in World Cup history, claime...](https://about.underarmour.com/en/stories/2026/02/mikael-kingsbury-extends-his-legacy-with-another-podium-finish.html)
[
\
[
\
[
\
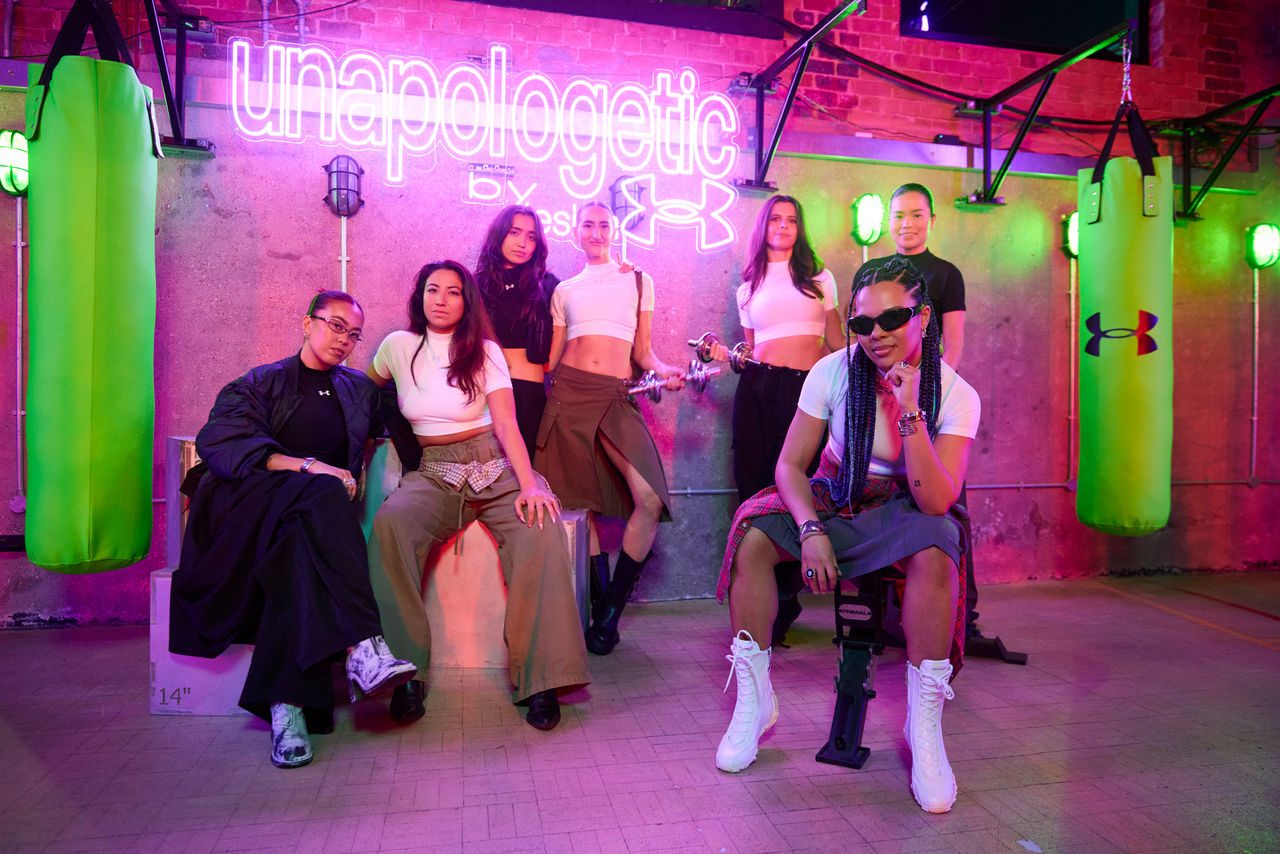
Under Armour launches its latest women’s baselayer with “LDN Layers” party\
Last night, Under Armour unveiled its new Women’s Crop Mock Baselayer by hosting LDN La...](https://about.underarmour.com/en/stories/2026/01/under-armour-launches-its-latest-women-s-baselayer-with--ldn-lay.html)
[
\
Under Armour Unveils New Golf Innovations Set to Redefine Fit and Performance on the Course\
Under Armour is advancing the next chapter of golf performance footwear and apparel wit...](https://about.underarmour.com/en/stories/2026/01/under-armour-unveils-new-golf-innovations-set-to-redefine-fit-an.html)
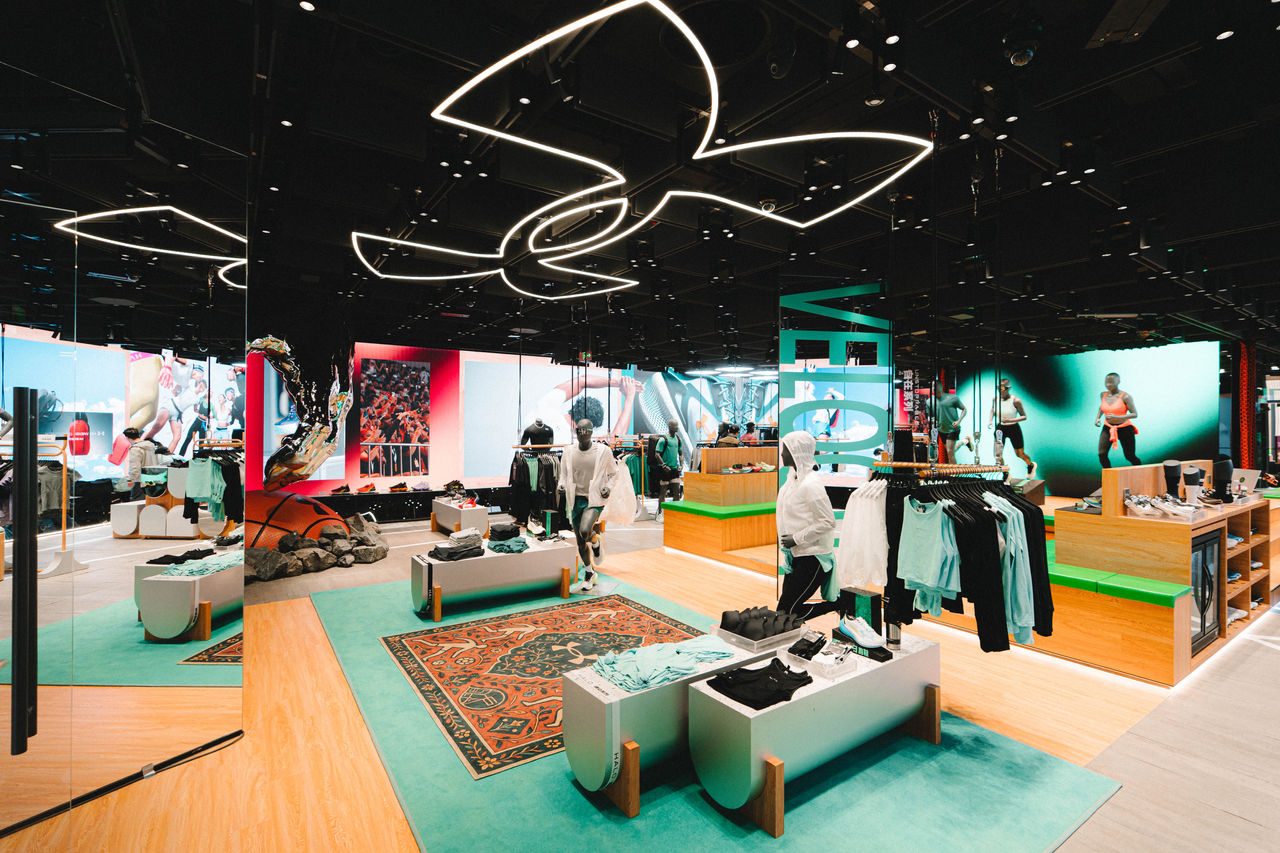
[
\
Guangzhou, China - Under Armour Debuts Future Retail Pilot, Fusing Innovation and Community to Redefine the Athlete Experience\
Under Armour introduces its first-of-its-kind smart sports community space at Julongwan...](https://about.underarmour.com/en/stories/2026/01/guangzhou--china---under-armour-debuts-future-retail-pilot--fusi.html)
[
\
Under Armour Welcomes KJ Jackson as Latest Brand Ambassador\
Under Armour is proud to welcome KJ Jackson to its growing roster of athletes ahead of ...](https://about.underarmour.com/en/stories/2026/01/under-armour-welcomes-kj-jackson-as-latest-brand-ambassador.html)
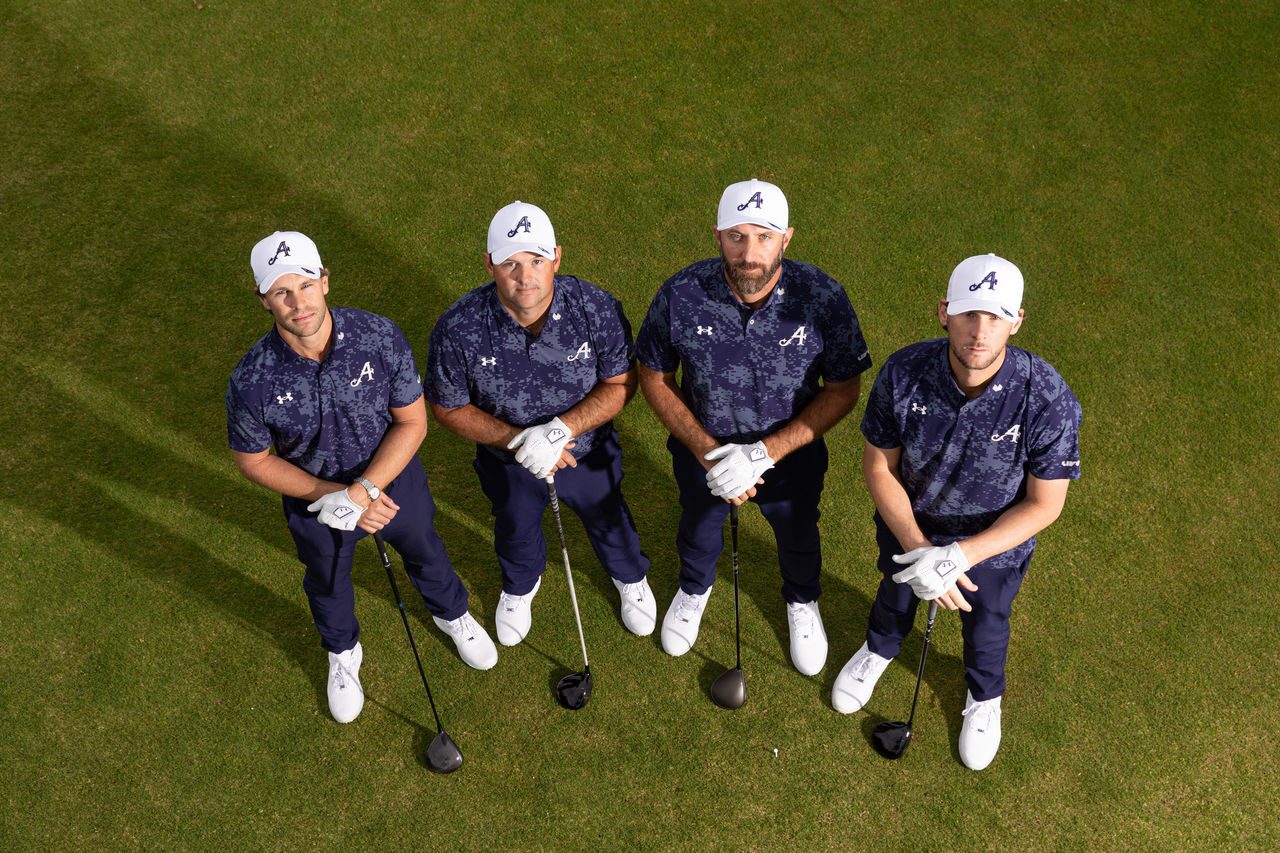
[
\
Under Armour Partners with the 4Aces GC Ahead of LIV Golf Season Opener\
Under Armour is officially joining forces with the 4Aces GC to bring its latest golf in...](https://about.underarmour.com/en/stories/2026/01/under-armour-partners-with-the-4aces-gc-ahead-of-liv-golf-season.html)
[
\
Under Armour Honors Legacy at UA Next All-America\
Under Armour hosted its 18th annual UA Next All-America Week in Orlando, Florida from D...](https://about.underarmour.com/en/stories/2025/12/under-armour-spotlights-roses-to-pearl-legacy-at-ua-next-all-ame.html)
[
\
Under Armour and UNLESS Unveil “Pulse,” the Next Chapter in Regenerative Sportswear\
Under Armour and UNLESS announce the launch of Pulse, a new regenerative apparel and fo...](https://about.underarmour.com/en/stories/2025/12/under-armour-and-unless-unveil--pulse---the-next-chapter-in-rege.html)
[
\
Meet the Boxerjock Ballbag™\
Introducing the Boxerjock Ballbag™ - a breakthrough so supportive, so breathable, so co...](https://about.underarmour.com/en/stories/2025/12/meet-the-boxerjock-ballbag-.html)
[
\
EASL and Under Armour Unveil Multi-Year Partnership\
This strategic partnership fuels Asia’s premier basketball champions league while also ...](https://about.underarmour.com/en/stories/2025/12/easl-and-under-armour-unveil-multi-year-partnership.html)
[
\
Under Armour Unveils the No Weigh Duffle Backpack\
Under Armour is redefining what a duffle can do with the launch of the No Weigh Duffle ...](https://about.underarmour.com/en/stories/2025/12/under-armour-unveils-the-no-weigh-duffle-backpack.html)
[
\
Mikel Arteta and Under Armour Challenge the Next Generation of London’s Athletes\
UA Next London may be concluding it’s ninth season of competition, having tested over 1...](https://about.underarmour.com/en/stories/2025/12/mikel-arteta-and-under-armour-challenge-the-next-generation-of-l.html)
[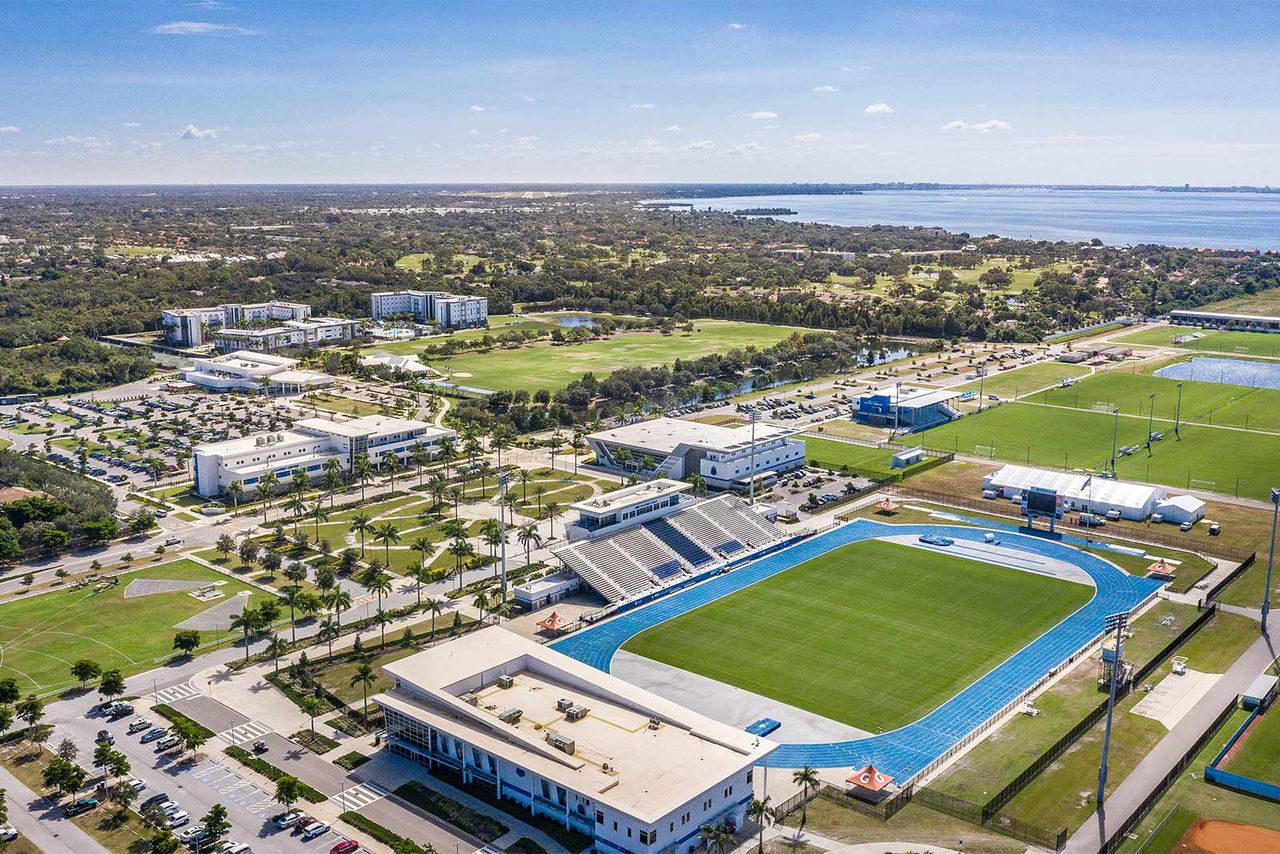
\
IMG Academy Set to Host Inaugural 2026 Under Armour Track and Field Nationals\
Under Armour and IMG Academy are proud to announce the inaugural 2026 Under Armour Trac...](https://about.underarmour.com/en/stories/2025/12/img-academy-set-to-host-inaugural-2026-under-armour-track-and-fi.html)
[
\
UW Athletics and Under Armour Extend Landmark Partnership\
University of Wisconsin-Madison and Under Armour announced a 10-year extension of its ...](https://about.underarmour.com/en/stories/2025/11/uw-athletics-and-under-armour-extend-landmark-partnership.html)
[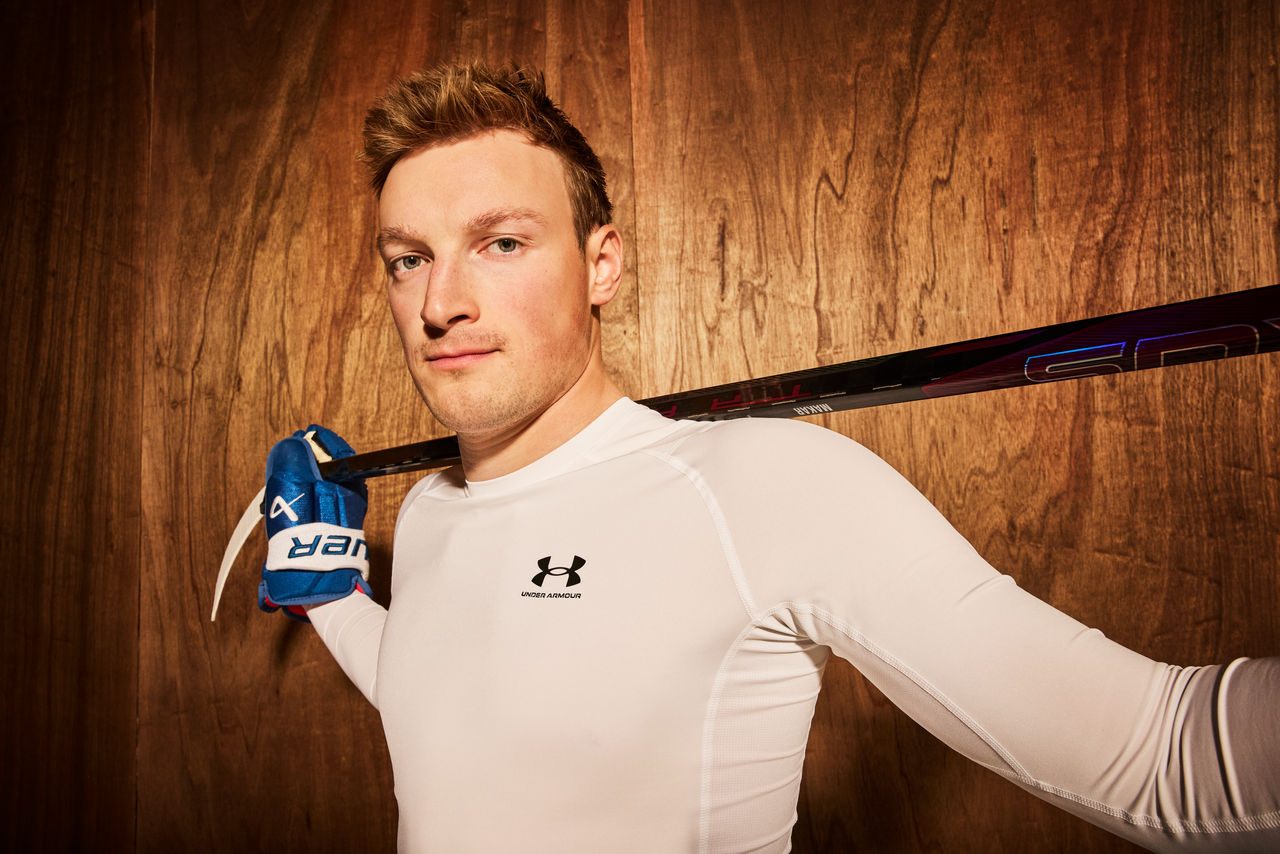
\
Under Armour Signs NHL Defender Cale Makar\
Under Armour is thrilled to welcome this extraordinary talent to its roster of athletes...](https://about.underarmour.com/en/stories/2025/11/under-armour-signs-nhl-defender-cale-makar.html)
[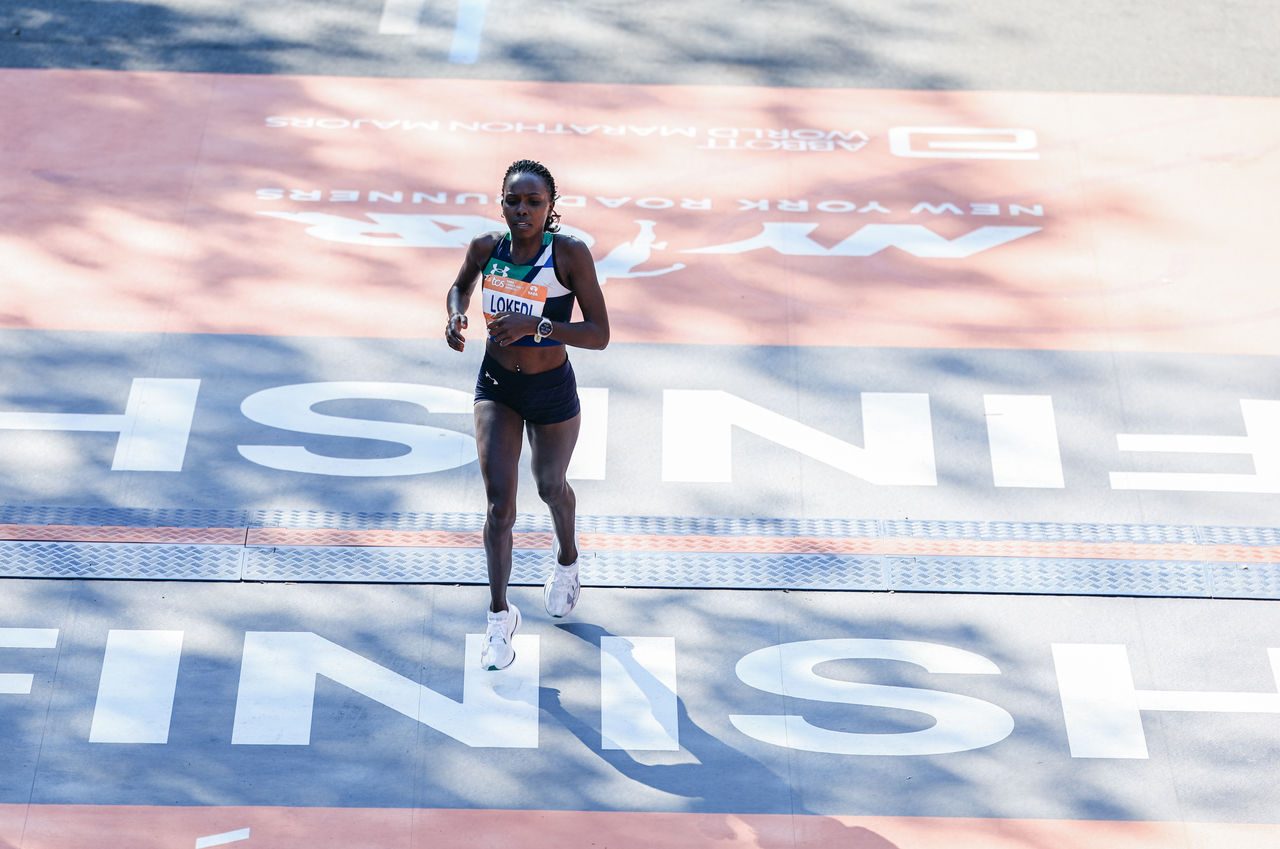
\
Sharon Lokedi Secures Monumental Third Podium at the New York City Marathon\
Crossing the finish line in 2:20:07, Lokedi battled through a world-class field to clai...](https://about.underarmour.com/en/stories/2025/11/sharon-lokedi-new-york-city-marathon-2025.html)
[
\
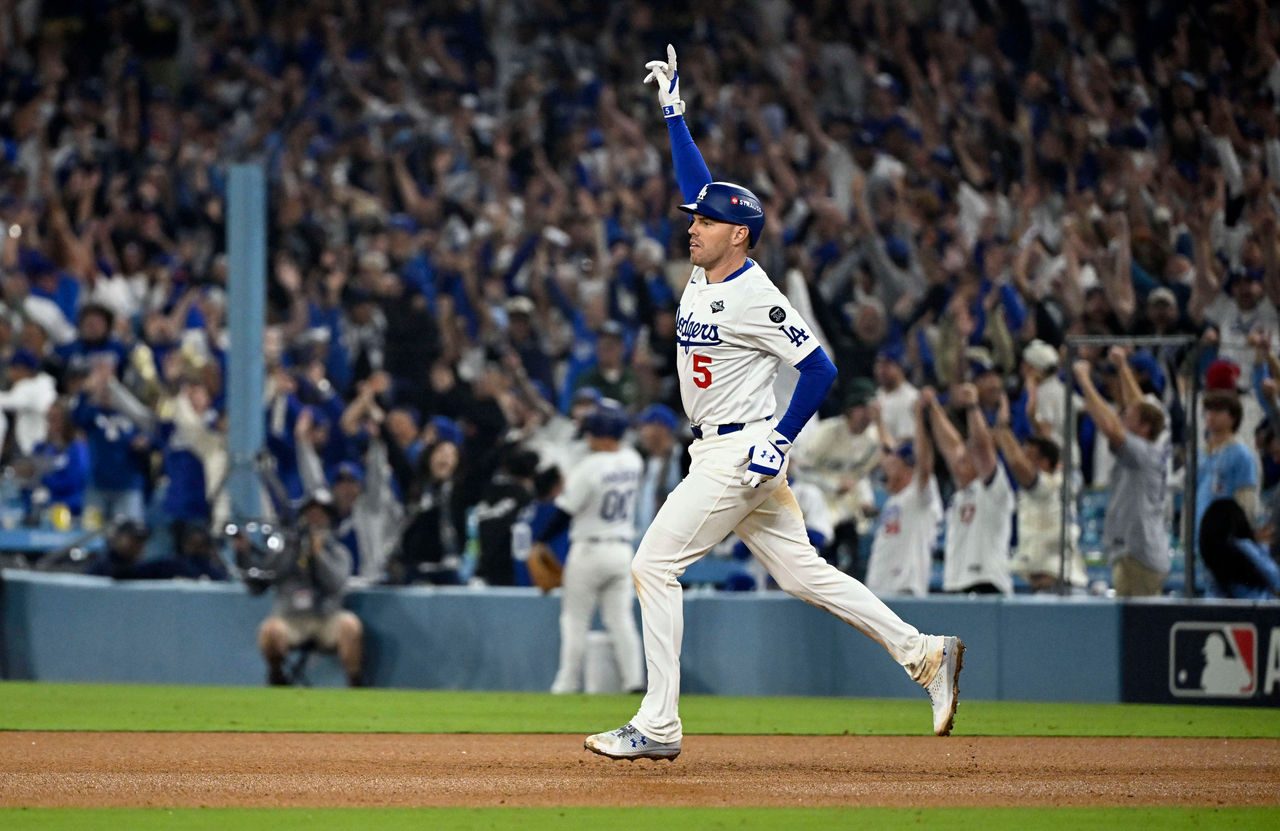
Freddie Freeman Wins Back-to-Back World Series Titles\
Under Armour athlete and Los Angeles Dodgers first baseman Freddie Freeman helped the D...](https://about.underarmour.com/en/stories/2025/11/freddie-freeman-does-it-again-.html)
[
\
Under Armour Launches Lab96 Studios\
Under Armour introduces Lab96 Studios, its new in-house content studio designed to deli...](https://about.underarmour.com/en/stories/2025/10/under-armour-launches-lab96-studios.html)
[
\
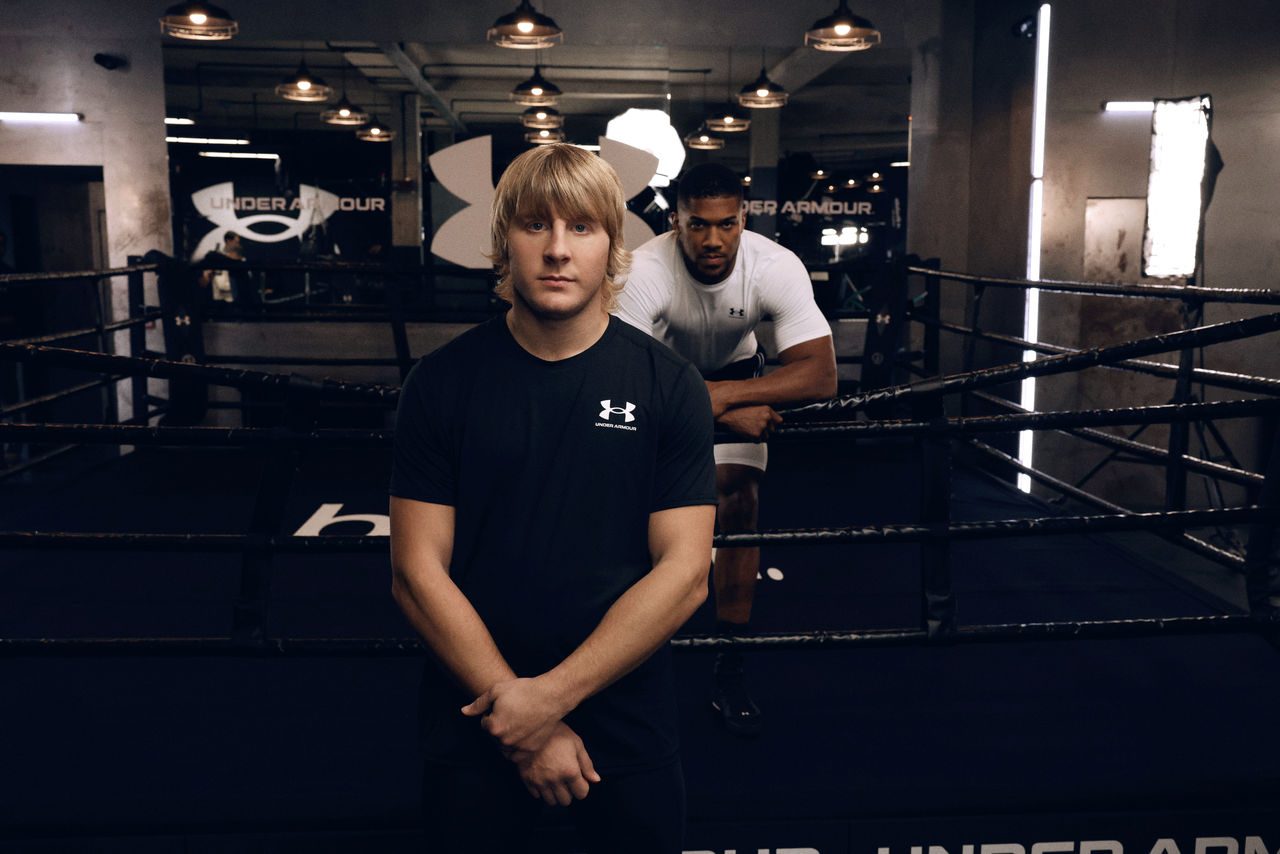
Fight Worlds Collide as Under Armour Unites Anthony Joshua and Paddy ‘The Baddy’ Pimblett in Combat Crossover\
In a meeting of calm and chaos, two-time heavyweight boxing world champion Anthony Josh...](https://about.underarmour.com/en/stories/2025/10/fight-worlds-collide-as-under-armour-unites-anthony-joshua-and-p.html)
[
\
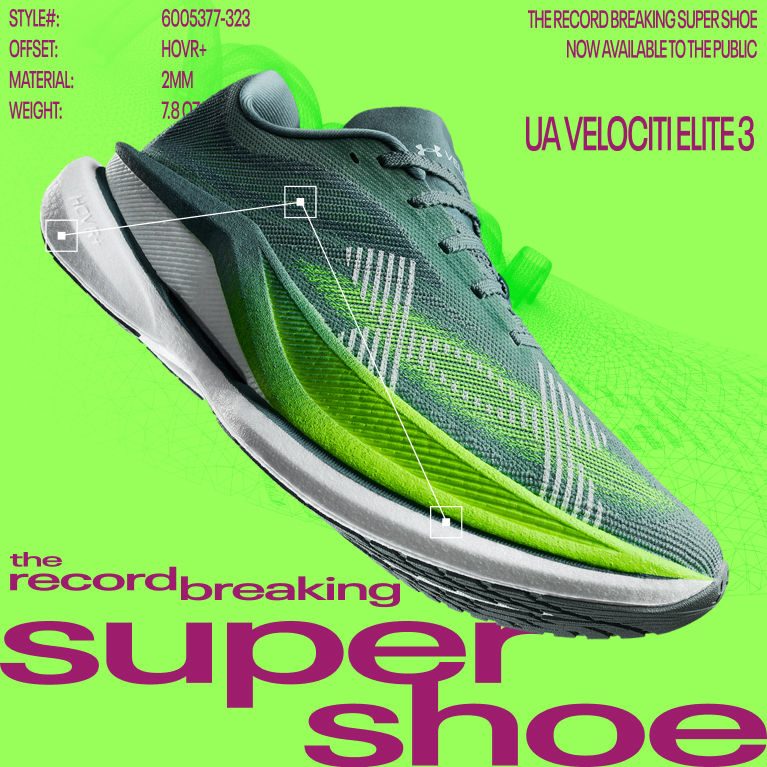
Under Armour’s Next Generation of Velociti is Engineered for Speed and Proven on the Podium\
Under Armour has introduced the next evolution of its flagship technical running platfo...](https://about.underarmour.com/en/stories/2025/10/under-armour-s-next-generation-of-velociti-is-engineered-for-spe.html)
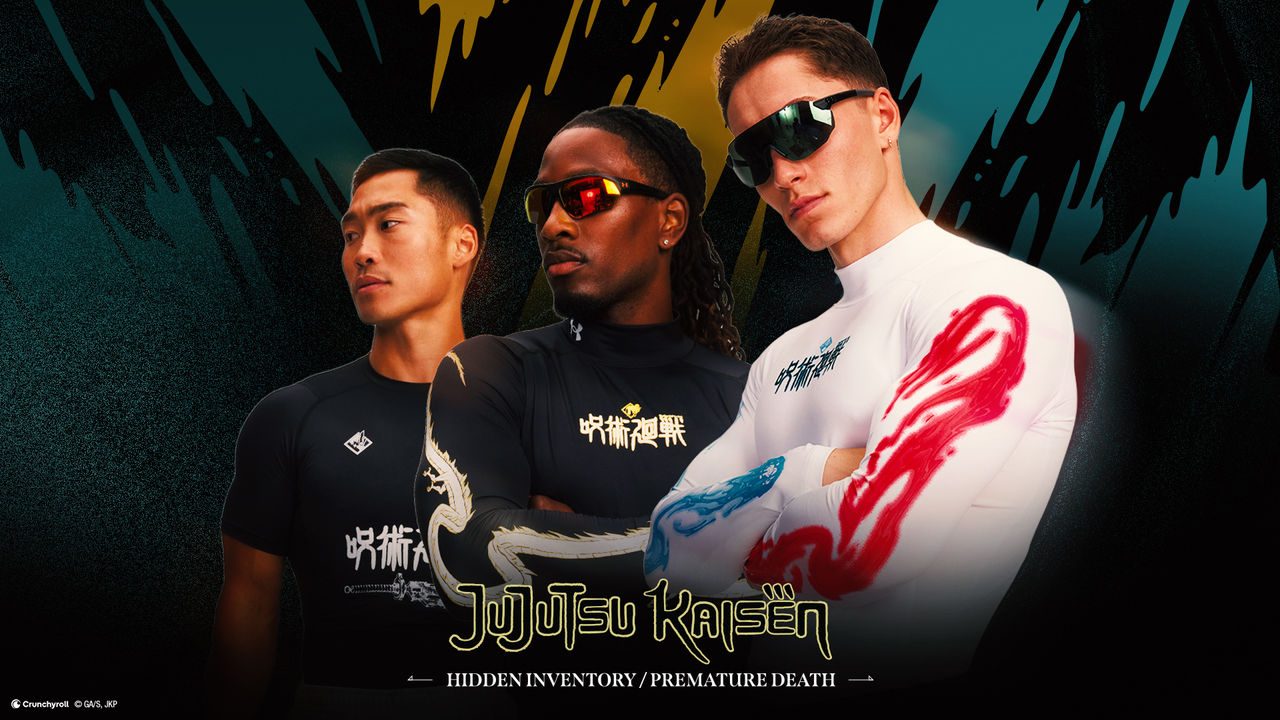
[
\
Under Armour and JUJUTSU KAISEN Unleash Limited-Edition HeatGear® Compression Shirt Capsule\
Under Armour is proud to unveil a bold new collaboration with JUJUTSU KAISEN, the globa...](https://about.underarmour.com/en/stories/2025/10/under-armour-and-jujutsu-kaisen-unleash-limited-edition-heatgear.html)
[
\
Under Armour to Become Official Apparel Provider of Georgia Tech Athletics in 2026\
In 1996, Georgia Tech became Under Armour’s first college customer with the purchase of...](https://about.underarmour.com/en/stories/2025/09/under-armour-to-become-official-apparel-provider-of-georgia-tech.html)
[
\
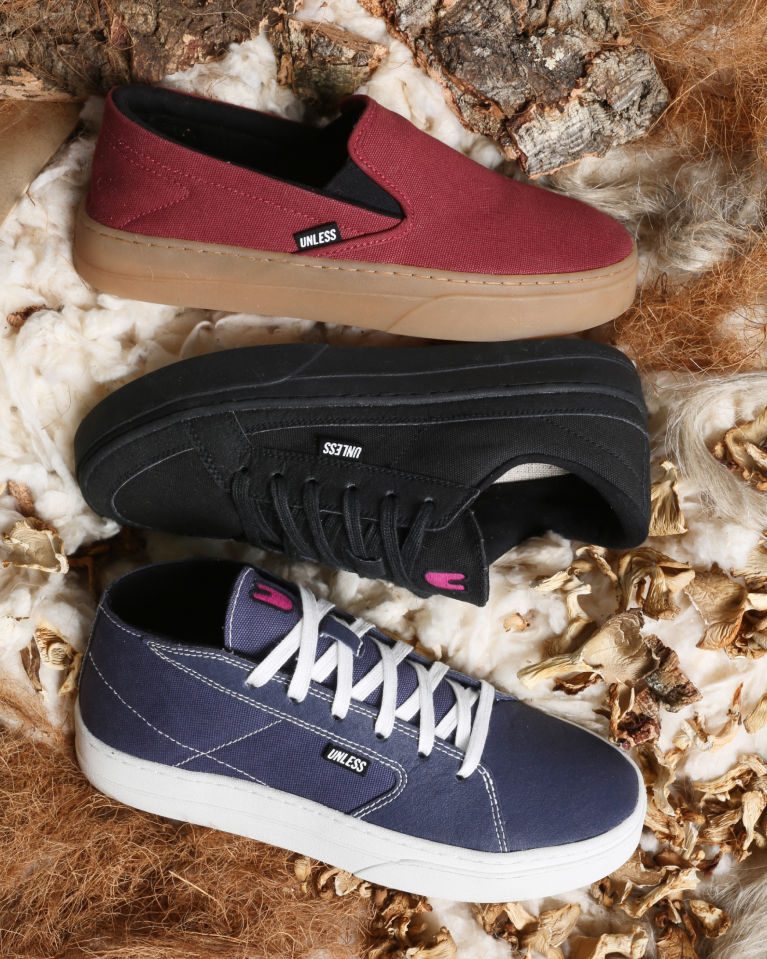
Under Armour and UNLESS Introduce Three Regenerative Footwear Styles\
Under Armour and UNLESS launch three new lifestyle sneakers that embody UNLESS’s regene...](https://about.underarmour.com/en/stories/2025/09/under-armour-and-unless-introduce-three-regenerative-footwear-st.html)
[
\
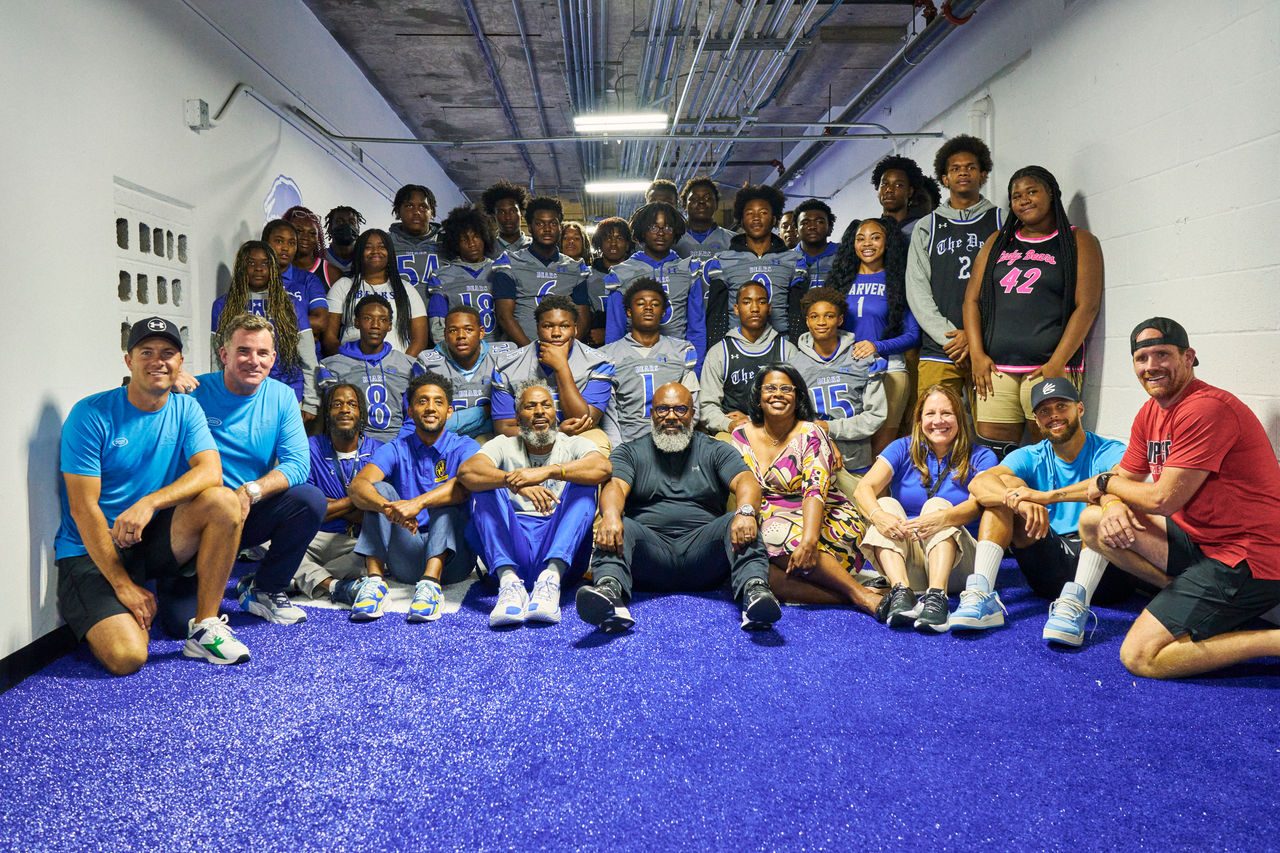
Under Armour’s Celebrates 21st Annual ‘Armour Day’ with Community Service Across the City Of Baltimore\
Under Armour employees come together for the purpose of community service to positively...](https://about.underarmour.com/en/stories/2025/09/under-armour-s-celebrates-21st-annual--armour-day--with-communit.html)
[
\
UA Next All-America Game Announces 2025 Rosters; GameChanger Named Official Live Streaming, Highlights, Scorekeeping and Stats Partner\
Baseball Factory and Under Armour announce the final rosters for the 2025 UA Next All-A...](https://about.underarmour.com/en/stories/2025/09/ua-next-all-america-game-announces-2025-rosters.html)
[
\
Under Armour X Mansory Collaboration Launches With a Face-Off Between Two Football Icons\
Under Armour’s much anticipated collaboration with luxury automotive customizer Mansory...](https://about.underarmour.com/en/stories/2025/09/under-armour-x-mansory-collaboration-launches-with-a-face-off-be.html)
[
\
Under Armour Launches “We Are Football,” a Global Salute to the Players and Communities Powering the Game\
A landmark campaign that celebrates the athletes and energy defining the game today. Bu...](https://about.underarmour.com/en/stories/2025/09/under-armour-launches--we-are-football---a-global-salute-to-the-.html)
[
\
Curry Brand Unleashes the Fox 2\
As one of the fastest players in the NBA, De’Aaron Fox needs a sneaker that can keep up...](https://about.underarmour.com/en/stories/2025/08/curry-brand-unleashes-the-fox-2.html)
[
\
Under Armour launches ‘Be The Problem’ football campaign\
Live in the UK, France, and Spain starting August 15, Under Armour’s Be The Problem cam...](https://about.underarmour.com/en/stories/2025/08/under-armour-launches--be-the-problem--football-campaign.html)
[
\
Premier League Champion Ibrahima Konaté Joins Under Armour as the Brand’s Latest Football Signing\
A commanding starter in Liverpool’s championship-winning backline and vice-captain of t...](https://about.underarmour.com/en/stories/2025/08/premier-league-champion-ibrahima-konate-joins-under-armour-as-th.html)
[
\
Tini Stoessel Joins Under Armour, Championing a New Era of Performance and Self-Expression\
Under Armour has announced a dynamic new partnership with Argentinian pop sensation Tin...](https://about.underarmour.com/en/stories/2025/08/tini-stoessel-joins-under-armour--championing-a-new-era-of-perfo.html)
[
\
Christo Lamprecht Claims First Professional Victory at Pinnacle Bank Championship\
Christo Lamprecht’s rise in professional golf has hit a major milestone. With a dramati...](https://about.underarmour.com/en/stories/2025/08/christo-lamprecht-claims-first-professional-victory-at-pinnacle-.html)
[
\
Introducing The Series 7: The Future of Basketball Performance Footwear\
The first of its kind “super shoe” from Curry Brand brings next-level performance to th...](https://about.underarmour.com/en/stories/2025/08/introducing-the-series-7--the-future-of-basketball-performance-f.html)
[
\
Mikel Arteta joins Under Armour as a Global Ambassador\
One of the game’s top managers is set to bring his unique leadership and world-class kn...](https://about.underarmour.com/en/stories/2025/08/mikel-arteta-joins-under-armour-as-a-global-ambassador.html)
[
\
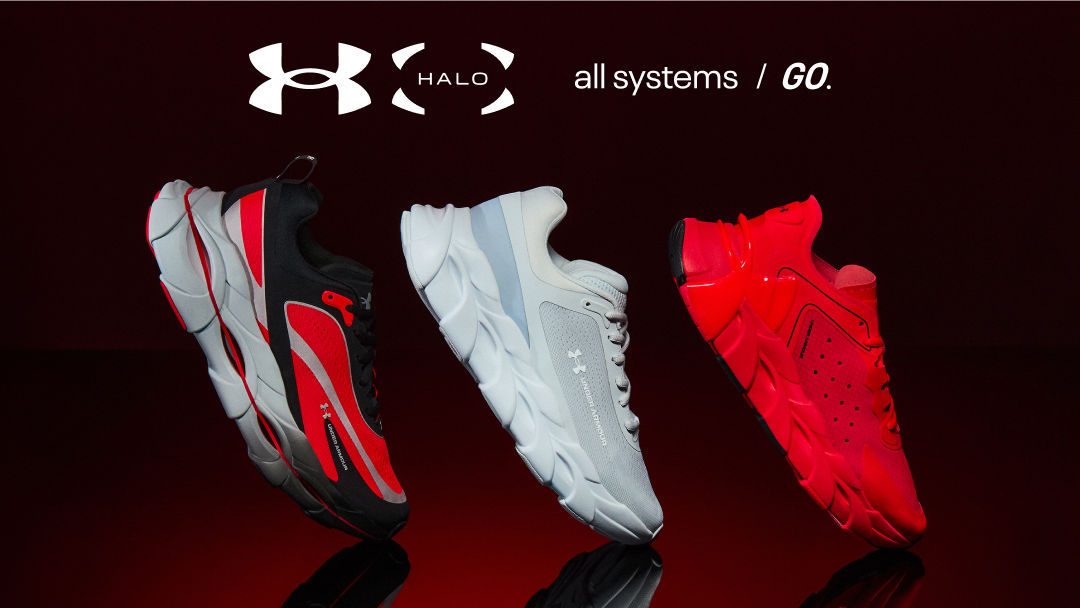
Under Armour Launches UA HALO\
Built for the everyday athlete, UA HALO introduces a holistic approach to performance, ...](https://about.underarmour.com/en/stories/2025/07/ua-halo-launch.html)
[
\
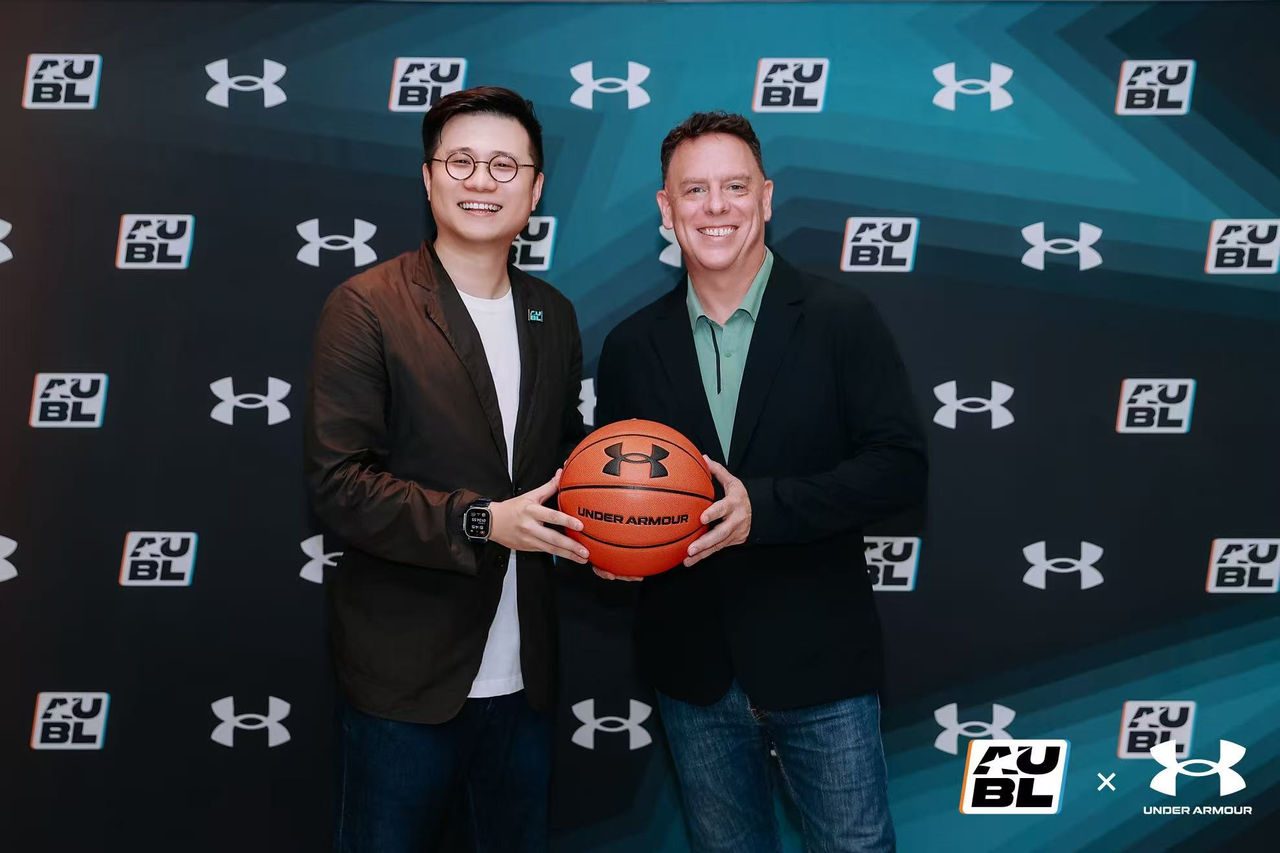
Asian University Basketball League (AUBL) Announces Under Armour as Its Official Performance Outfitter and Game Ball Partner\
The Asian University Basketball League (the AUBL) has announced a landmark partnership ...](https://about.underarmour.com/en/stories/2025/07/asian-university-basketball-league--aubl--announces-under-armour.html)
[
\
Under Armour Launches UA SOLA\
Under Armour introduces UA SOLA, it blends sport heritage with street-smart style, deli...](https://about.underarmour.com/en/stories/2025/07/under-armour-launches-ua-sola.html)
[
\
Under Armour Welcomes Coach RAC as Newest Brand Ambassador\
Under Armour is proud to welcome RobertAnthony Cruz – better known as Coach RAC – to it...](https://about.underarmour.com/en/stories/2025/07/under-armour-welcomes-coach-rac-as-newest-brand-ambassador.html)
[
\
Under Armour & Curry Brand Announce Curry Brand World Tour\
Under Armour and Curry Brand today announce their marquee basketball initiative of the ...](https://about.underarmour.com/en/stories/2025/07/under-armour---curry-brand-announce-curry-brand-world-tour.html)
[
\
[
\
Toni Rüdiger Teases Under Armour X Mansory Collaboration in Football with Iconic Magnetico Elite 5 Boots at Fifa Club World Cup\
UA athlete and Real Madrid’s centre-back Toni Rüdiger debuted Under Armour’s collaborat...](https://about.underarmour.com/en/stories/2025/06/toni-ruediger-teases-under-armour-x-mansory-collaboration-in-foo.html)
[
\
Under Armour Partners with the Chinese Rugby Football Association to Support Rugby and Flag Football Development in China\
Under Armour today announced a significant long-term partnership with the Chinese Rugby...](https://about.underarmour.com/en/stories/2025/06/under-armour-partners-with-the-chinese-rugby-football-associatio.html)
[
\
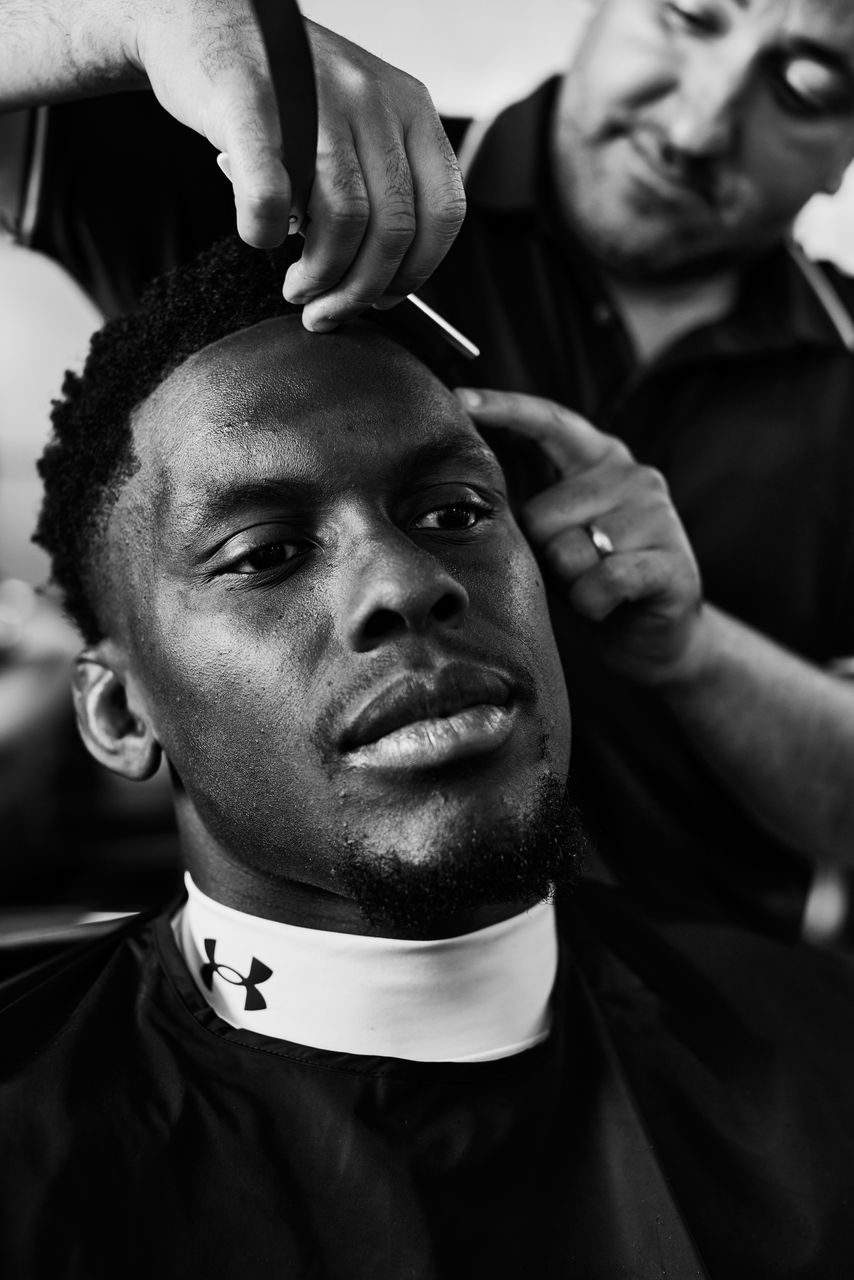
Maro Itoje Heads to the Barber as He Prepares to Captain the British & Irish Lions\
Having already been named Saracens and England captain in the last 12 months, Maro has ...](https://about.underarmour.com/en/stories/2025/06/maro-itoje-heads-to-the-barber-as-he-prepares-to-captain-the-b.html)
[
\
Where Goals Begin: Jayde Riviere Hosts the Next Generation\
Manchester United defender and Canadian Olympic Gold medalist Jayde Riviere returned ho...](https://about.underarmour.com/en/stories/2025/06/where-goals-begin--jayde-riviere-hosts-the-next-generation.html)
[
\
Justin Jefferson and Under Armour Team Up and Take Off at Inaugural Flight School\
Born out of a shared commitment to developing the next generation of athletes and provi...](https://about.underarmour.com/en/stories/2025/06/justin-jefferson-and-under-armour-team-up-and-take-off-at-inaugu.html)
[
\
Curry Brand Adds Chinese Basketball Player Jacob Zhu\
Today Curry Brand is excited to announce it has inked an NIL partnership with rising Ch...](https://about.underarmour.com/en/stories/2025/06/curry-brand-adds-chinese-basketball-player-jacob-zhu.html)
[
\
Duo of Next-Gen Footballers Join Under Armour Roster\
Under Armour reinforces its commitment to the next generation of football talent with t...](https://about.underarmour.com/en/stories/2025/06/duo-of-next-gen-footballers-join-under-armour-roster-.html)
[
\
Under Armour Underscores Commitment to Team Sports with Strategic Uniform Licensees\
Under Armour announced the expansion of its longtime wholesale partnership with BSN SPO...](https://about.underarmour.com/en/stories/2025/06/under-armour-underscores-commitment-to-team-sports-with-strategi.html)
[
\
World Game’s Gold Medalist Diana Flores and Under Armour Strengthen Flag Football in Mexico\
Under Armour and Diana Flores made history once again with the return of the UA Next Ca...](https://about.underarmour.com/en/stories/2025/05/world-game-s-gold-medalist-diana-flores-and-under-armour-strengt.html)
[
\
Comerse Al Rival\
Ahead of El Clásico, Under Armour’s roster of top talent at FC Barcelona; Ferran Torres...](https://about.underarmour.com/en/stories/2025/05/comerse-al-rival.html)
[
\
Introducing the No Weigh Backpack\
For years, athletes have carried the same burden – and we are not talking about expecta...](https://about.underarmour.com/en/stories/2025/04/introducing-the-no-weigh-backpack.html)
[
\
Where Dawgs Are Made: Kelsey Plum Hosts Third Annual Dawg Class\
Under Armour and 2x WNBA Champion Kelsey Plum wrapped another electric edition of Dawg ...](https://about.underarmour.com/en/stories/2025/04/where-dawgs-are-made--kelsey-plum-hosts-third-annual-dawg-class.html)
[
\
Sharon Lokedi Returns to The Boston Podium\
On one of the most demanding courses in competitive distance running, Sharon Lokedi did...](https://about.underarmour.com/en/stories/2025/04/sharon-lokedi-returns-to-the-boston-podium.html)
[
\
Under Armour Signs Next Wave of Football Elite Ahead of 2025 NFL Draft\
Under Armour proudly announces the next era of elite football talent as the brand doubl...](https://about.underarmour.com/en/stories/2025/04/under-armour-signs-next-wave-of-football-elite-ahead-of-2025-nfl.html)
[
\
Under Armour Empowers Women with New Courtside Collection – Born from Sport and Twisted for Culture\
Sport isn’t just about competition—it’s a way of life. It fuels confidence, inspires in...](https://about.underarmour.com/en/stories/2025/04/under-armour-women-courtside-collection.html)
[
\
Under Armour and Unless Debut Regenerative Sportswear Collection at Milan Design Week\
Under Armour and UNLESS spearhead a transformative shift in the sportswear industry by ...](https://about.underarmour.com/en/stories/2025/04/under-armour-and-unless-debut-regenerative-sportswear-collection.html)
[
\
Under Armour Enters a New Era with UA ECHO\
Under Armour is known for its relentless pursuit of performance innovation, creating ge...](https://about.underarmour.com/en/stories/2025/04/ua-echo.html)
[
\
Under Armour signs world-class right-back Achraf Hakimi\
Under Armour continues to make waves in football with the signing of Paris Saint-Germai...](https://about.underarmour.com/en/stories/2025/04/under-armour-signs-world-class-right-back-achraf-hakimi.html)
[
\
Under Armour Powers Into the 2025 Majors Season with Elite Talent and Game-Changing Innovation\
As the golf world eagerly anticipates the start of the 2025 majors season, Under Armour...](https://about.underarmour.com/en/stories/2025/04/under-armour-powers-into-the-2025-majors-season-with-elite-talen.html)
[
\
Deep Range, Big Dreams: Eli Ellis Joins the Under Armour Family\
Under Armour is proud to officially welcome Eli Ellis, a sharpshooting standout with un...](https://about.underarmour.com/en/stories/2025/03/deep-range--big-dreams--eli-ellis-joins-the-under-armour-family.html)
[
\
National Football League Announces Under Armour as an Official Footwear and Glove Partner\
Under Armour and the National Football League today announced a long-term partnership, ...](https://about.underarmour.com/en/stories/2025/03/national-football-league-announces-under-armour-as-an-official-f.html)
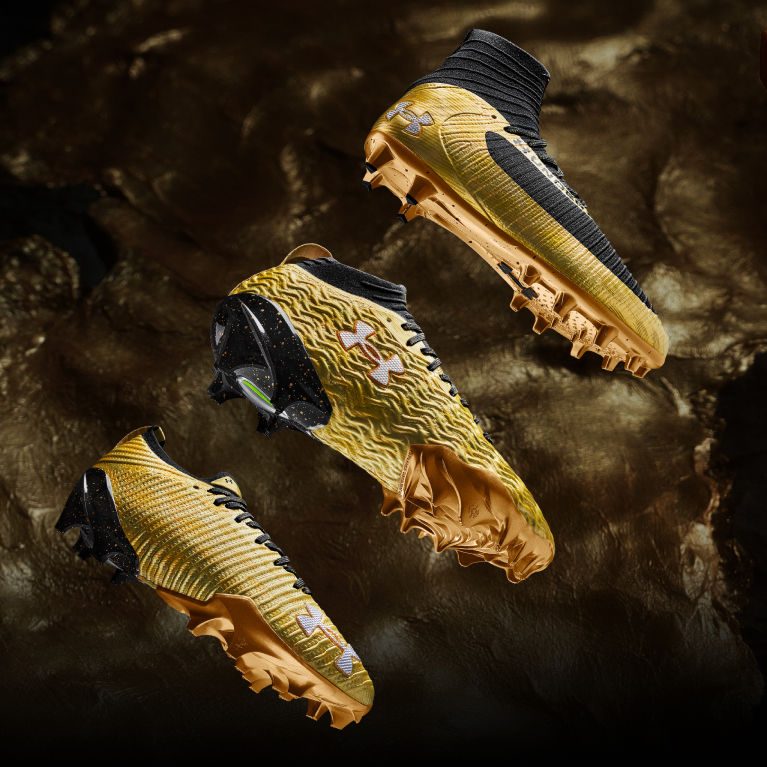
[
\
Under Armour Unveils the GLDN CHLD\
Get ready to shine on and off the field. Under Armour has unveiled its latest innovatio...](https://about.underarmour.com/en/stories/2025/03/under-armour-unveils-the-gldn-chld.html)
[
\
Under Armour and Northwestern University Announce Extension of Partnership\
Under Armour and Northwestern University today announced the extension of their partner...](https://about.underarmour.com/en/stories/2025/03/under-armour-and-northwestern-university-announce-extension-of-p.html)
[
\
Under Armour Debuts “Let Them Talk” Campaign in partnership with RDCWorld\
Under Armour and video creator collective RDCWorld have teamed up to launch an exciting...](https://about.underarmour.com/en/stories/2025/03/under-armour-debuts--let-them-talk--campaign-in-partnership-with.html)
[
\
Significant Disparities in Sports Engagement Found Among Washington D.C. Youth\
More youth in Washington D.C. play organized sports than do so nationally, but the nati...](https://about.underarmour.com/en/stories/2025/03/significant-disparities-in-sports-engagement-found-among-washing.html)
[
\
Under Armour Announces NIL Collegiate Class of 2025 to Celebrate the Postseason\
Under Armour is thrilled to announce its NIL Collegiate Class of 2025, six of the top c...](https://about.underarmour.com/en/stories/2025/03/under-armour-announces-nil-collegiate-class-of-2025-to-celebrate.html)
[
\
Under Armour Welcomes Kieron Van Wyk to Golf Roster\
Under Armour proudly welcomes Kieron van Wyk to its elite roster of golf athletes, rein...](https://about.underarmour.com/en/stories/2025/03/-under-armour-welcomes-kieron-van-wyk-to-golf-roster--.html)
[
\
Under Armour Signs Nika Mühl\
If there’s one thing you need to know about Croatian basketball player Nika Mühl, it’s ...](https://about.underarmour.com/en/stories/2025/03/under-armour-signs-nika-muehl.html)
[
\
Under Armour and Curry Brand Celebrate a Good Weekend in the Bay\
Under Armour and Curry Brand came together to celebrate 11-time NBA All-Star and now 2-...](https://about.underarmour.com/en/stories/2025/02/under-armour-and-curry-brand-celebrate-a-good-weekend-in-the-bay.html)
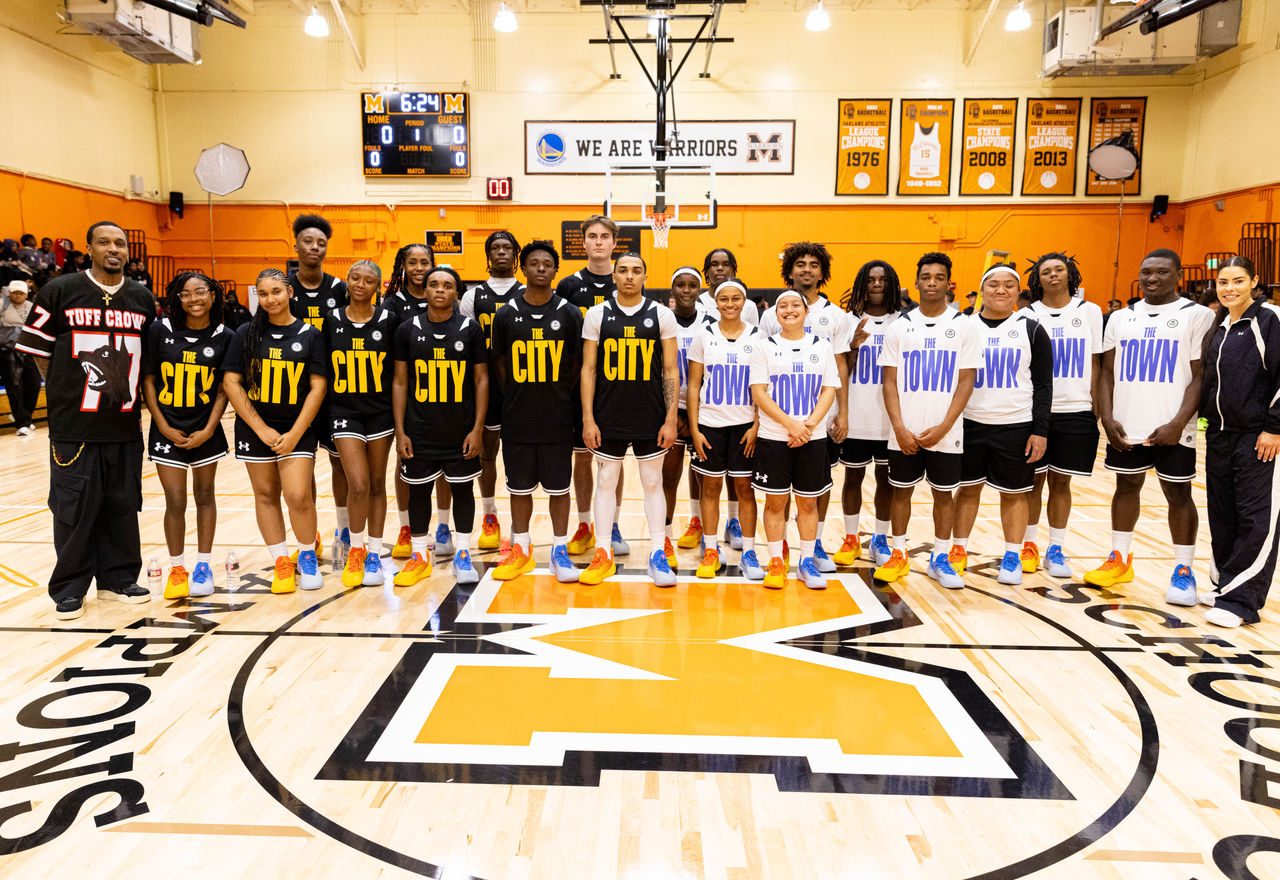
[
\
Curry Brand Makes Good on Community Impact Commitments\
This past weekend, Curry Brand celebrated its 20th court refurbishment at McClymonds Hi...](https://about.underarmour.com/en/stories/2025/02/curry-brand-makes-good-on-community-impact-commitments.html)
[
\
Justin Jefferson Gives Back to His Community in New Orleans Ahead of Super Bowl LIX\
Minnesota Vikings wide receiver and Under Armour athlete Justin Jefferson returned to h...](https://about.underarmour.com/en/stories/2025/02/justin-jefferson-gives-back-to-his-community-with-under-armour-y.html)
[
\
Under Armour Adds Rasmus Neergaard-Petersen to Golf Roster for 2025 Season\
Under Armour is proud to announce the signing of Denmark’s Rasmus Neergaard-Petersen, o...](https://about.underarmour.com/en/stories/2025/02/under-armour-adds-rasmus-neergaard-petersen-to-golf-roster.html)
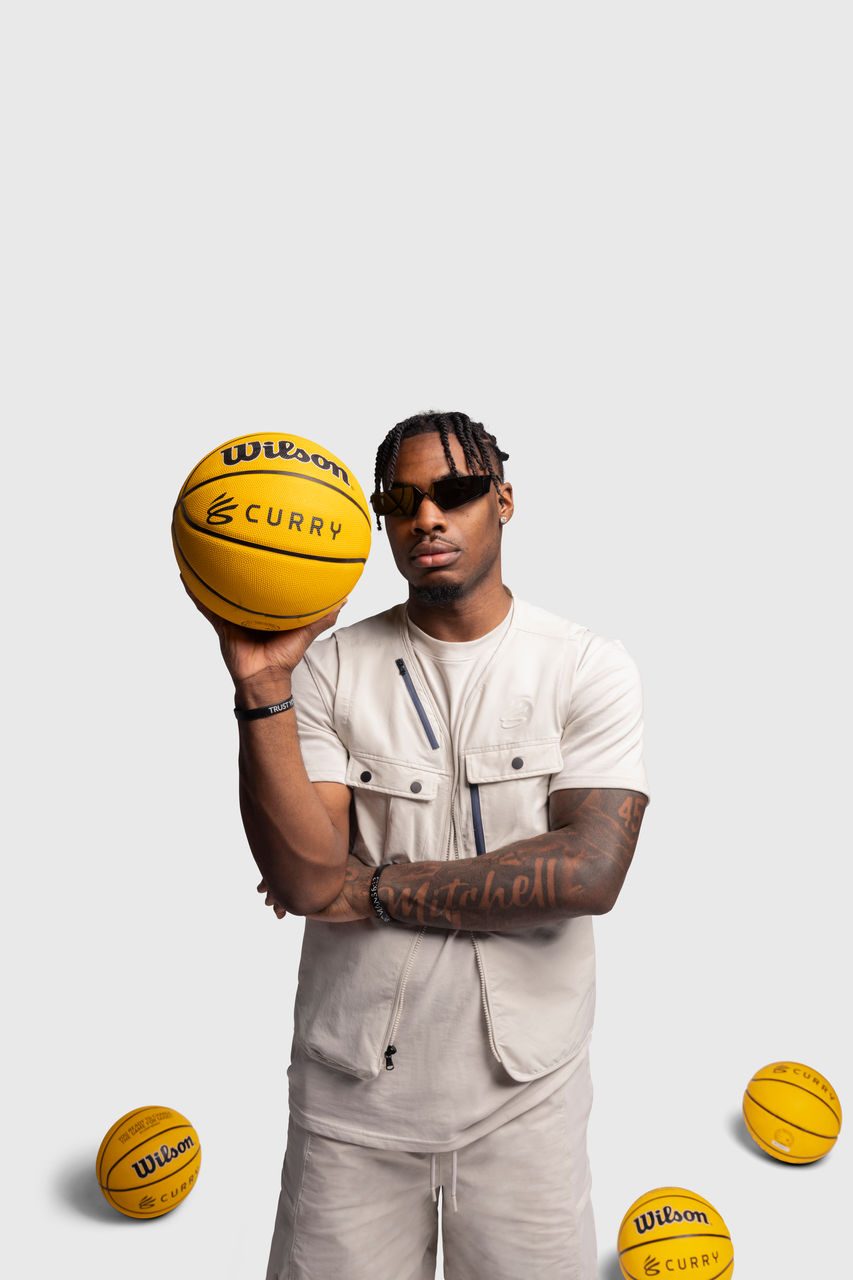
[
\
Curry Brand Welcomes Davion Mitchell to Its Athlete Roster\
Relentless. That’s the word that comes to mind when watching NBA point guard Davion Mit...](https://about.underarmour.com/en/stories/2025/02/curry-brand-welcomes-davion-mitchell-to-its-athlete-roster.html)
[
\
Under Armour and BlacktipH Announce New Partnership\
Under Armour today announced a multiyear partnership with BlacktipH, the world’s leadin...](https://about.underarmour.com/en/stories/2025/01/under-armour-and-blacktiph-announce-new-partnership.html)
[
\
Under Armour Launches Shadow 3\
Under Armour has once again raised the bar in athletic performance with the debut of th...](https://about.underarmour.com/en/stories/2025/01/under-armour-launches-shadow-3.html)
[
\
Under Armour Launches Infinite Elite 2 In Dubai\
To mark the launch of the second iteration of Under Armour’s award-winning Infinite Eli...](https://about.underarmour.com/en/stories/2025/01/under-armour-launches-infinite-elite-2-in-dubai.html)
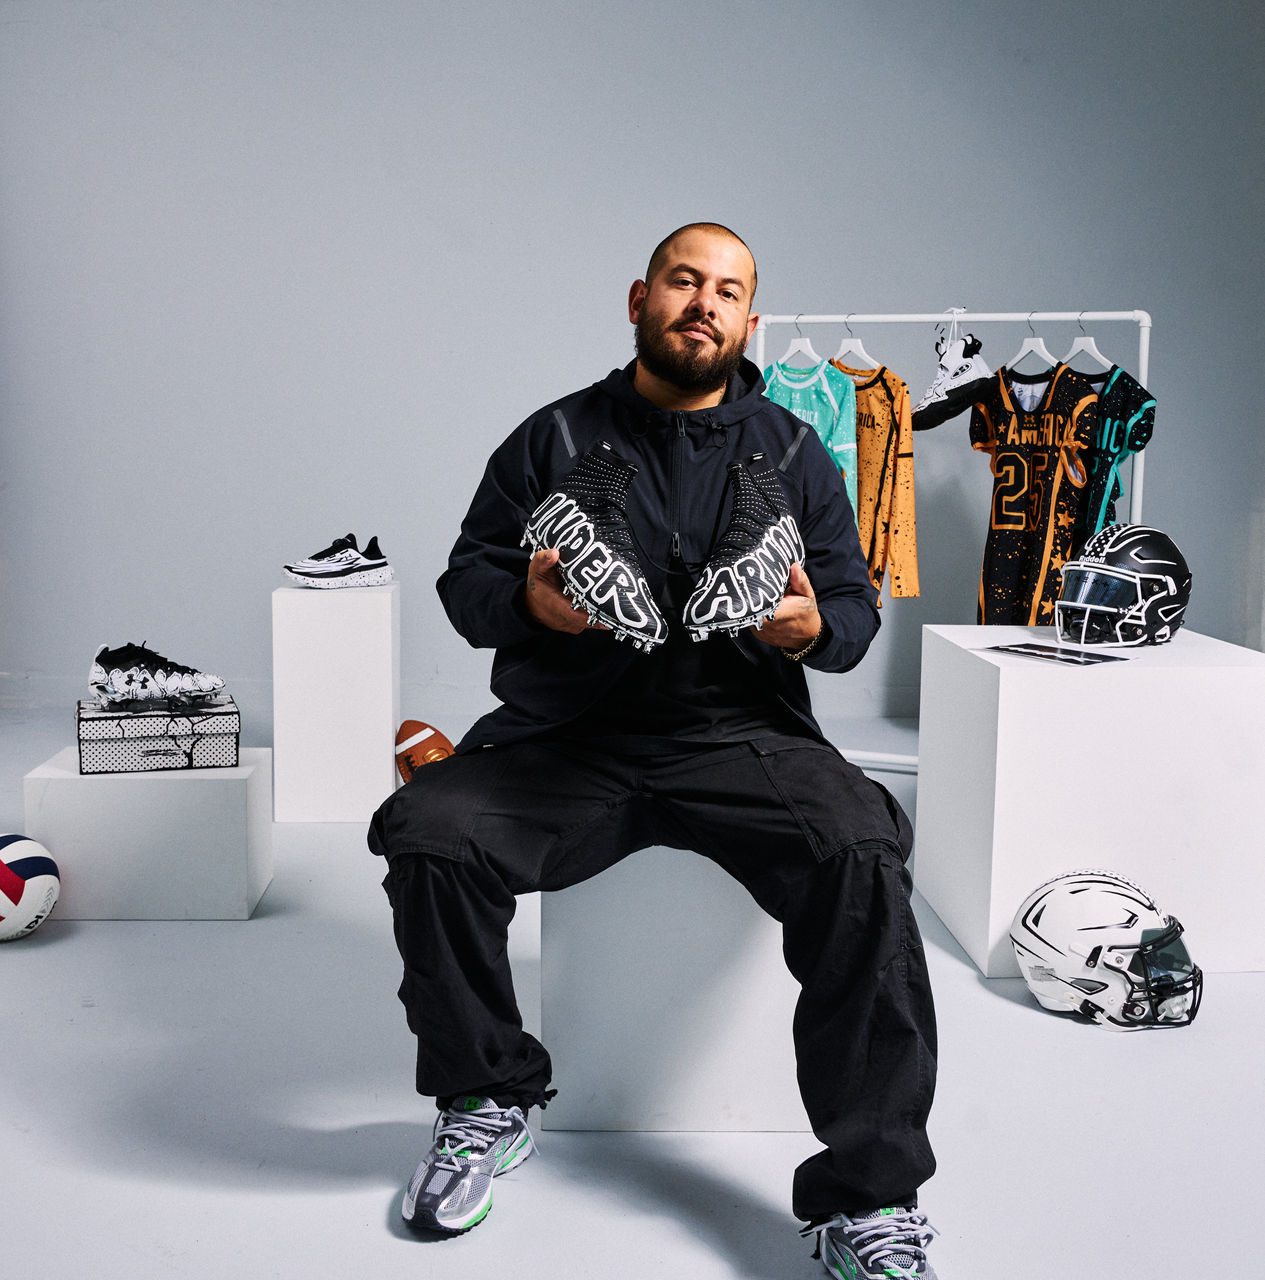
[
\
Under Armour Unveils First-Ever UA Next All-America Collaboration with Joshua Vides\
Under Armour is set to host its 17th annual UA Next All-America Game Week in Orlando, F...](https://about.underarmour.com/en/stories/2024/12/ua-next-all-america-game-week-returns-for-18th-year--.html)
[
\
Barcelona FC striker Ferran Torres Joins Under Armour’s Impressive Roster of European Football Talent\
Ferran Torres becomes the latest addition to Under Armour’s expanding list of incredibl...](https://about.underarmour.com/en/stories/2024/12/barcelona-fc-striker-ferran-torres-joins-under-armour-s-impressi.html)
[
\
Under Armour Strikes Partnership with Football Star Douglas Costa\
Leading global athletic performance brand and Sport House, Under Armour is proud to ann...](https://about.underarmour.com/en/stories/2024/12/under-armour-strikes-partnership-with-football-star-douglas-cost.html)
[
\
Rising Hip-Hop Star Lay Bankz Joins Team Under Armour\
Under Armour is making bold moves into the cultural space with its latest partnership, ...](https://about.underarmour.com/en/stories/2024/12/lay-bankz-joins-team-under-armour.html)
[
\
Investor Meeting\
An in-depth qualitative update on the Under Armour's product, brand, and commercial str...](https://about.underarmour.com/en/investors/press-releases--events---presentations/investor-meeting.html)
[
\
Under Armour and the Naval Academy Athletic Association Extend Partnership in a Multiyear Agreement\
The Naval Academy Athletic Association and Under Armour announced December 11, 2024 the...](https://about.underarmour.com/en/stories/2024/12/under-armour-and-the-naval-academy-athletic-association-extend-p.html)
[
\
Unrivaled Announces Under Armour as Its Official Uniform Partner and Performance Outfitter\
Unrivaled, the groundbreaking professional women’s basketball league, announced today a...](https://about.underarmour.com/en/stories/2024/12/unrivaled-announces-under-armour-as-its-official-uniform-partner.html)
[
\
Under Armour Celebrates Grand Opening of New Flagship Store with Kelsey Plum and Nearly 200 Baltimore Student Athletes\
The new 24,000 square-foot store is situated on the campus of the brand’s new Global He...](https://about.underarmour.com/en/stories/2024/12/under-armour-celebrates-grand-opening-of-new-flagship-store-with.html)
[
\
Curry Brand Introduces Speed that Scares with the Fox 1\
The need for speed is real in the game of basketball and no one plays with pace like Cu...](https://about.underarmour.com/en/stories/2024/11/curry-brand-introduces-speed-that-scares-with-the-fox-1.html)
[
\
Empowering the Next Generation\
Back for its third year, Jordan Thompson’s hands-on training camp returned for youth vo...](https://about.underarmour.com/en/stories/2024/11/jordan-thompson-hosts-next-generation-volleyball-players-at-ua-next-camp.html)
[
\
Sacha Boey Joins Under Armour Football Roster and Embraces the Cold in Paris\
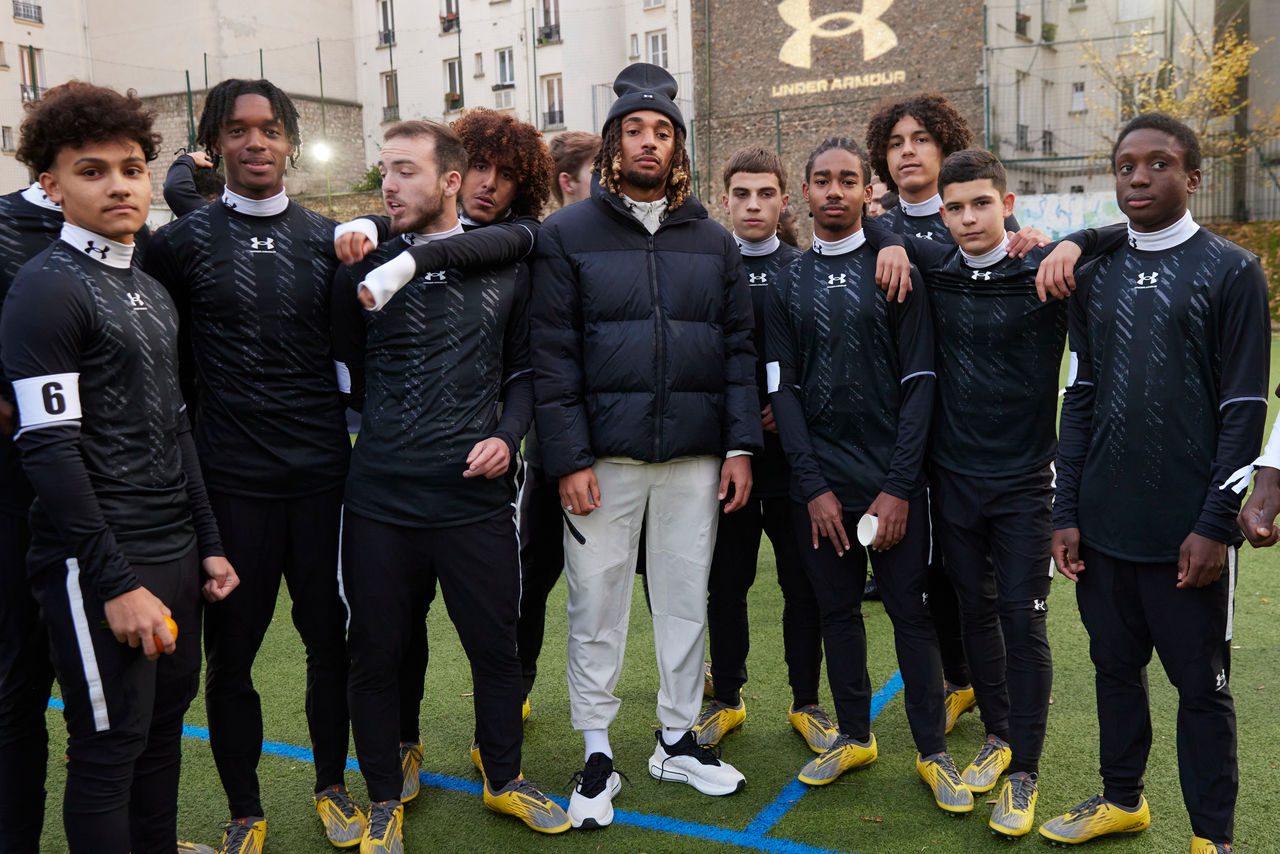
Under Armour highlighted its commitment to developing young football athletes and its ...](https://about.underarmour.com/en/stories/2024/11/sacha-boey-joins-under-armour-football-roster-and-embraces-the-c.html)
[
\
Under Armour’s Project Rock Partners With Shepherd’s Men To Support Veterans\
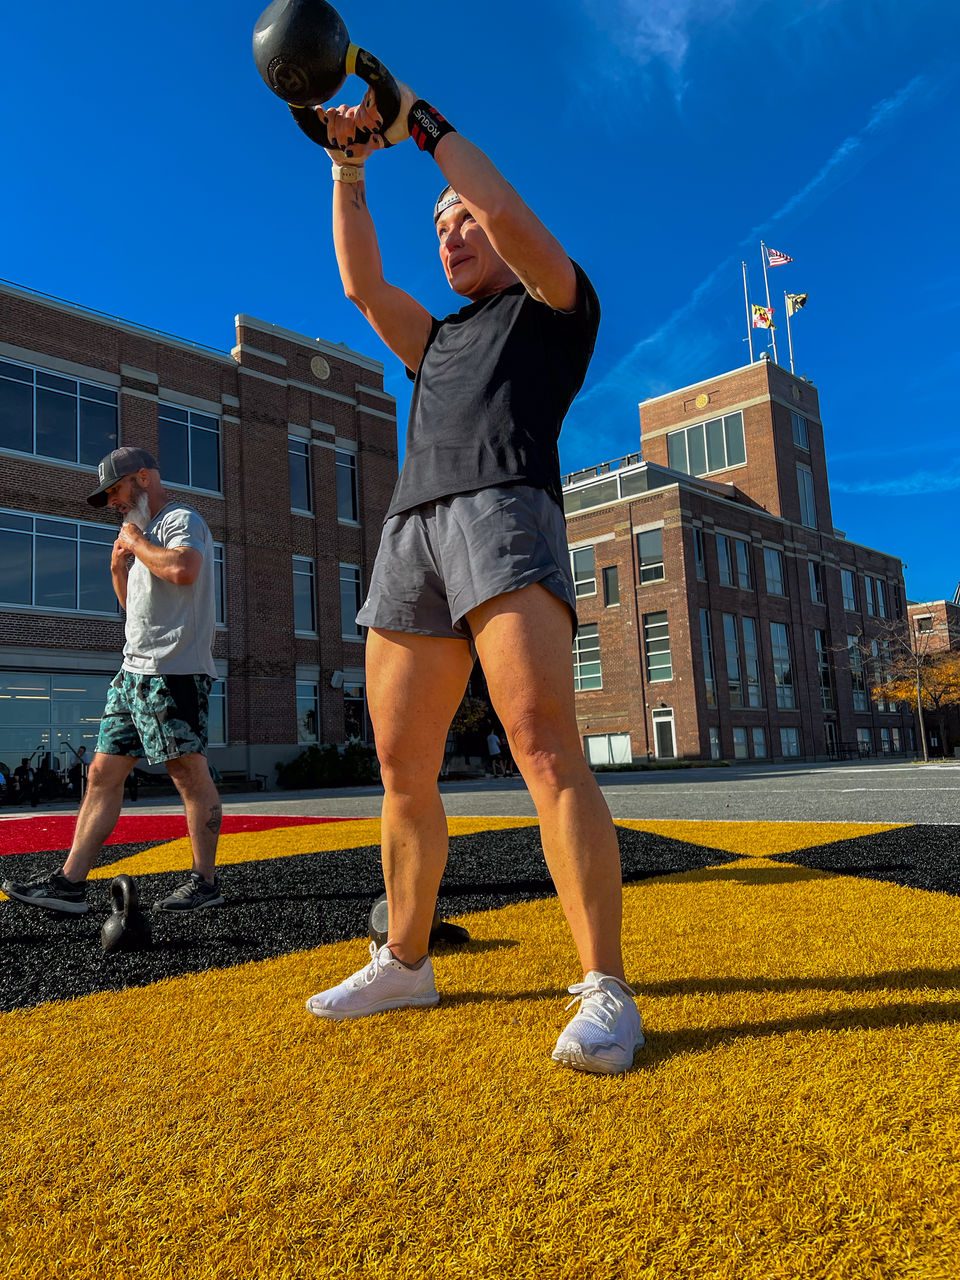
Many veterans return home with invisible injuries that aren’t easily understood or trea...](https://about.underarmour.com/en/stories/2024/11/project-rock-partners-with-shepherds-men-to-support-veterans.html)
[
\
Celebrating the Wins for Freddie Freeman\
On Wednesday, October 30, 2024, Under Armour Athlete and Los Angeles Dodger’s first bas...](https://about.underarmour.com/en/stories/2024/10/win-for-freddie-freeman.html)
[
\
Under Armour and DTLR Unveil School Spirit Rivalry Packs to Celebrate Historic Baltimore Football Tradition\
In honor of the historic and iconic local rivalry between Baltimore City College and Ba...](https://about.underarmour.com/en/stories/2024/10/UnderArmour_Dtlr_Unveil_SchoolSpirit_RivalryPacks.html)
[
\
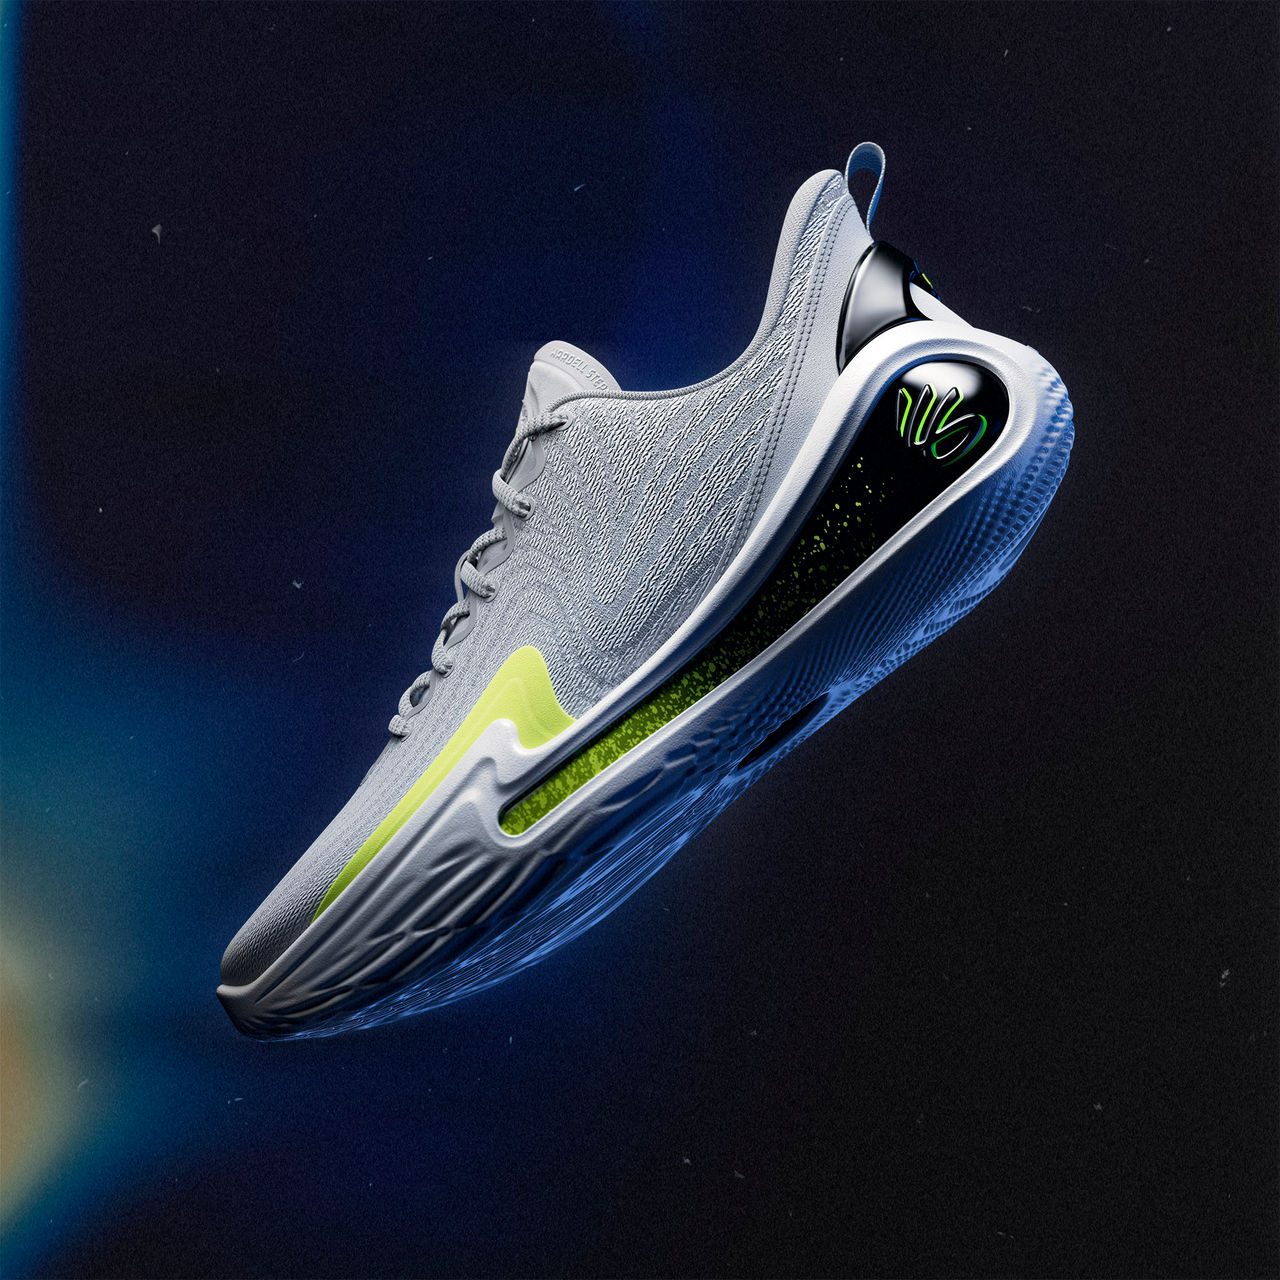
The Curry 12 Goes Global with ‘Gravity’\
Following several limited releases, Curry Brand will officially launch the Curry 12 glo...](https://about.underarmour.com/en/stories/2024/10/the-curry-12-goes-global-with--gravity--.html)
[
\
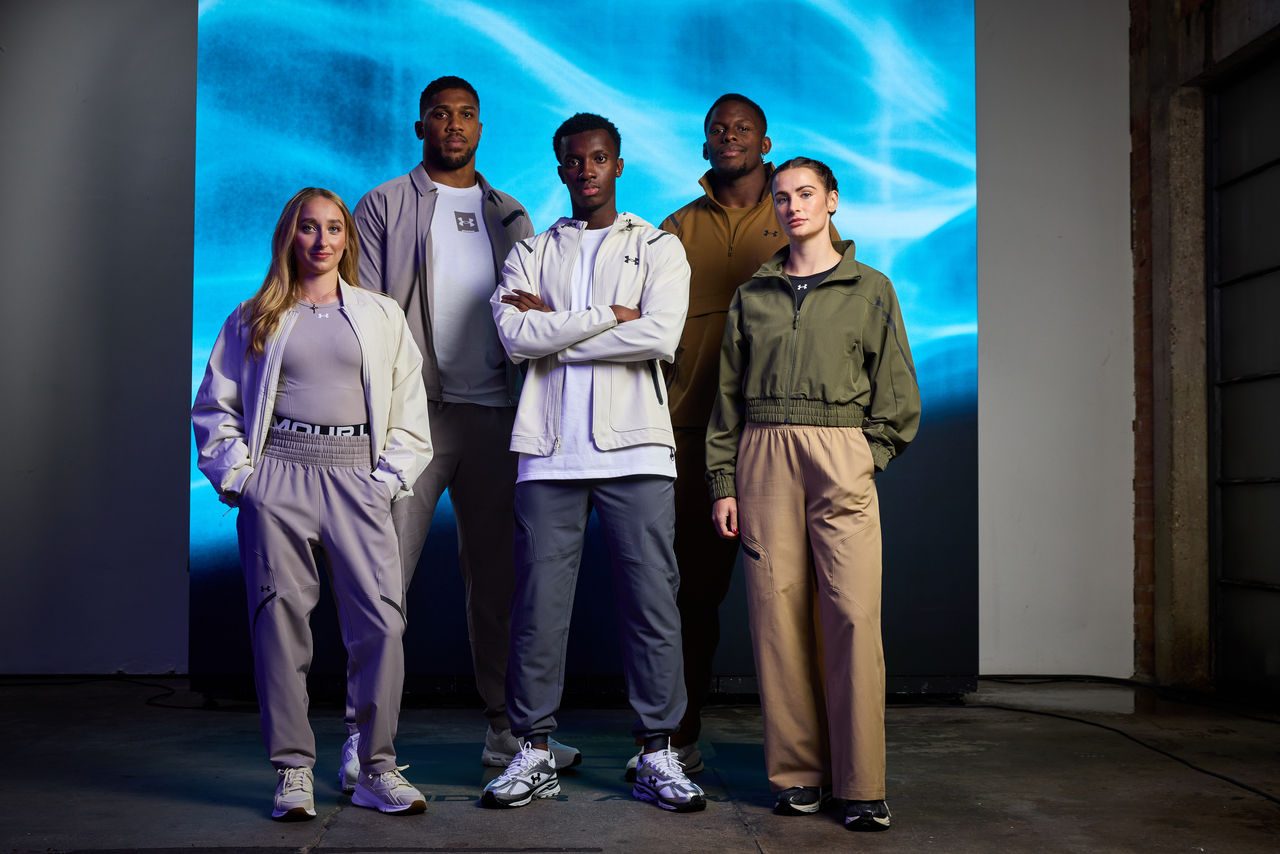
Under Armour Lands In London For The Launch Of Its Unstoppable Sportswear Range\
Under Armour continues to innovate with product solutions for the 24/7 athlete needs, t...](https://about.underarmour.com/en/stories/2024/10/under-armour-lands-in-london-for-the-launch-of-its-unstoppable-s.html)
[
\
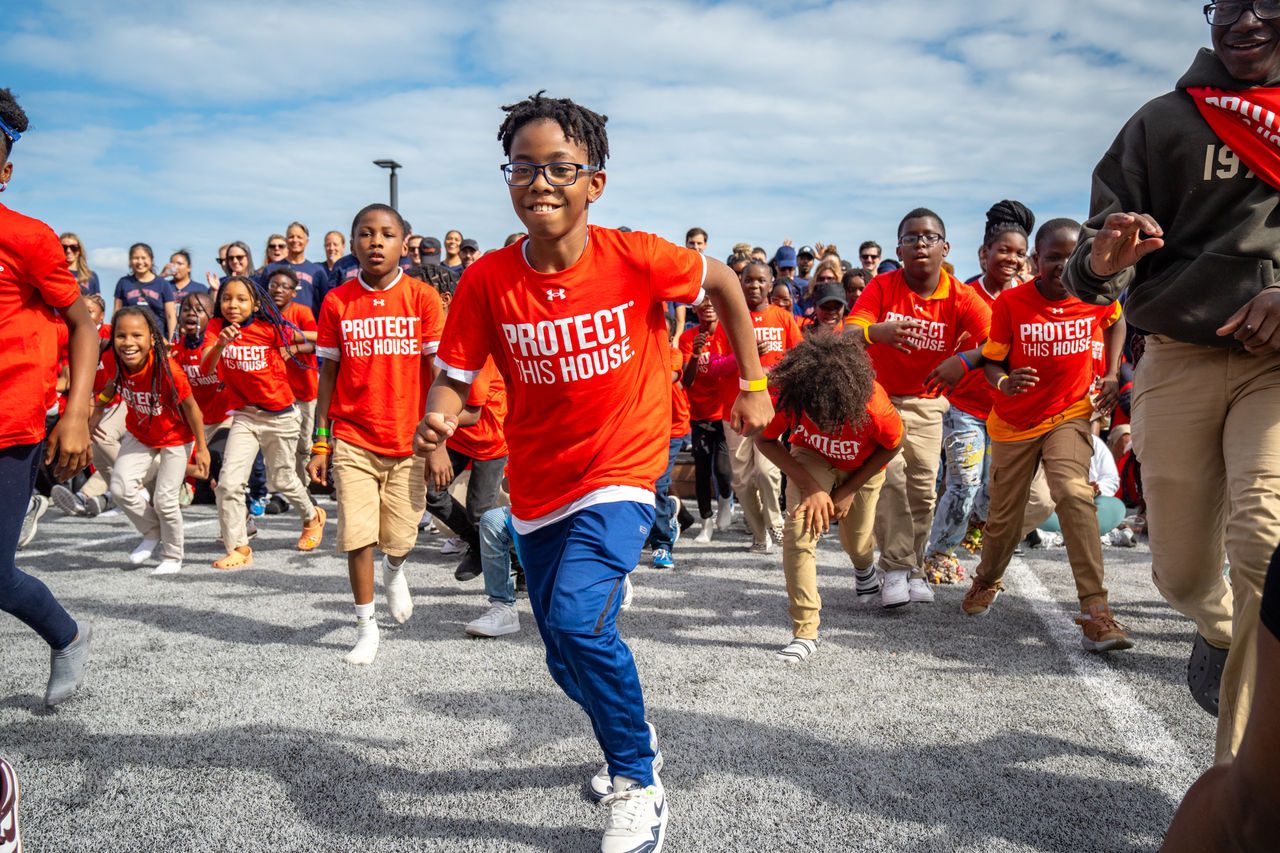
Under Armour’s 20th Annual ‘Armour Day’\
On Thursday, September 19, 2024, Under Armour marked its 20th annual Armour Day event w...](https://about.underarmour.com/en/stories/2024/09/under-armour-s-20th-annual--armour-day--observance-honors-city-o.html)
[
\
Under Armour and Jackson State University Extend Partnership Through 2029\
Under Armour has renewed its contract with Jackson State University as the official out...](https://about.underarmour.com/en/stories/2024/08/under-armour-and-jackson-state-university-extend-partnership-thr.html)
[
\
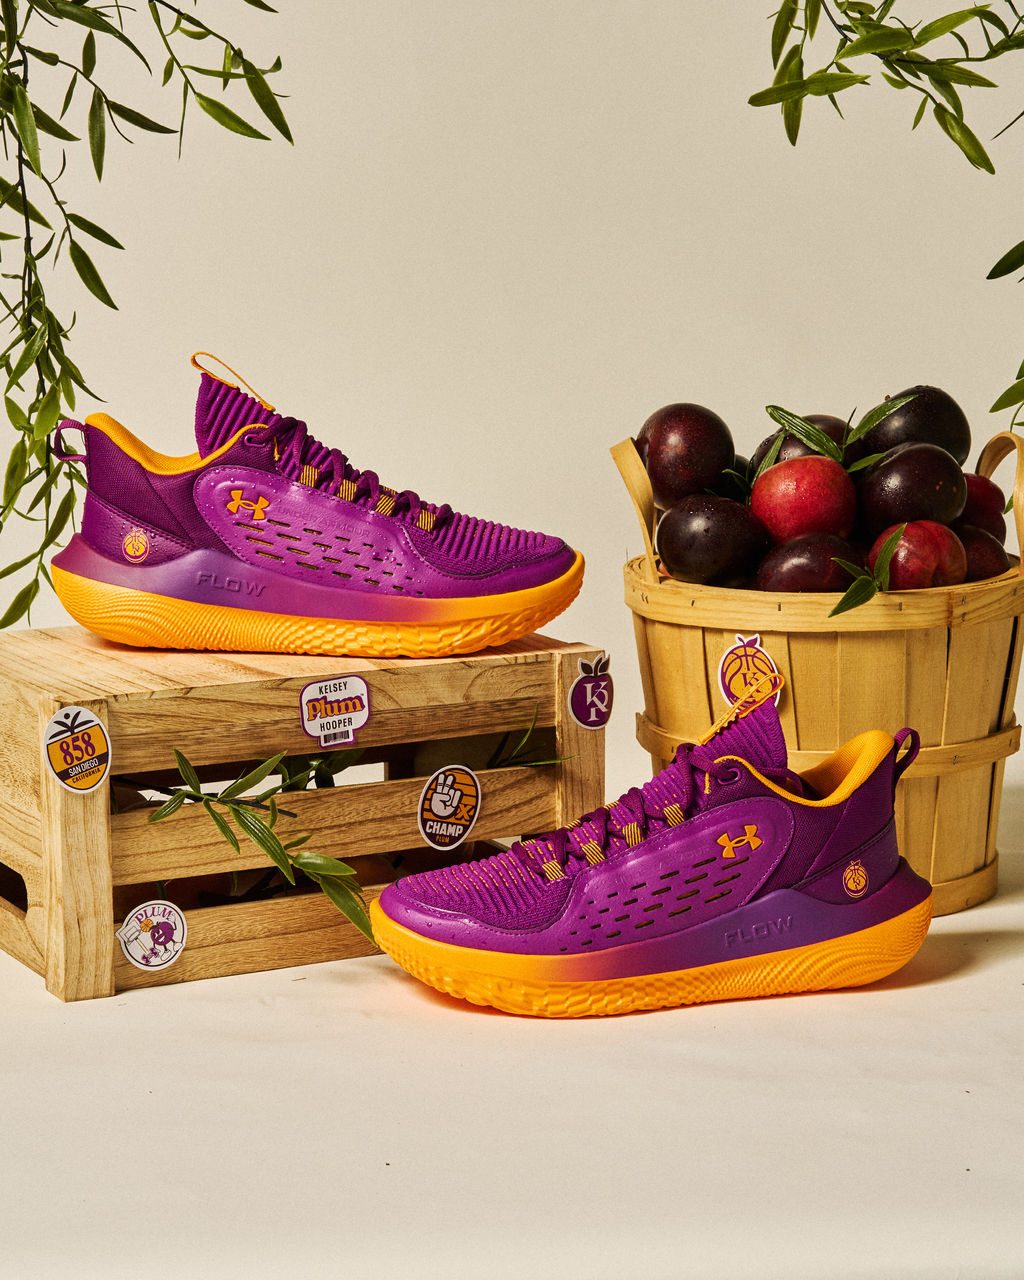
Under Armour Unveils Special Breakthru 5 Sneakers in “Plum” Colorway\
Today, Under Armour released a special limited-edition Breakthru 5 “Plum” colorway to c...](https://about.underarmour.com/en/stories/2024/08/under-armour-unveils-special-breakthru-5-sneakers-in--plum--colo.html)
[
\
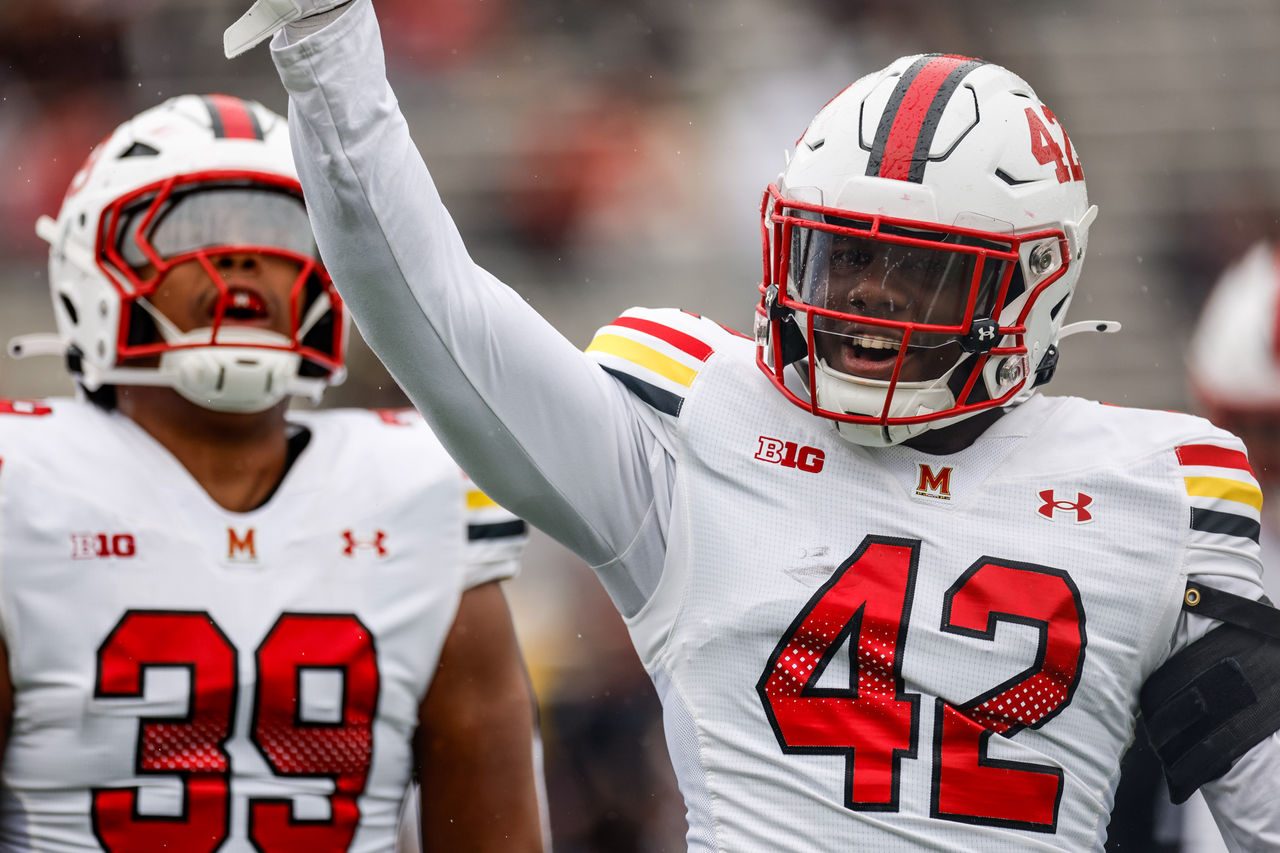
Introducing the ARMR 037 Uniform\
Introducing the ARMR 037 uniform, the brand’s most innovative American football design ...](https://about.underarmour.com/en/stories/2024/08/introducing-the-armr-037-uniform.html)
[
\
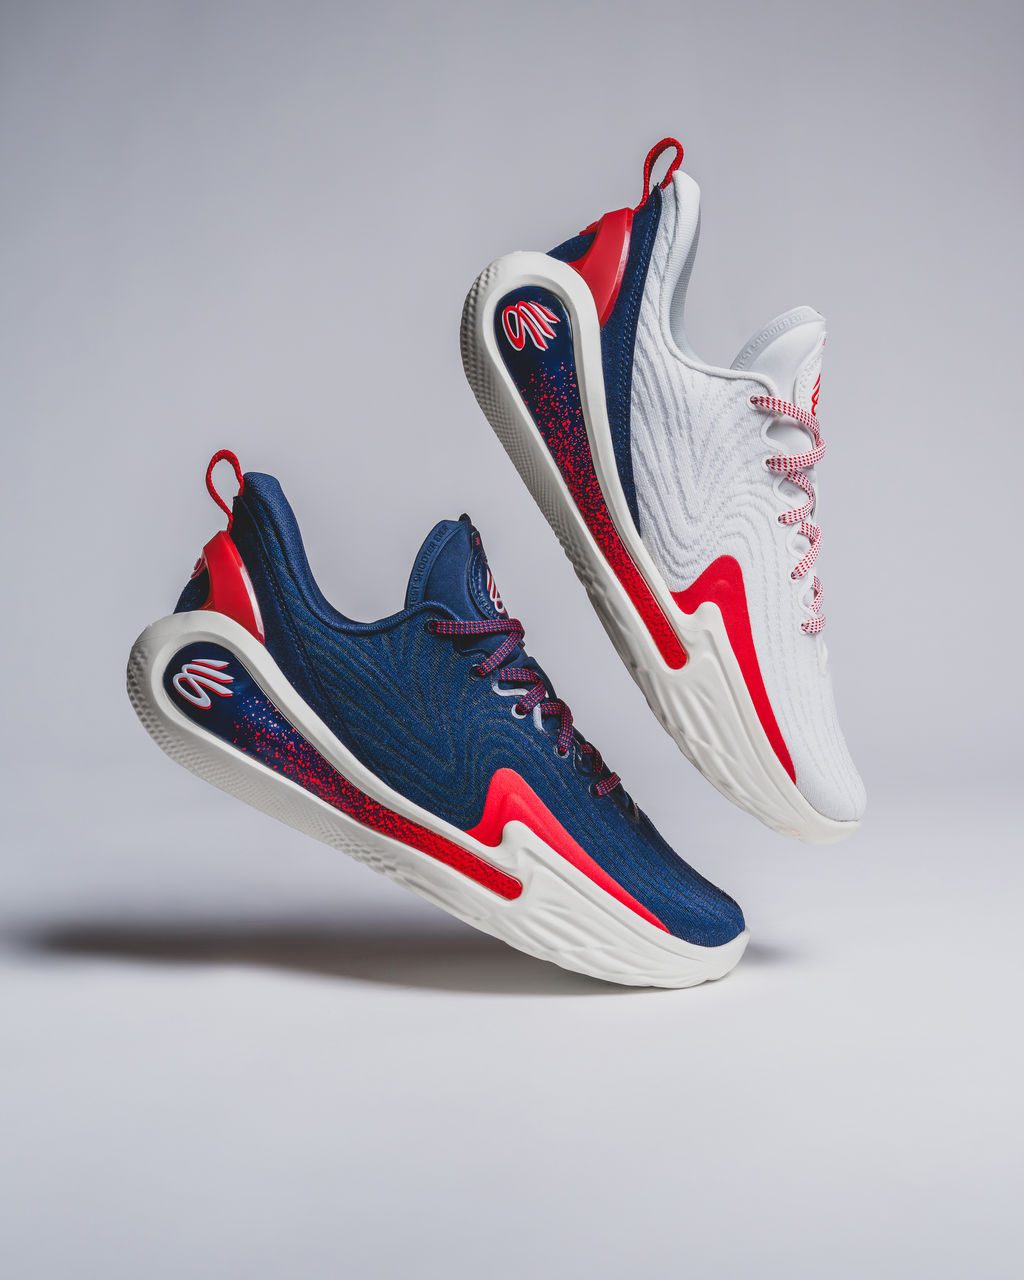
The Future Just Got Better – The Curry 12 Has Arrived\
The Curry 12 has arrived – ready to propel Stephen to peak performance in the next chap...](https://about.underarmour.com/en/stories/2024/08/the-future-just-got-better---the-curry-12-has-arrived-.html)
[
\
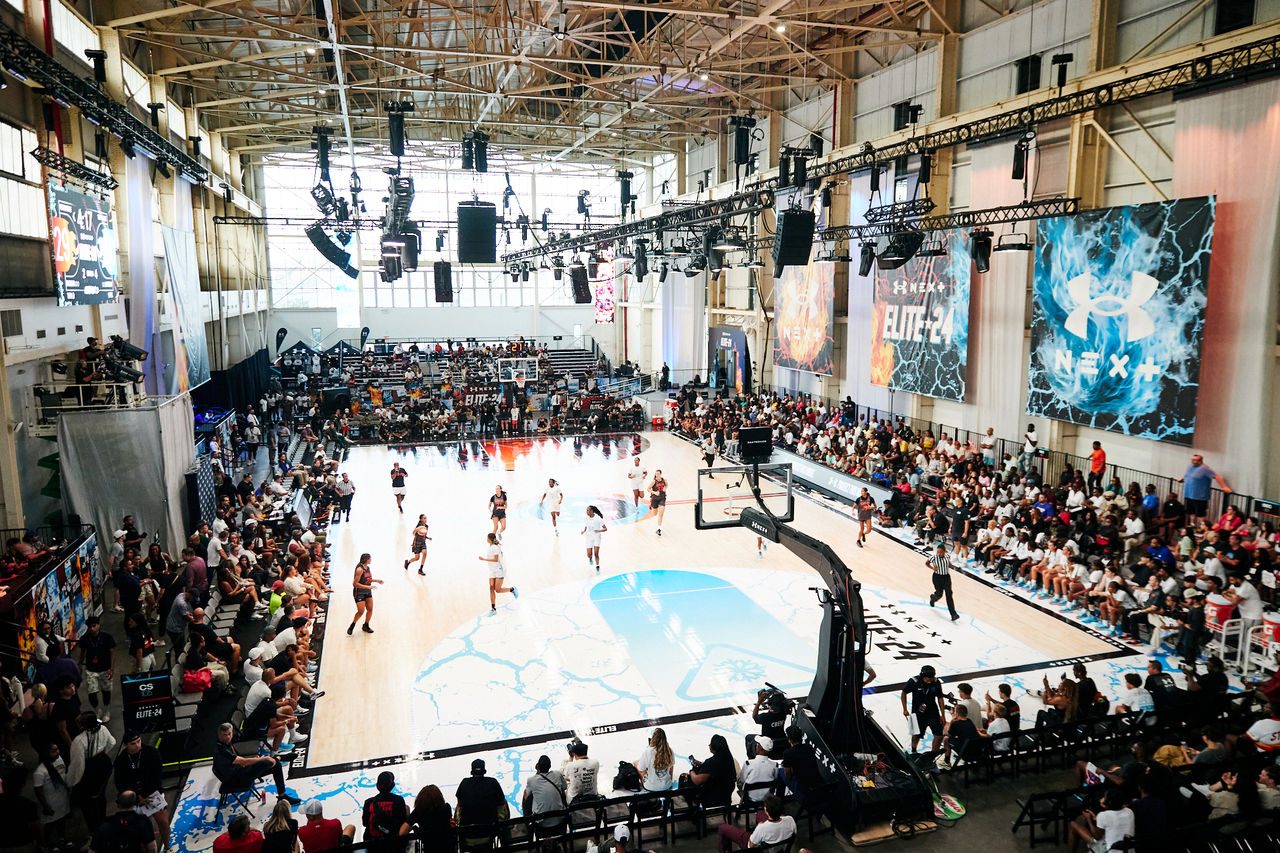
Elite 24 Showcases the World’s Next Generation of Basketball Stars\
On August 10, Under Armour returned to New York for the first time since 2016 to host i...](https://about.underarmour.com/en/stories/2024/08/elite-24-showcases-the-world-s-next-generation-of-basketball-sta.html)
[
\
Under Armour Announces Eric Liedtke as Executive Vice President of Brand Strategy\
Under Armour, Inc. today announced that Eric Liedtke will join the company as Executiv...](https://about.underarmour.com/en/stories/2024/08/under-armour-announces-eric-liedtke-as-executive-vice-president-.html)
[
\
Rising Golf Star Christo Lamprecht Joins The Under Armour Family\
The world of golf is buzzing about Christo Lamprecht. The 23-year-old golfer from South...](https://about.underarmour.com/en/stories/2024/08/rising-golf-star-christo-lamprecht-joins-the-under-armour-family.html)
[
\
Under Armour Introduces UA Unstoppable\
Under Armour has embarked on a new era of sportswear with its evolved collection, Unsto...](https://about.underarmour.com/en/stories/2024/07/under-armour-introduces-ua-unstoppable.html)
[
\
Gear Up To Go Low With Under Armour's Latest Golf Collection\
This summer, Under Armour is putting a modern twist on the golf classics with the relea...](https://about.underarmour.com/en/stories/2024/07/gear-up-to-go-low-with-under-armour-s-latest-golf-collection.html)
[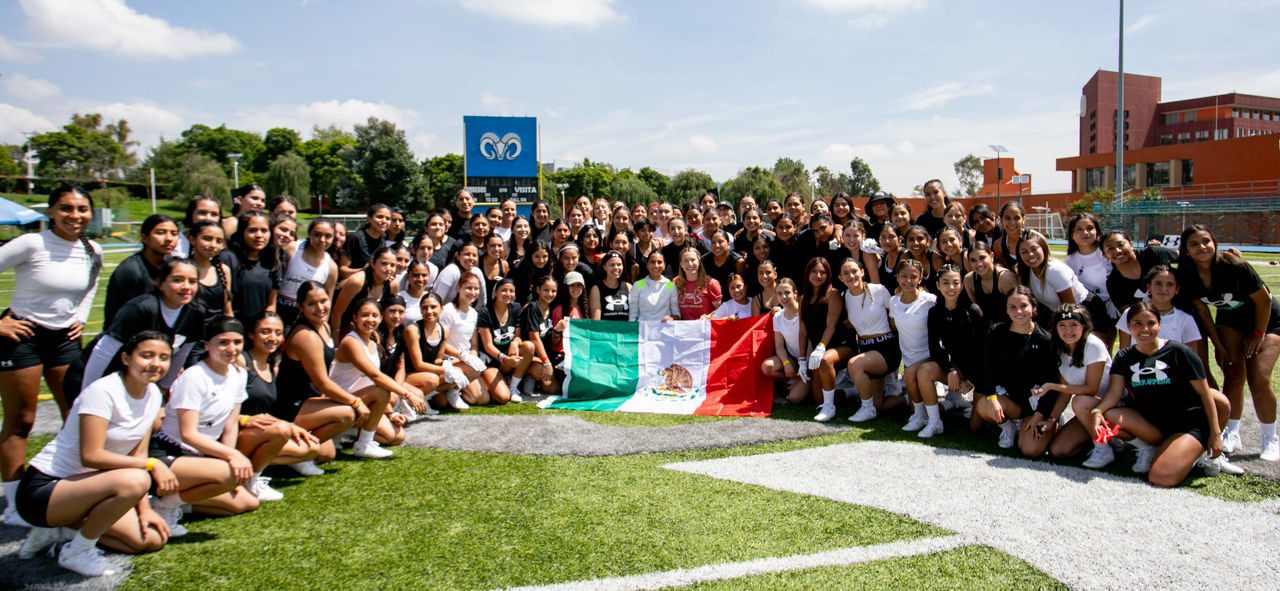
\
Under Armour and Diana Flores Make History with Groundbreaking Flag Football Camp in Mexico\
Under Armour and UA Next have reached a significant milestone in youth sports in Mexico...](https://about.underarmour.com/en/stories/2024/07/under-armour-and-diana-flores-make-history-with-groundbreaking-f.html)
[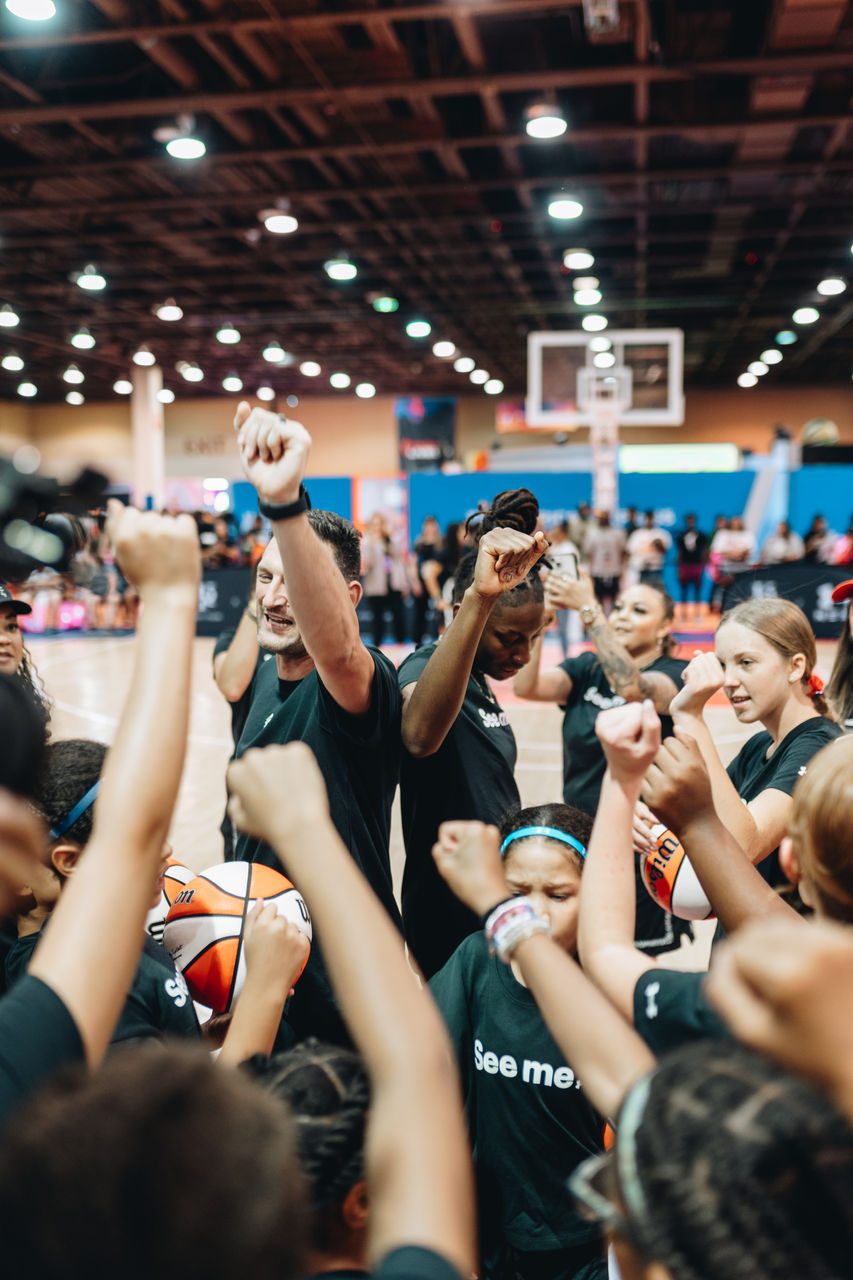
\
Under Armour Basketball Celebrates Female Representation at the 2024 WNBA All-Star Weekend in Phoenix\
This year at the WNBA All-Star, Under Armour made sure a group of local middle school g...](https://about.underarmour.com/en/stories/2024/07/under-armour-basketball-celebrates-female-representation-at-the-.html)
[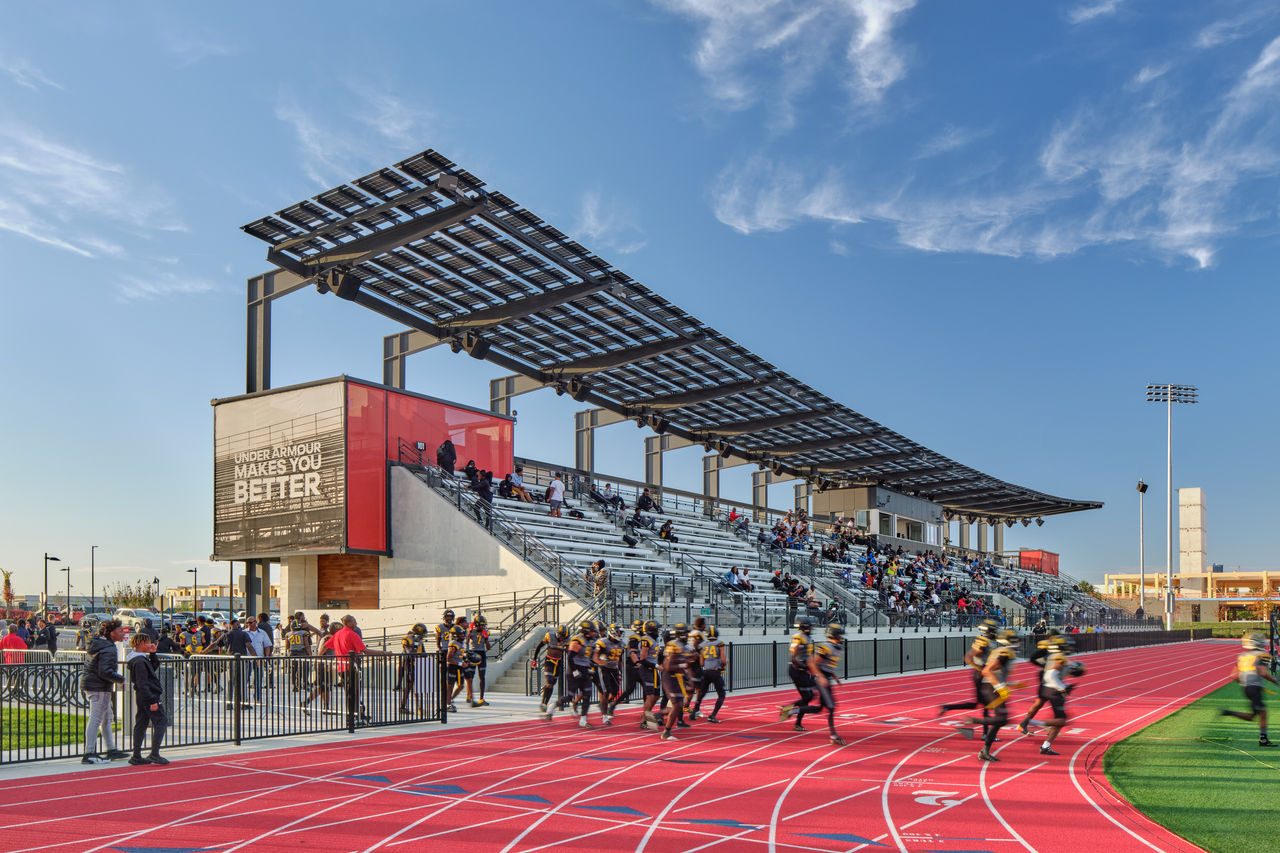
\
Under Armour Hosting Free Event for Baltimore City Student Athletes on August 3\
On Saturday, August 3, Under Armour and Project Rampart are hosting a community event a...](https://about.underarmour.com/en/stories/2024/07/under-armour-hosting-free-event-for-baltimore-city-student-athle.html)
[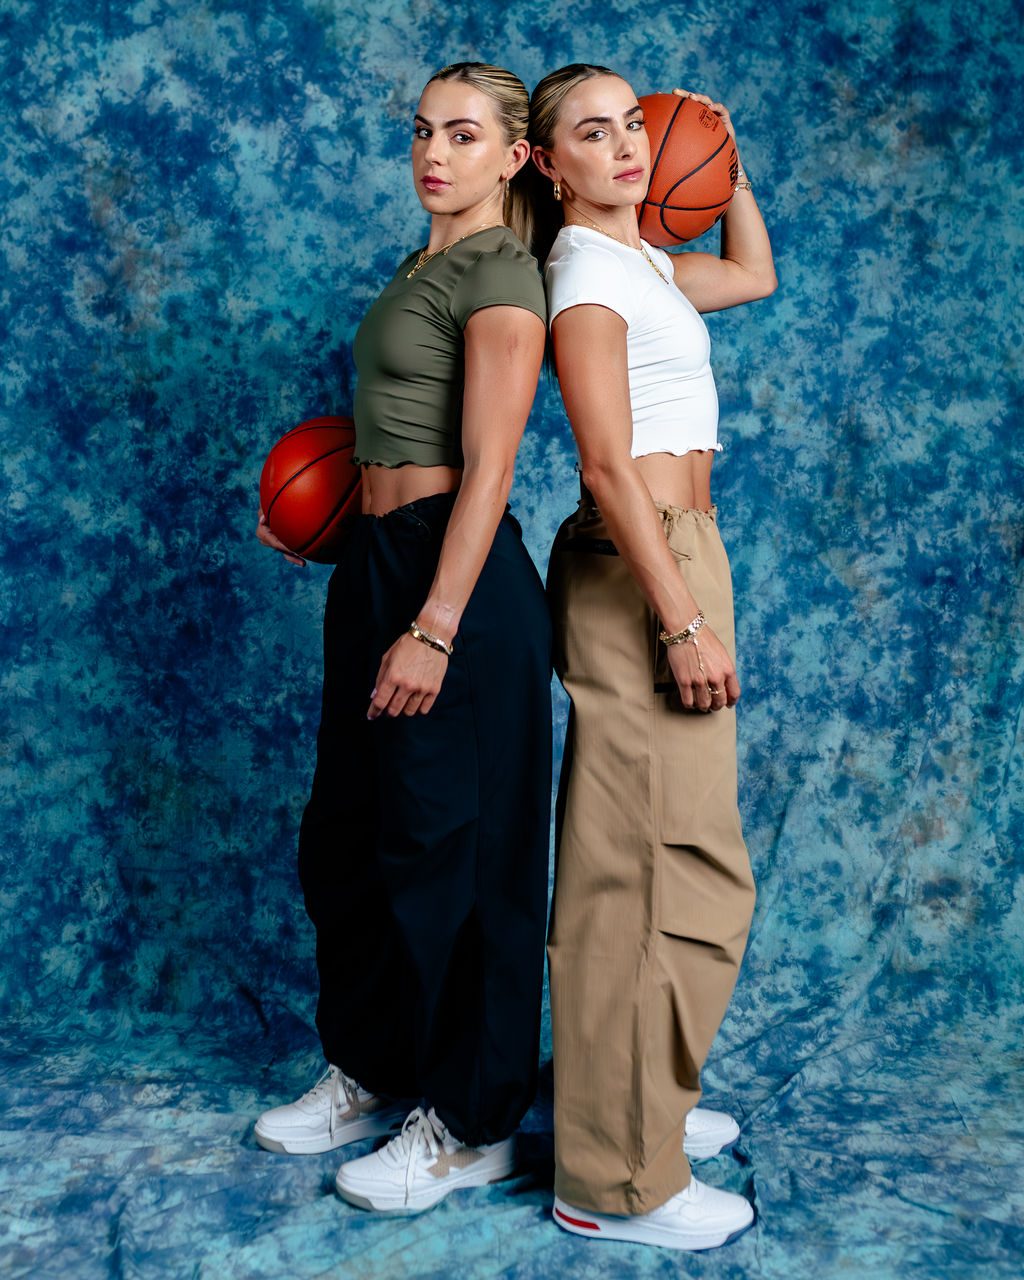
\
Under Armour Welcomes its Newest Brand Ambassadors: Haley and Hanna Cavinder\
Under Armour announced today that it has signed University of Miami Point Guard Haley C...](https://about.underarmour.com/en/stories/2024/07/under-armour-welcomes-its-newest-brand-ambassadors--haley-and-ha.html)
[
\
[
\
Under Armour Returns to the Warrior Games for Seventh Year to Honor Military Community\
Under Armour’s support for the military community knows no limits. For years, the brand...](https://about.underarmour.com/en/stories/2024/06/under-armour-returns-to-the-warrior-games-for-seventh-year-to-ho.html)
[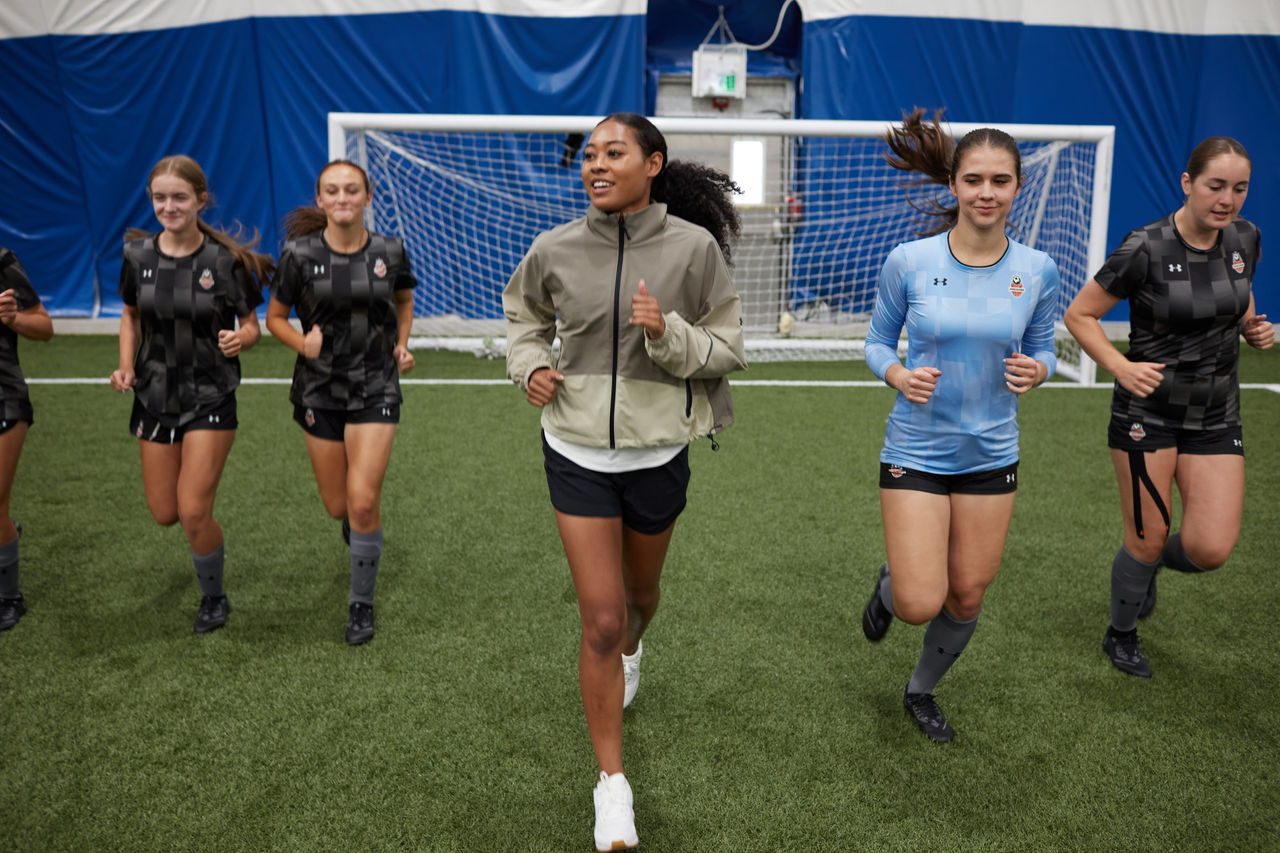
\
Kick It with Jayde Riviere\
Jayde Riviere, Manchester United and Canadian national team player, and Under Armour at...](https://about.underarmour.com/en/stories/2024/06/kick-it-with-jayde-riviere.html)
[
\
University of Maryland and Under Armour Announce 12-Year Extension of Iconic Partnership\
After two decades of partnership, the University of Maryland has renewed its partnershi...](https://about.underarmour.com/en/stories/2024/06/university-of-maryland-and-under-armour-announce-12-year-extensi.html)
[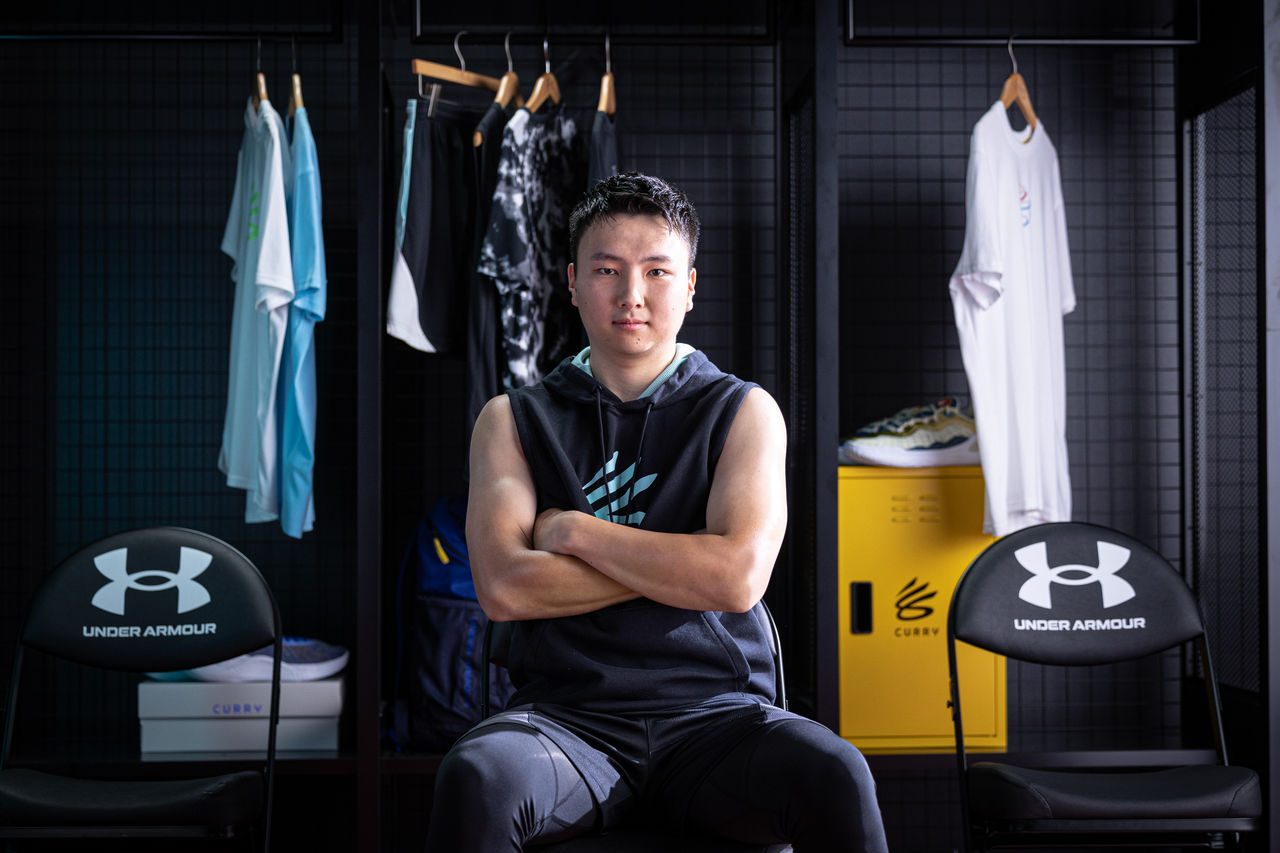
\
Keisei Tominaga Signs with Curry Brand\
Keisei Tominaga made quite a splash as a breakout star on the NCAA basketball scene thi...](https://about.underarmour.com/en/stories/2024/06/keisei-tominaga-signs-with-curry-brand.html)
[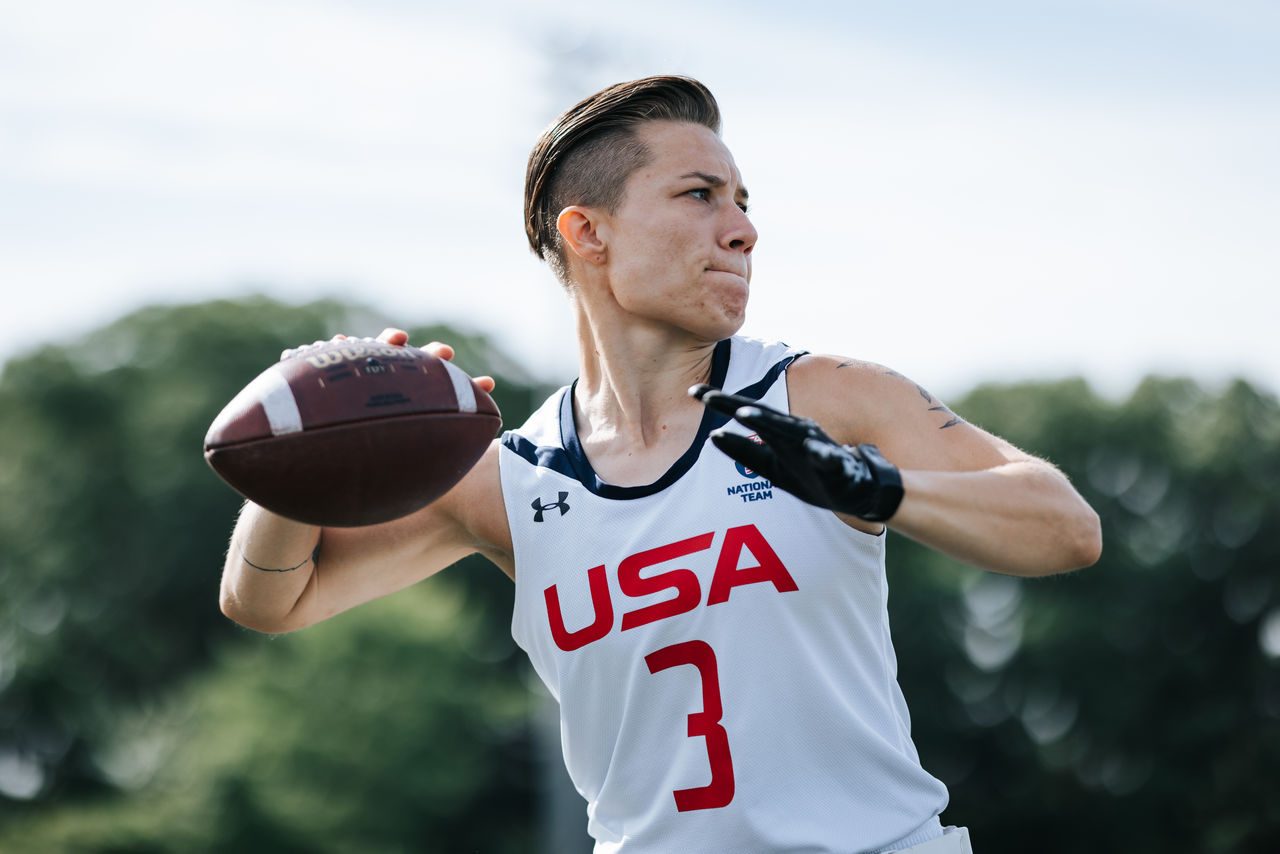
\
USA Football and Under Armour Form Multi-Year Partnership to Support U.S. National Teams and Grow the Game of Football\
USA Football, the sport’s governing body in the United States and the organization resp...](https://about.underarmour.com/en/stories/2024/06/usa-football-and-under-armour-form-multi-year-partnership-to-sup.html)
[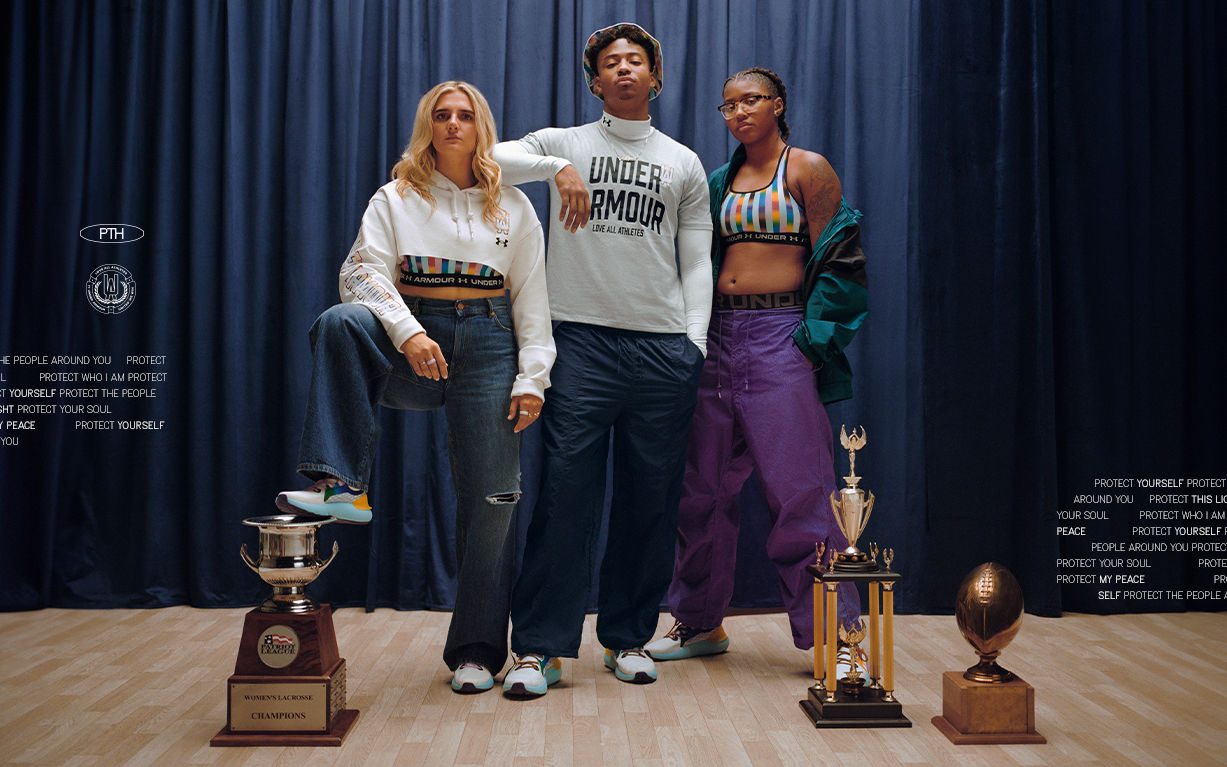
\
Sport for All\
In celebration of Pride 2024, Under Armour is turning its attention to the playing fiel...](https://about.underarmour.com/en/stories/2024/05/sport-for-all-.html)
[
\
An Ode to an Icon: Celebrating Kelley O'Hara\
After 15 impressive years of playing professional soccer, Kelley O’Hara has announced h...](https://about.underarmour.com/en/stories/2024/05/an-ode-to-an-icon--celebrating-kelley-o-hara-.html)
[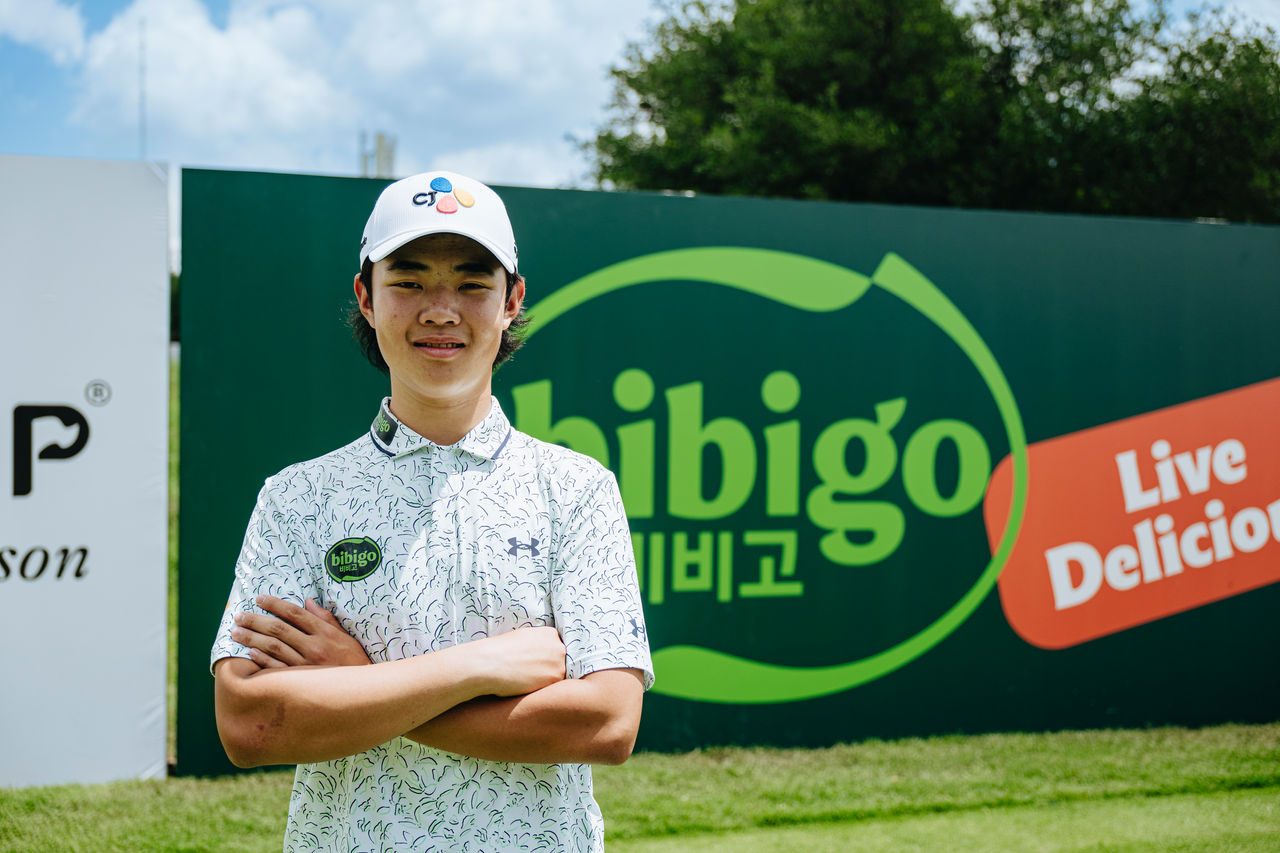
\
Under Armour Signs English Amateur Golf Sensation Kris Kim\
Surrey-based Kris Kim, who starred in Europe’s victory at last year’s junior Ryder Cup,...](https://about.underarmour.com/en/stories/2024/05/under-armour-signs-english-amateur-golf-sensation-kris-kim.html)
[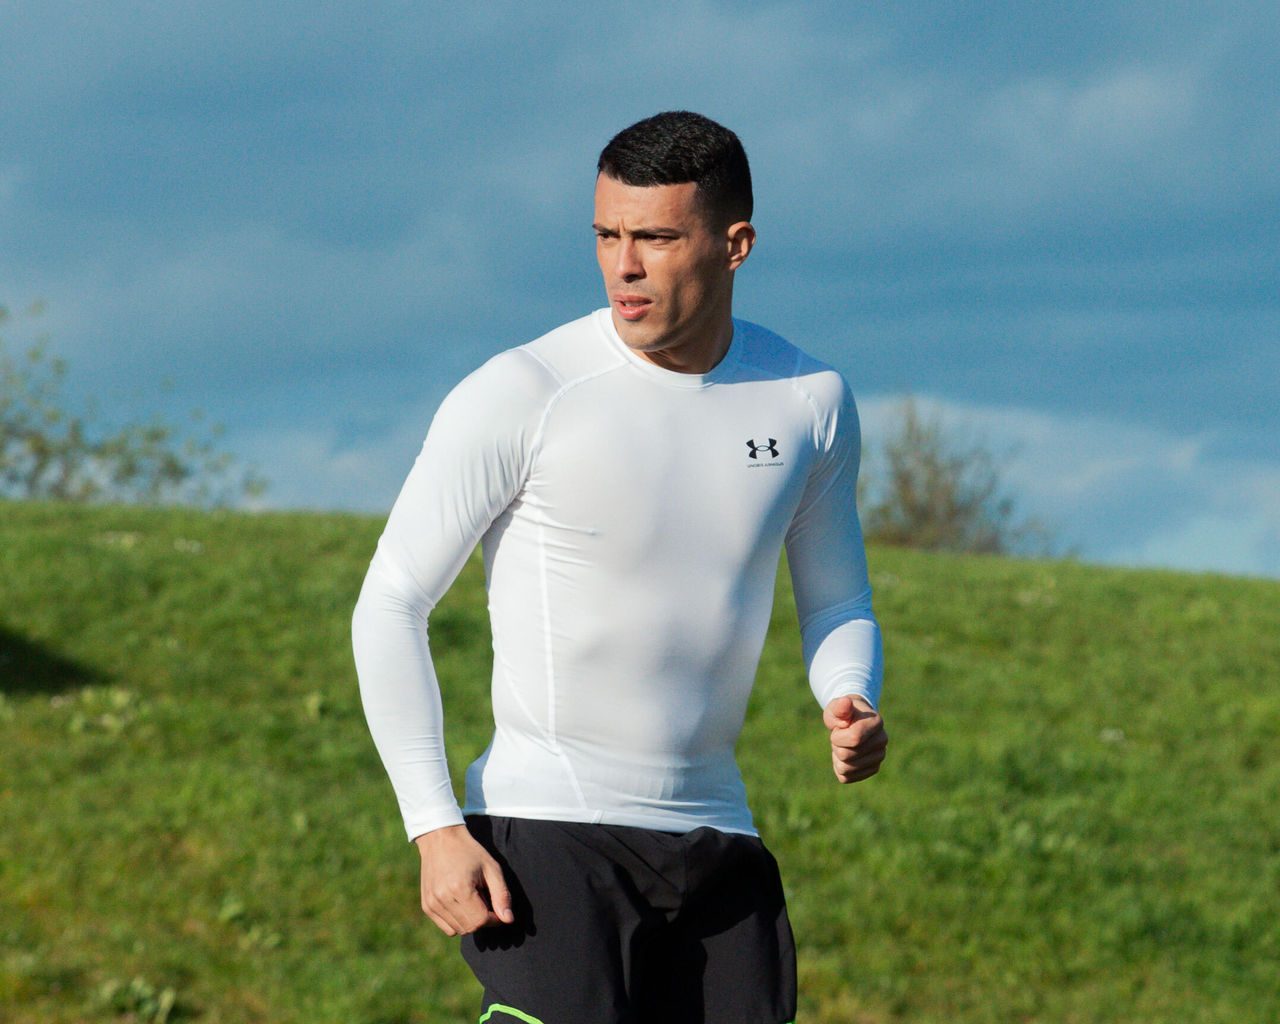
\
Under Armour Signs Tottenham Hotspur FC & Spain's Pedro Porro\
Under Armour continues its commitment to growing its elite football roster by signing T...](https://about.underarmour.com/en/stories/2024/05/under-armour-signs-tottenham-hotspur-fc---spain-s-pedro-porro.html)
[
\
Under Armour Announces Yuron White as SVP, Sportswear, Run, Basketball/Curry & Collaborations\
Under Armour is proud to announce that on April 29, 2024, Yuron White joined the compan...](https://about.underarmour.com/en/stories/2024/04/under-armour-announces-yuron-white-as-svp--sportswear--run--bask.html)
[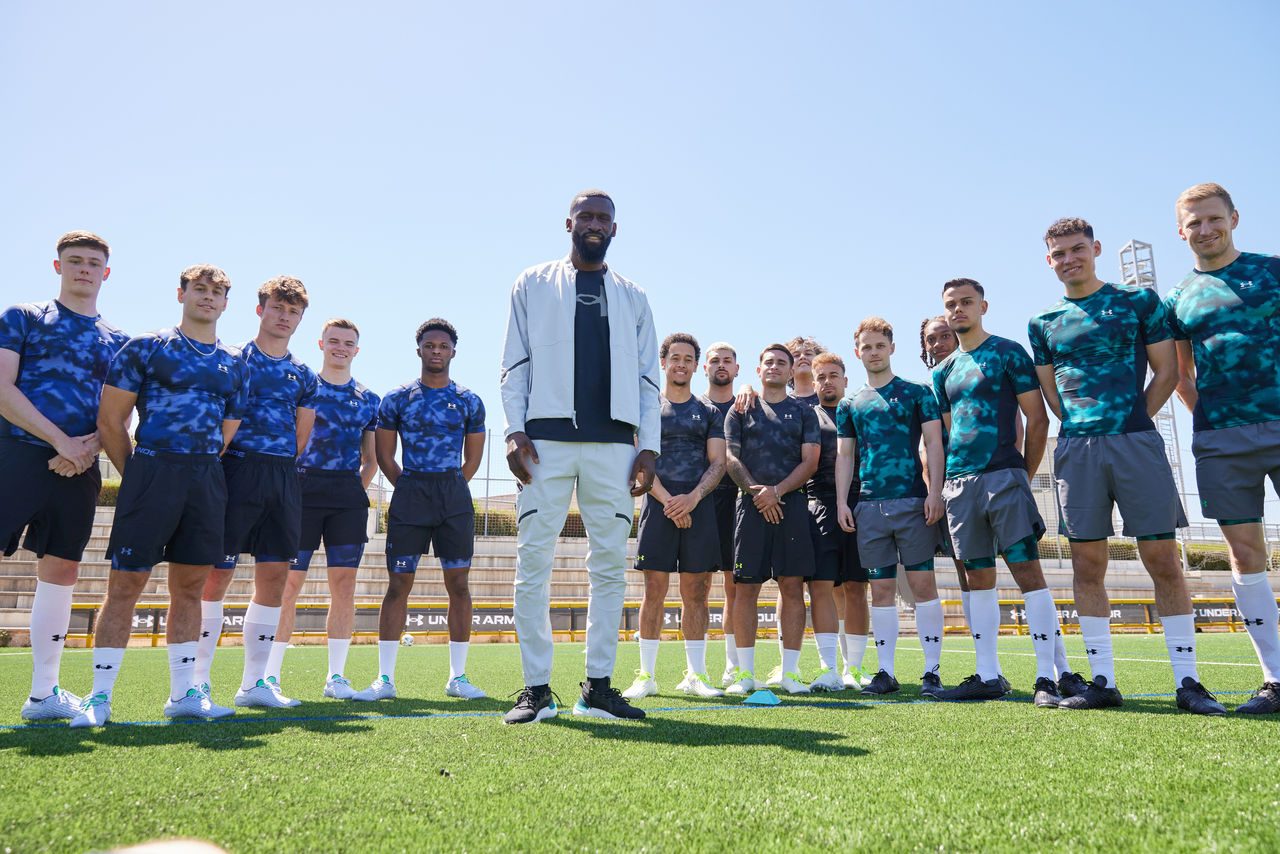
\
Under Armour Keeps Young Athletes Cool in the Heat of Madrid\
Under Armour HeatGear® Baselayer has been a staple in athletes' uniforms since its laun...](https://about.underarmour.com/en/stories/2024/04/under-armour-keeps-young-athletes-cool-in-the-heat-of-madrid.html)
[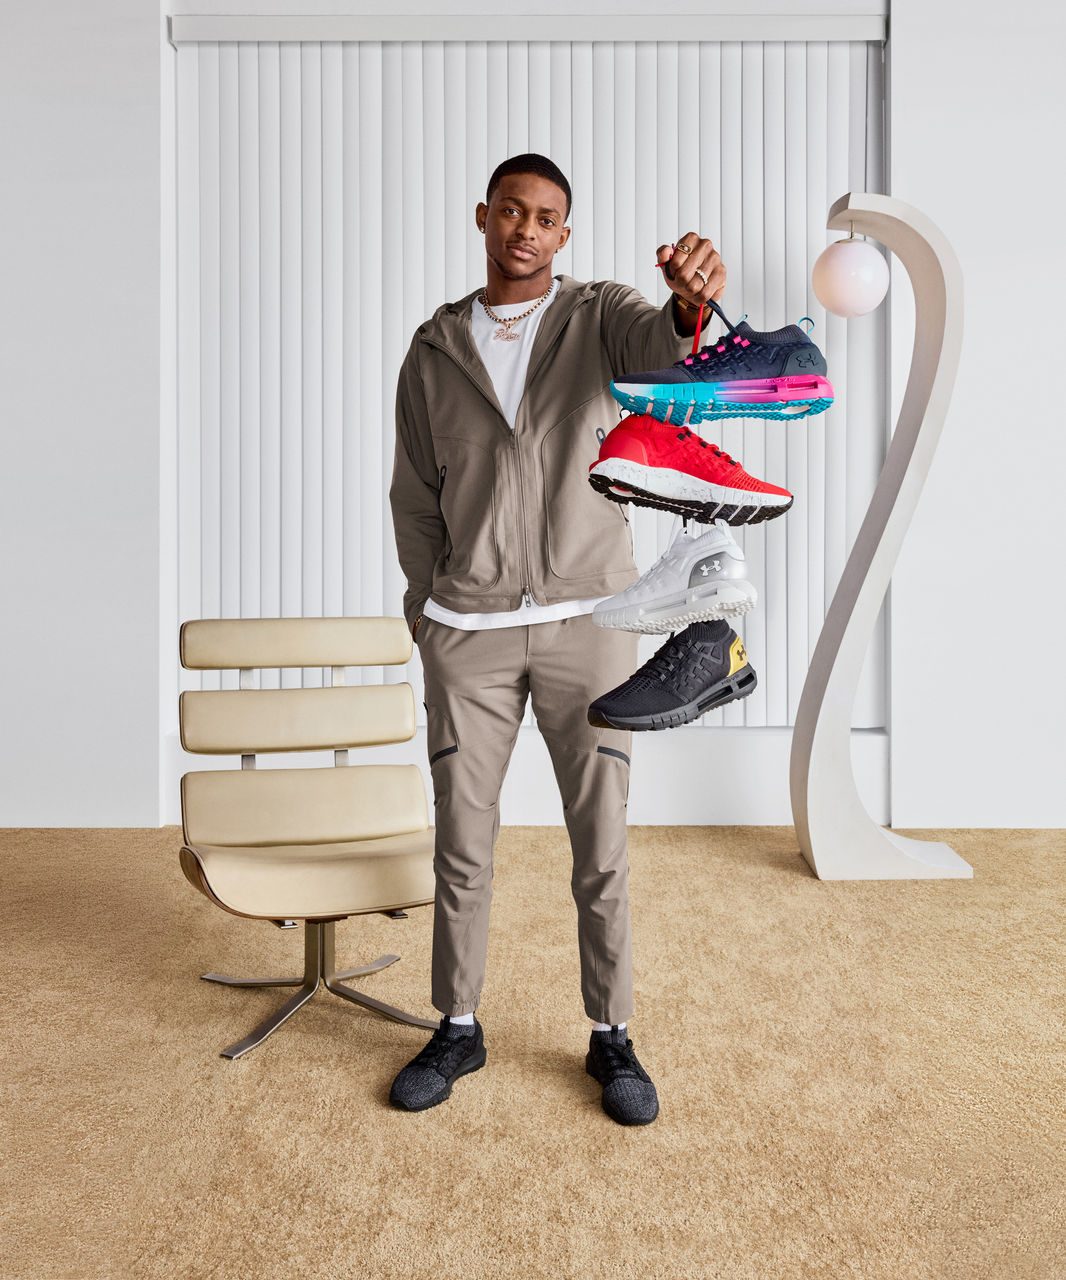
\
Curry Brand's De'Aaron Fox Kicks Off New Campaign with UA Phantom 1\
De’Aaron Fox is the face of a new campaign for Under Armour with partners Foot Inc., re...](https://about.underarmour.com/en/stories/2024/04/curry-brand-s-de-aaron-fox-kicks-off-new-campaign-with-ua-phanto.html)
[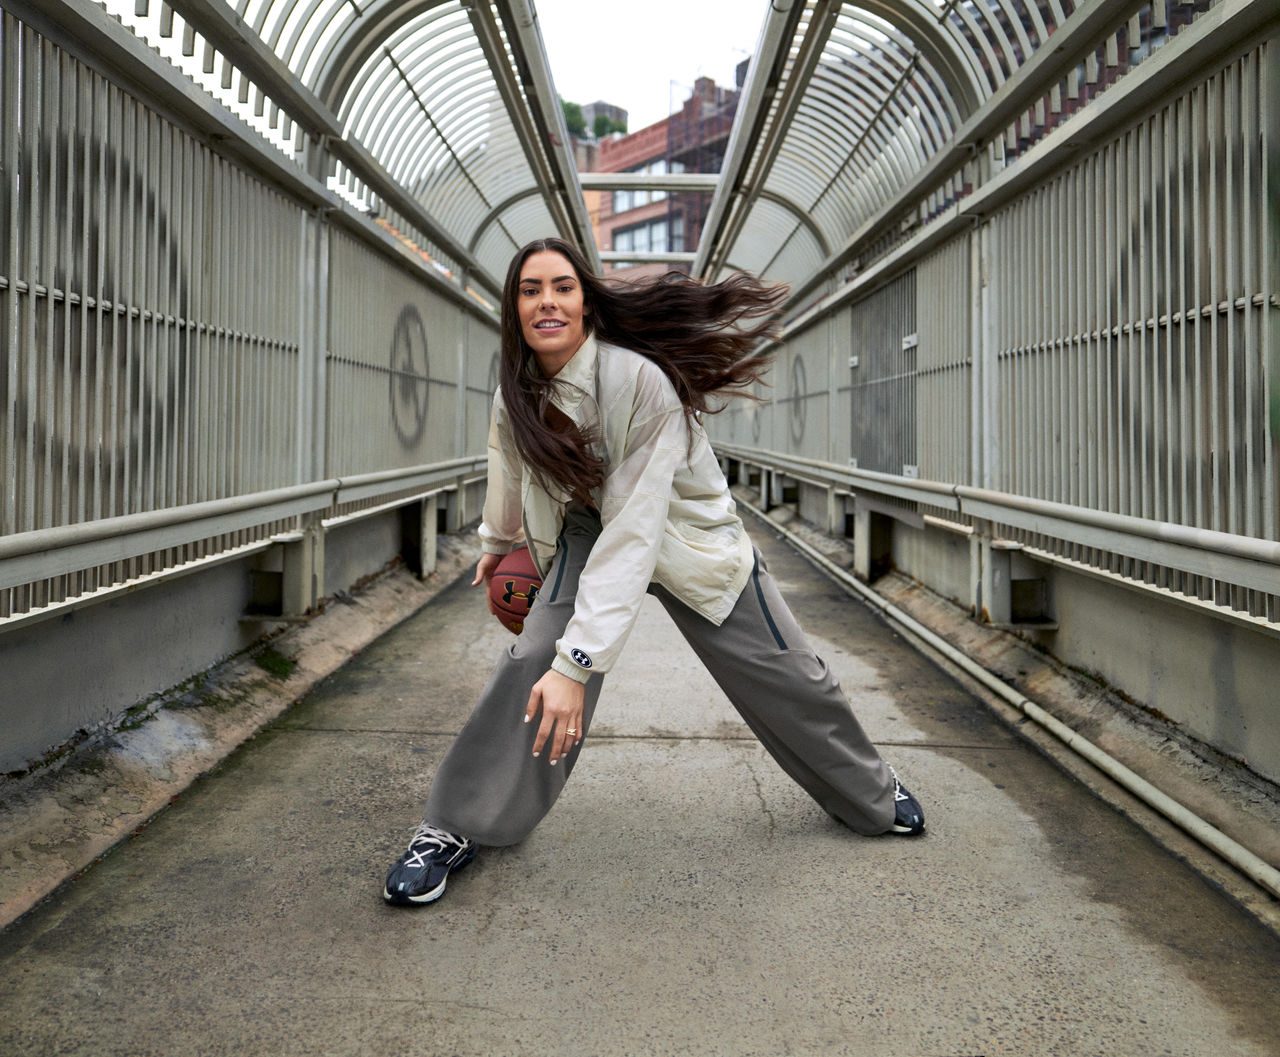
\
(Dawg) Class is Back in Session\
Under Armour and Kelsey Plum are coming together once again to host the second year of ...](https://about.underarmour.com/en/stories/2024/04/-dawg--class-is-back-in-session---.html)
[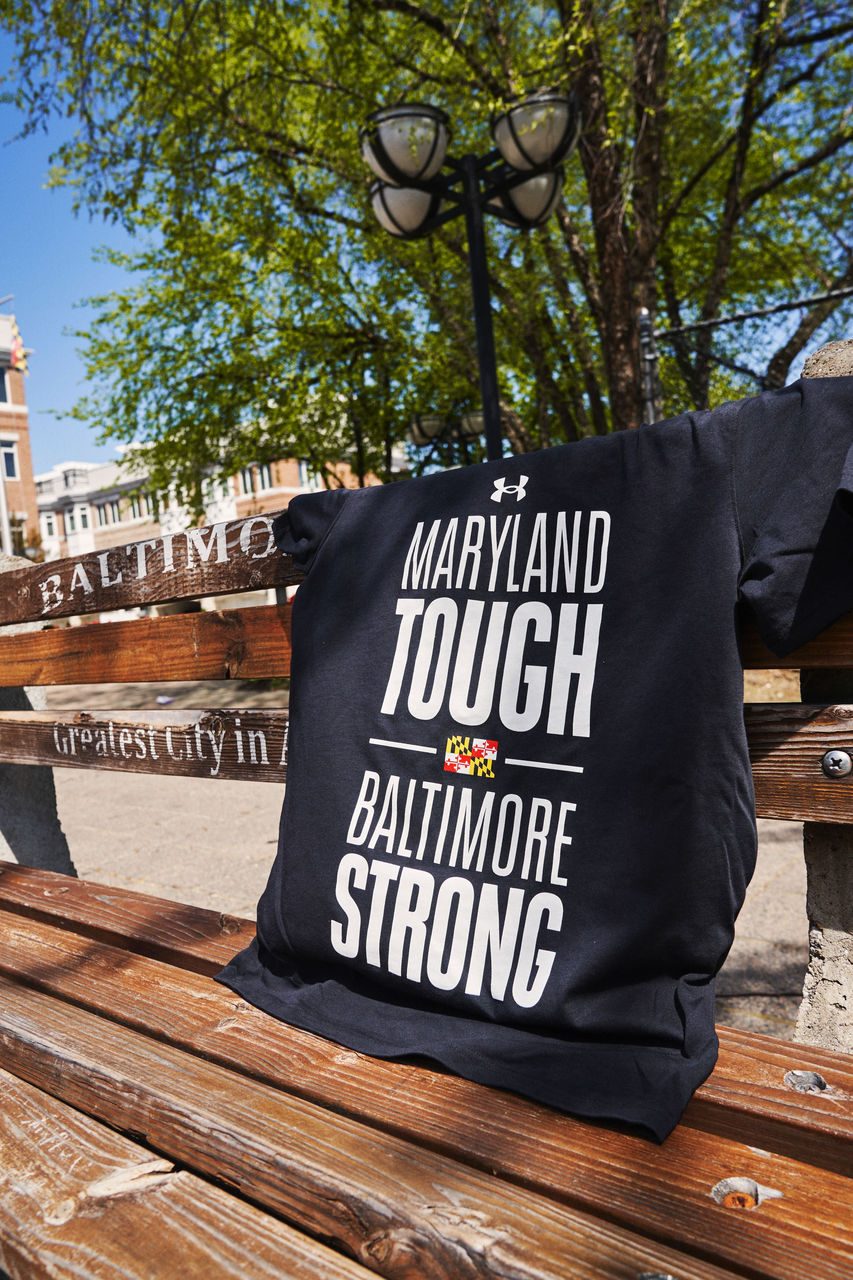
\
Maryland Tough, Baltimore Strong\
In partnership with the Baltimore Community Foundation, Under Armour has released a spe...](https://about.underarmour.com/en/stories/2024/04/maryland-tough--baltimore-strong-.html)
[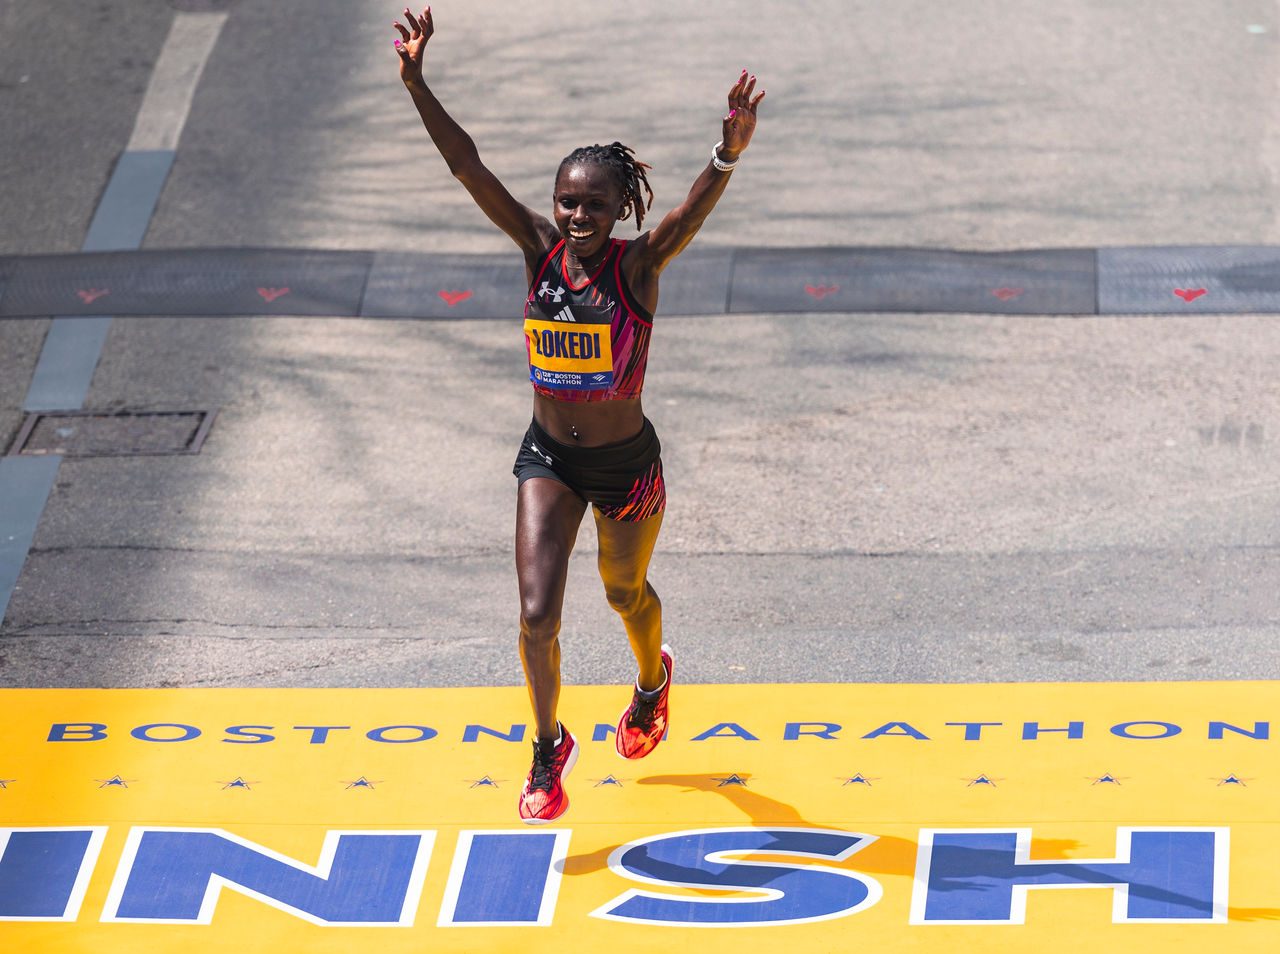
\
Another Marathon, Another Podium\
On Monday, April 15th, Under Armour Athlete Sharon Lokedi finished second in the Boston...](https://about.underarmour.com/en/stories/2024/04/another-marathon-another-podium.html)
[
\
Introducing The Hat Only Under Armour Could Make\
Under Armour continues to push the boundaries of innovation as it develops products tha...](https://about.underarmour.com/en/stories/2024/04/introducing-the-hat-only-under-armour-could-make.html)
[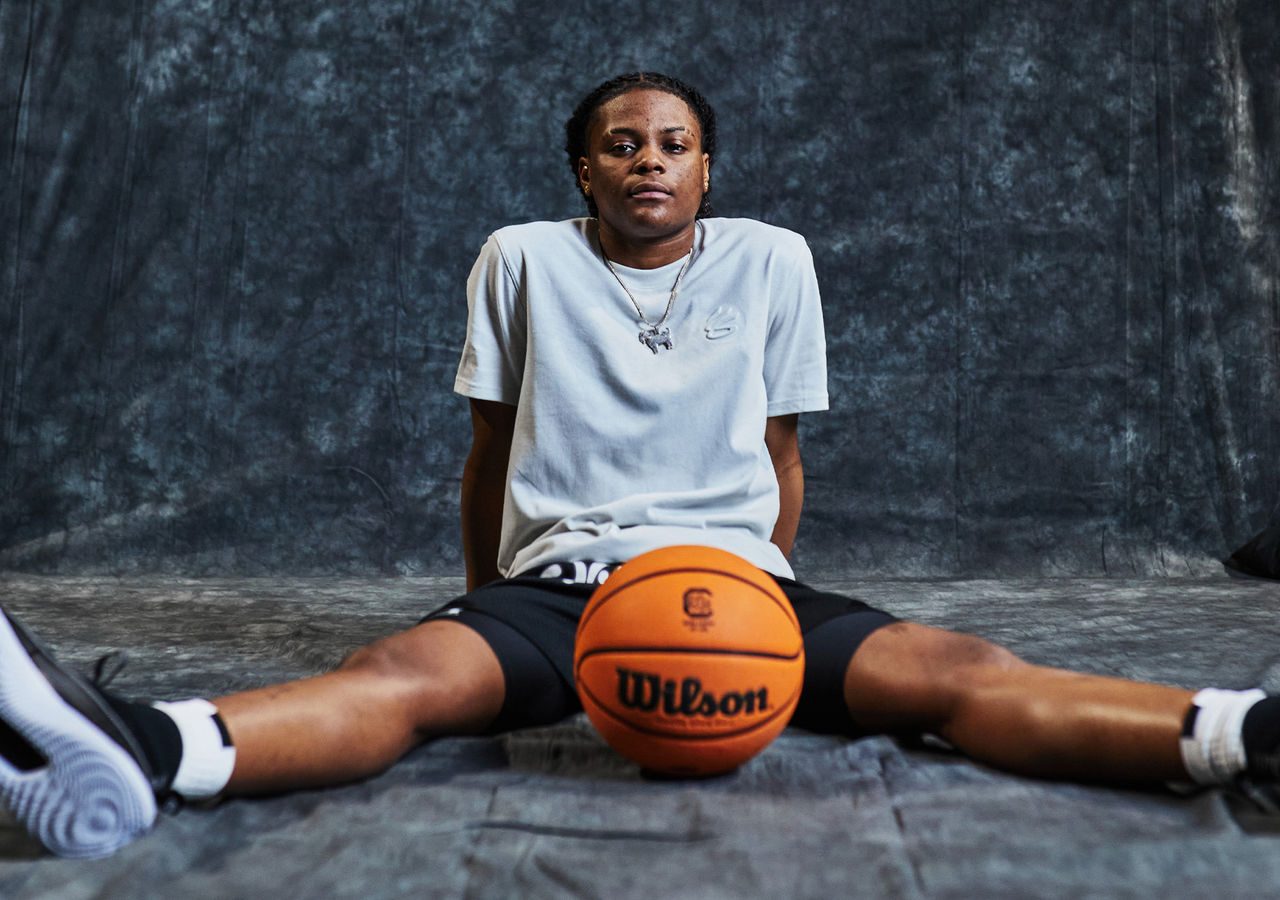
\
MiLaysia Fulwiley Signs With Curry Brand\
In November 2023, MiLaysia Fulwiley made a name for herself in the basketball world whe...](https://about.underarmour.com/en/stories/2024/03/milaysia-fulwiley-signs-with-curry-brand.html)
[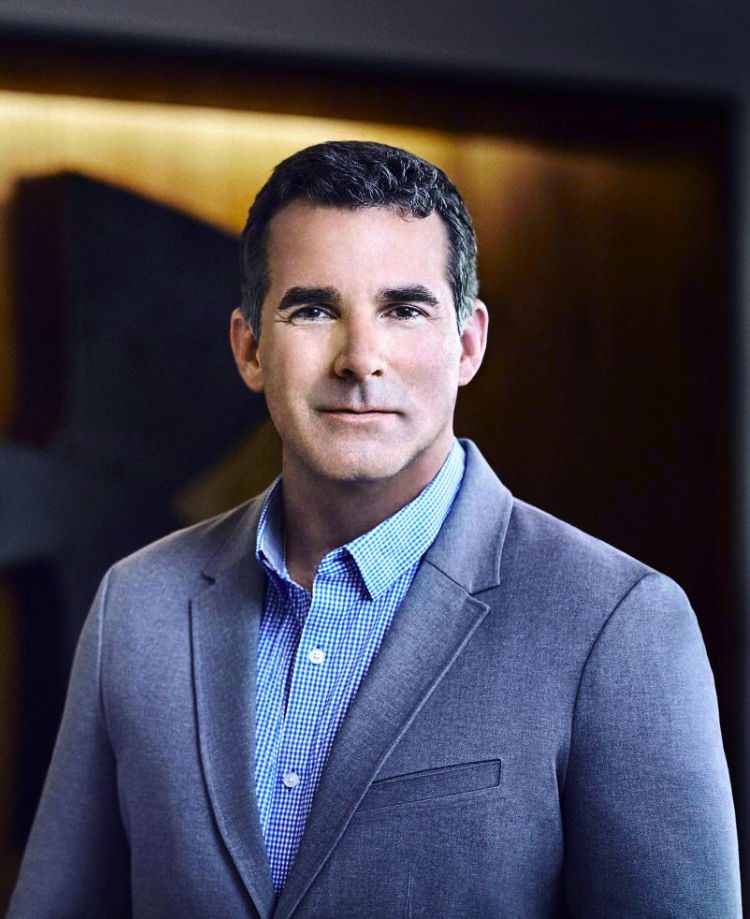
\
Under Armour Announces Leadership Transition\
Under Armour, Inc. (NYSE: UA, UAA) today announced that Kevin Plank will become Preside...](https://about.underarmour.com/en/stories/2024/03/under-armour-announces-leadership-transition.html)
[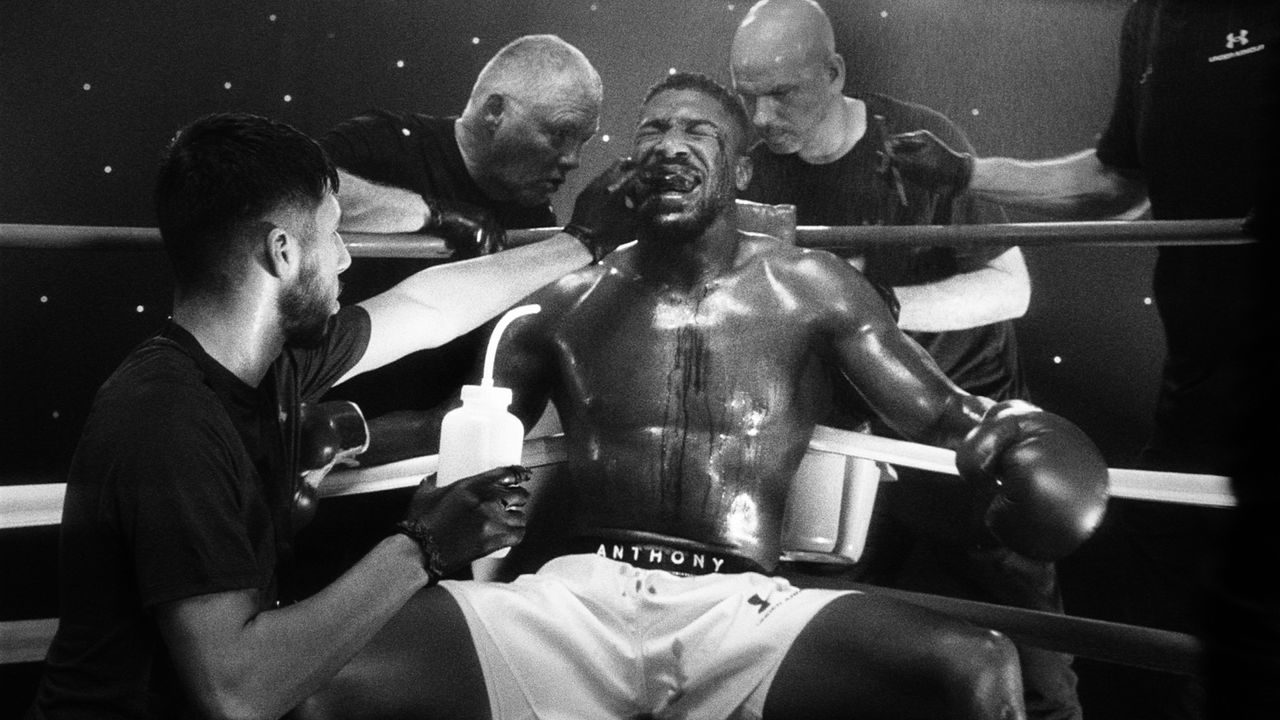
\
Forever Is Made Now\
Under Armour has been providing AJ with leading performance solutions in and out of the...](https://about.underarmour.com/en/stories/2024/03/forever-is-made-now.html)
[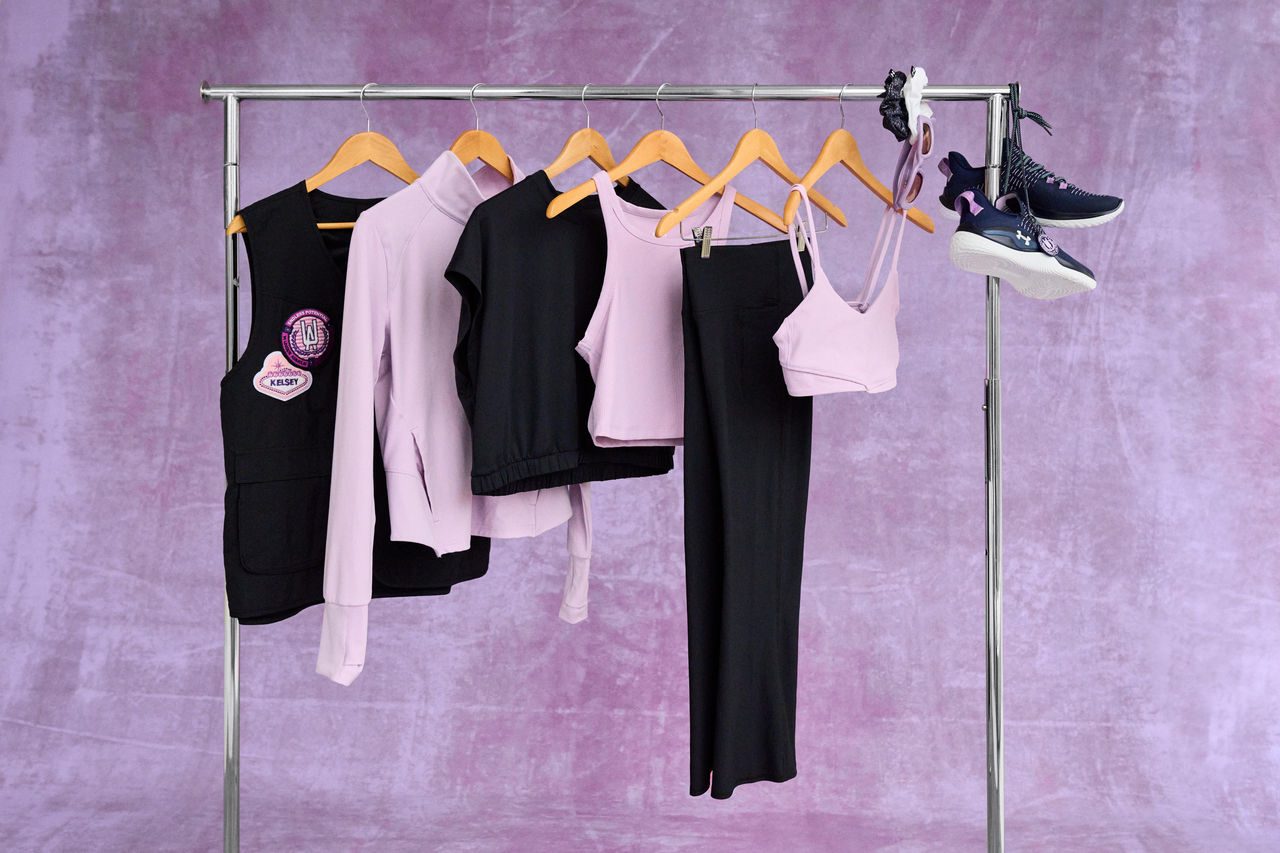
\
Under Armour Champions Women In Sports With Latest Collection\
Under Armour stands for equality, both on and off the field and court, and has committe...](https://about.underarmour.com/en/stories/2024/03/under-armour-champions-women-in-sports-with-latest-collection.html)
[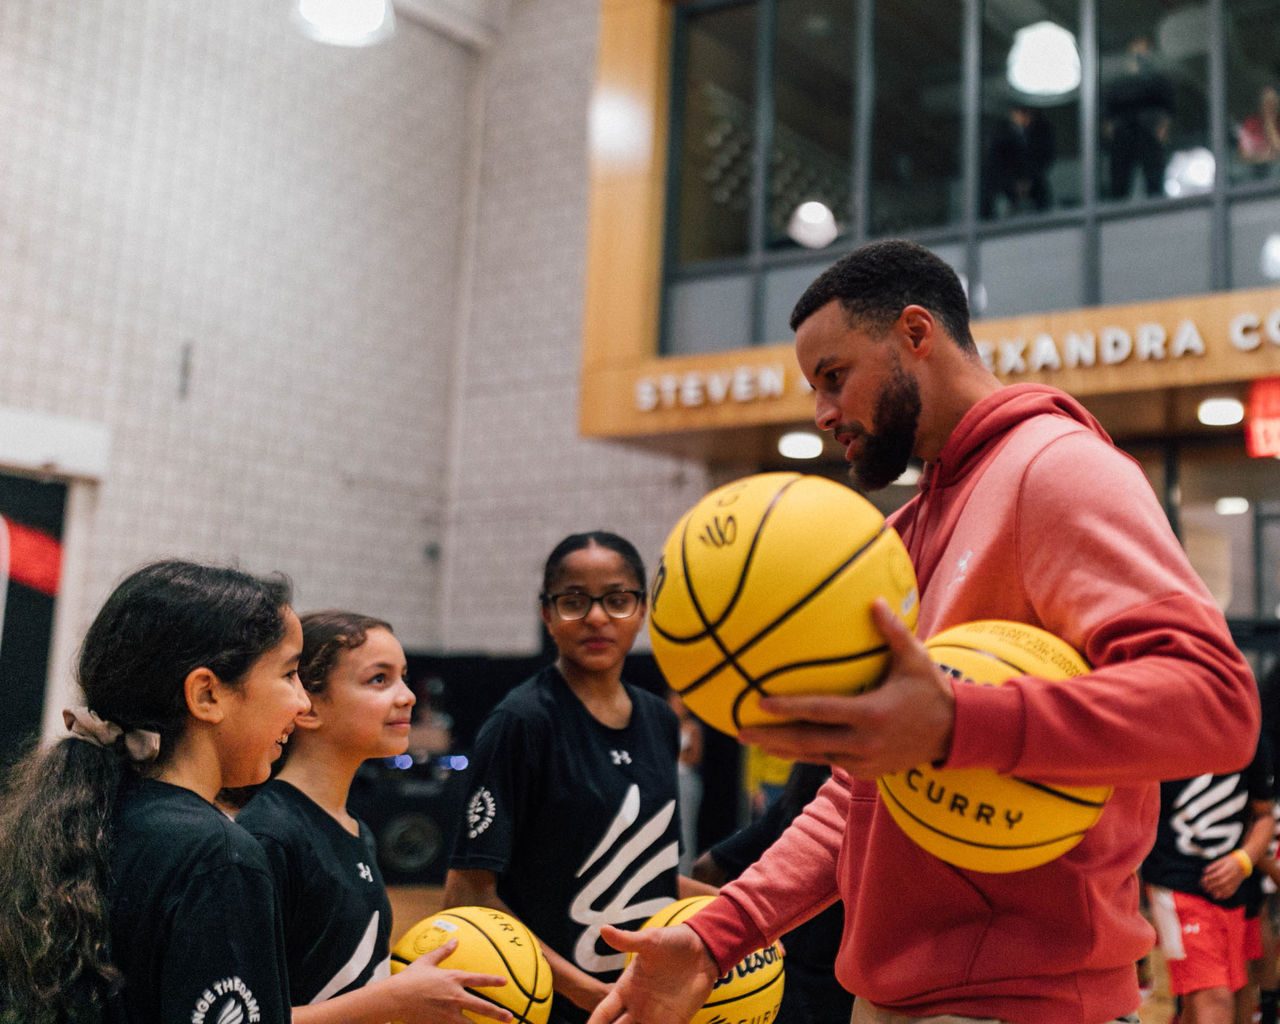
\
Curry Brand Completes 12th Court Revitalization in New York City\
Curry Brand, powered by Under Armour, completed its twelfth court refurbishment at DREA...](https://about.underarmour.com/en/stories/2024/02/curry-brand-completes-12th-court-revitalization-in-new-york-city.html)
- 1
- 2
- 3
- 4
- 5
- 6
- 7
- 8
- 9
- 10
- 11
- 12
- 13
- 14
- 15
- 16
- 17
- 18
- 19
- 20
- 21
- 22
- 23
- 24
- 25
- 26
- 27
- 28
- 29
- 30
- 31
- 32
- 33
- 34
- 35
- 36
- 37
- 38
- 39
- 40
- 41
- 42
- 43
- 44
- 45
- 46
- 47
- 48
- 49
- 50
- 51
- 52
- 53
- 54
- 55
- 56
- 57
- 58
- 59
- 60
- 61
- 62
- 63
- 64
- 65
- 66
- 67
Previous
1 of 67
Next
About UA

About UA
Additional Resources
Additional Resources
UA Apps

UA Social


© 2026 Under Armour® Inc.
Privacy Policy
/ Terms & Conditions
/ CA Supply Chains Act
Your Choices Regarding Cookies on this Site. Cookies are important to the proper functioning of a site. To improve your experience, we use cookies to remember log-in details and provide secure log-in, collect statistics to optimize site functionality and deliver content tailored to your interests. Click Accept and Proceed to accept cookies and go directly to the site. Learn about your data rights.
Accept
Download Media
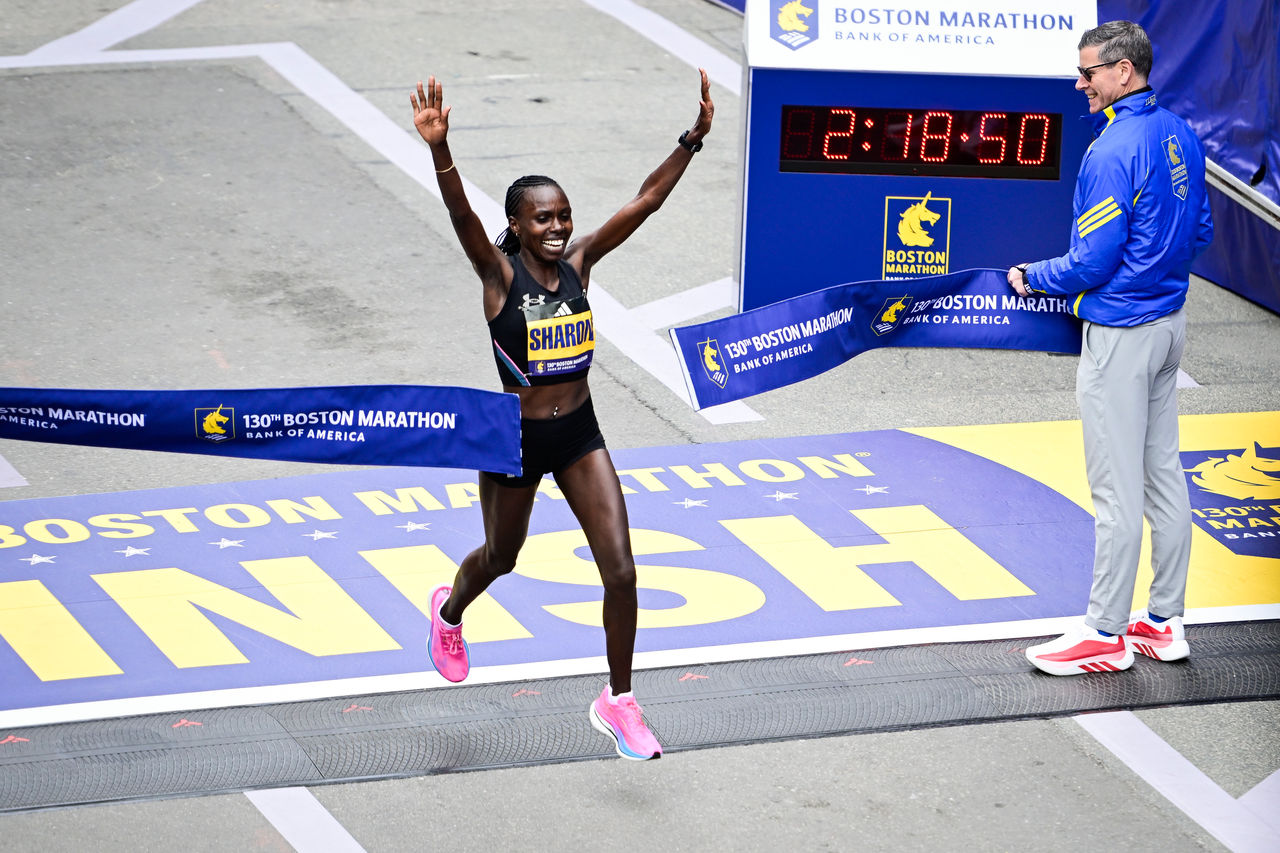
Sharon Lokedi wins Boston Marathon in Velociti 3
GettyImages-2272239802.jpg
Preferred Image Quality
Best AvailableLow Resolution
Download
Download Media
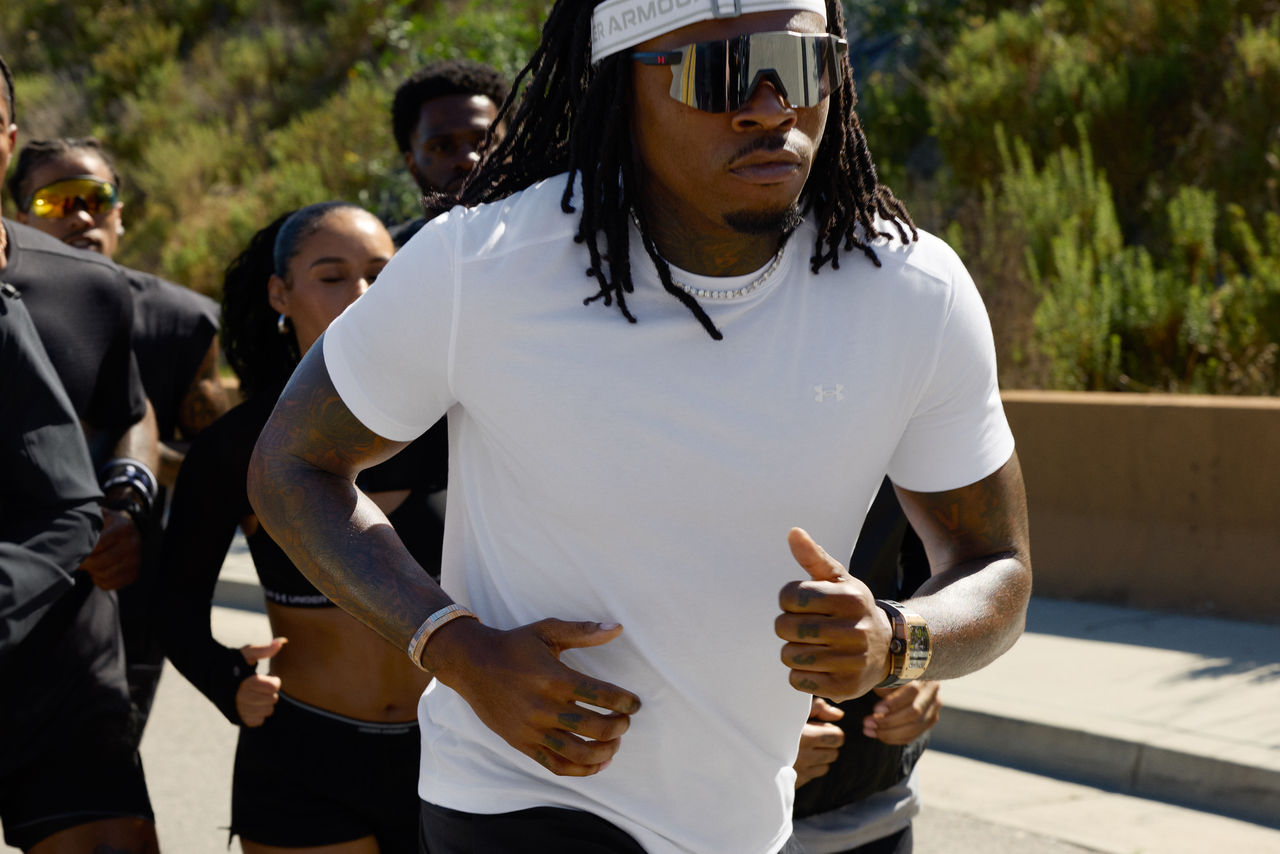
The Bouncy Tee on Gunna
Gunna 0772.jpeg
Preferred Image Quality
Best AvailableLow Resolution
Download
Download Media
We Are Football Heatgear Elite
cq5dam-20260108_SS26_FlagFootball_HeatGear_13_Izzy_Portraits_01337_SCRN-v.jpeg
Preferred Image Quality
Best AvailableLow Resolution
Download
Download Media
We Are Football Heatgear
cq5dam-SS26_FLAG_PROD_JCS00298_PRNT-v.jpeg
Preferred Image Quality
Best AvailableLow Resolution
Download
Download Media
Futbol
KV6_UA_FERMIN B1 6.jpg
Preferred Image Quality
Best AvailableLow Resolution
Download
Download Media
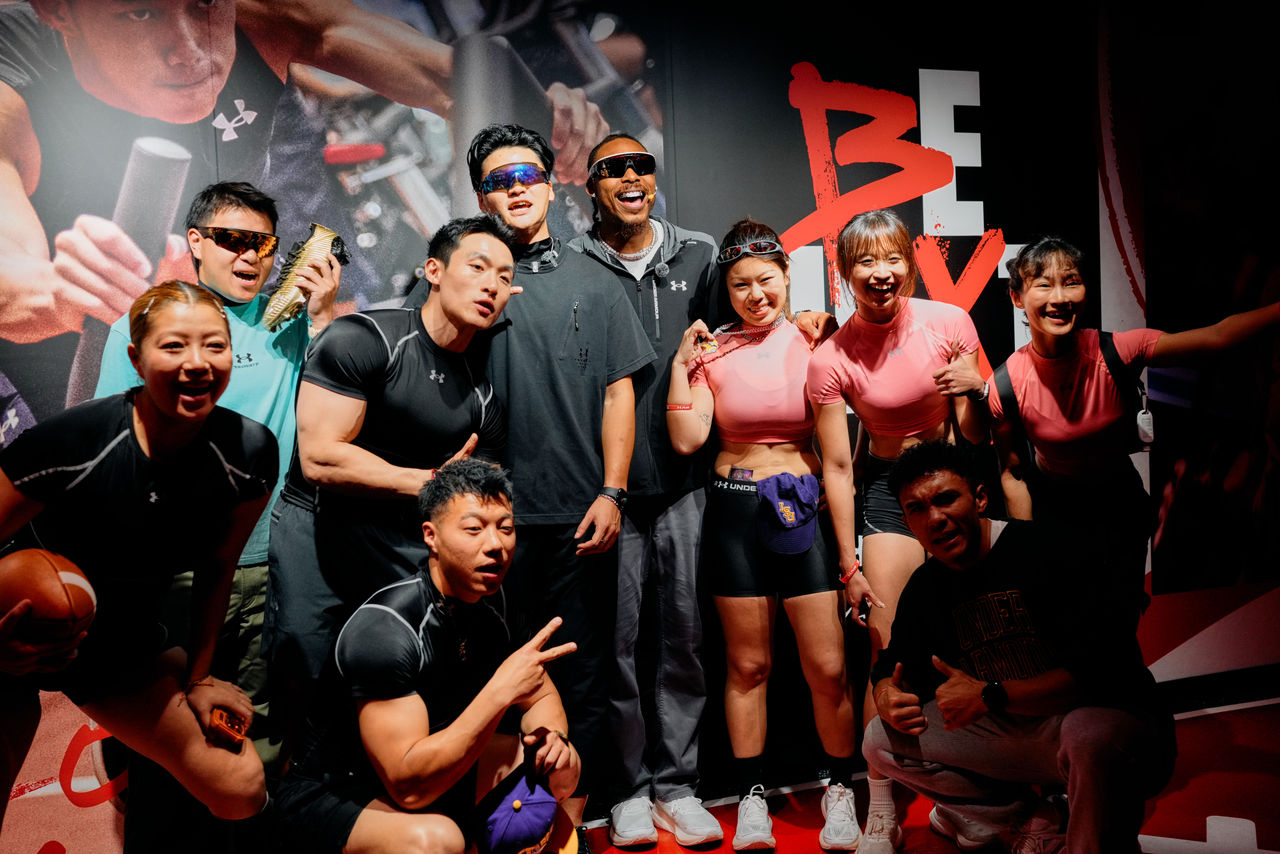
Justin Jefferson APAC
SS26_APAC_FLAG FOOTBALL_JJ TOUR_4.29 Performance Lab_02.jpg
Preferred Image Quality
Best AvailableLow Resolution
Download
Download Media
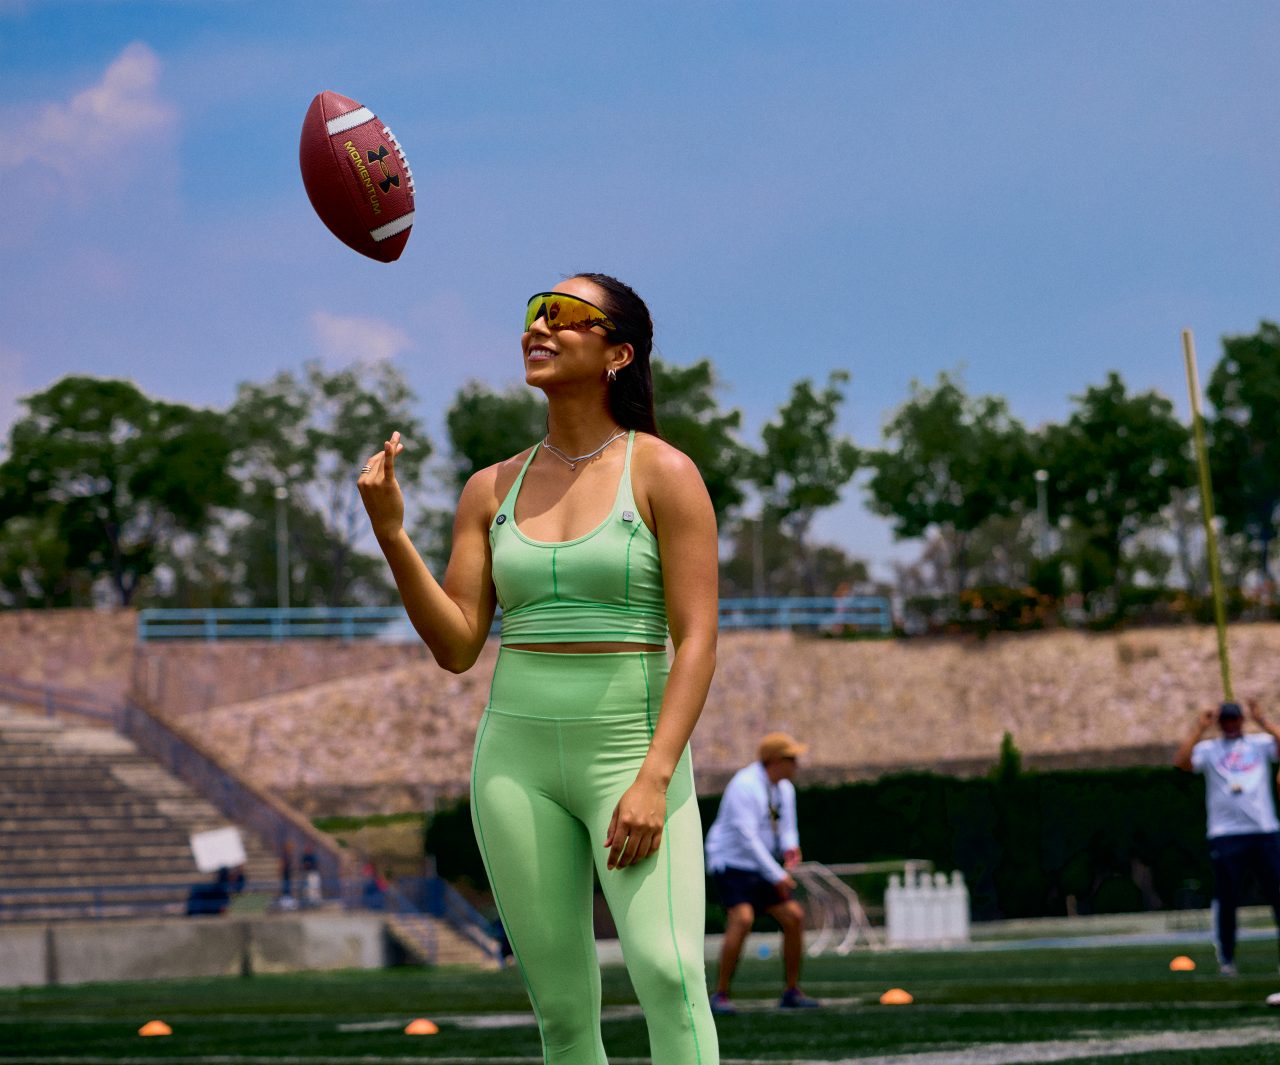
Diana Flores LATAM
_94A9835.jpg
Preferred Image Quality
Best AvailableLow Resolution
Download
 View original content to download multimedia:


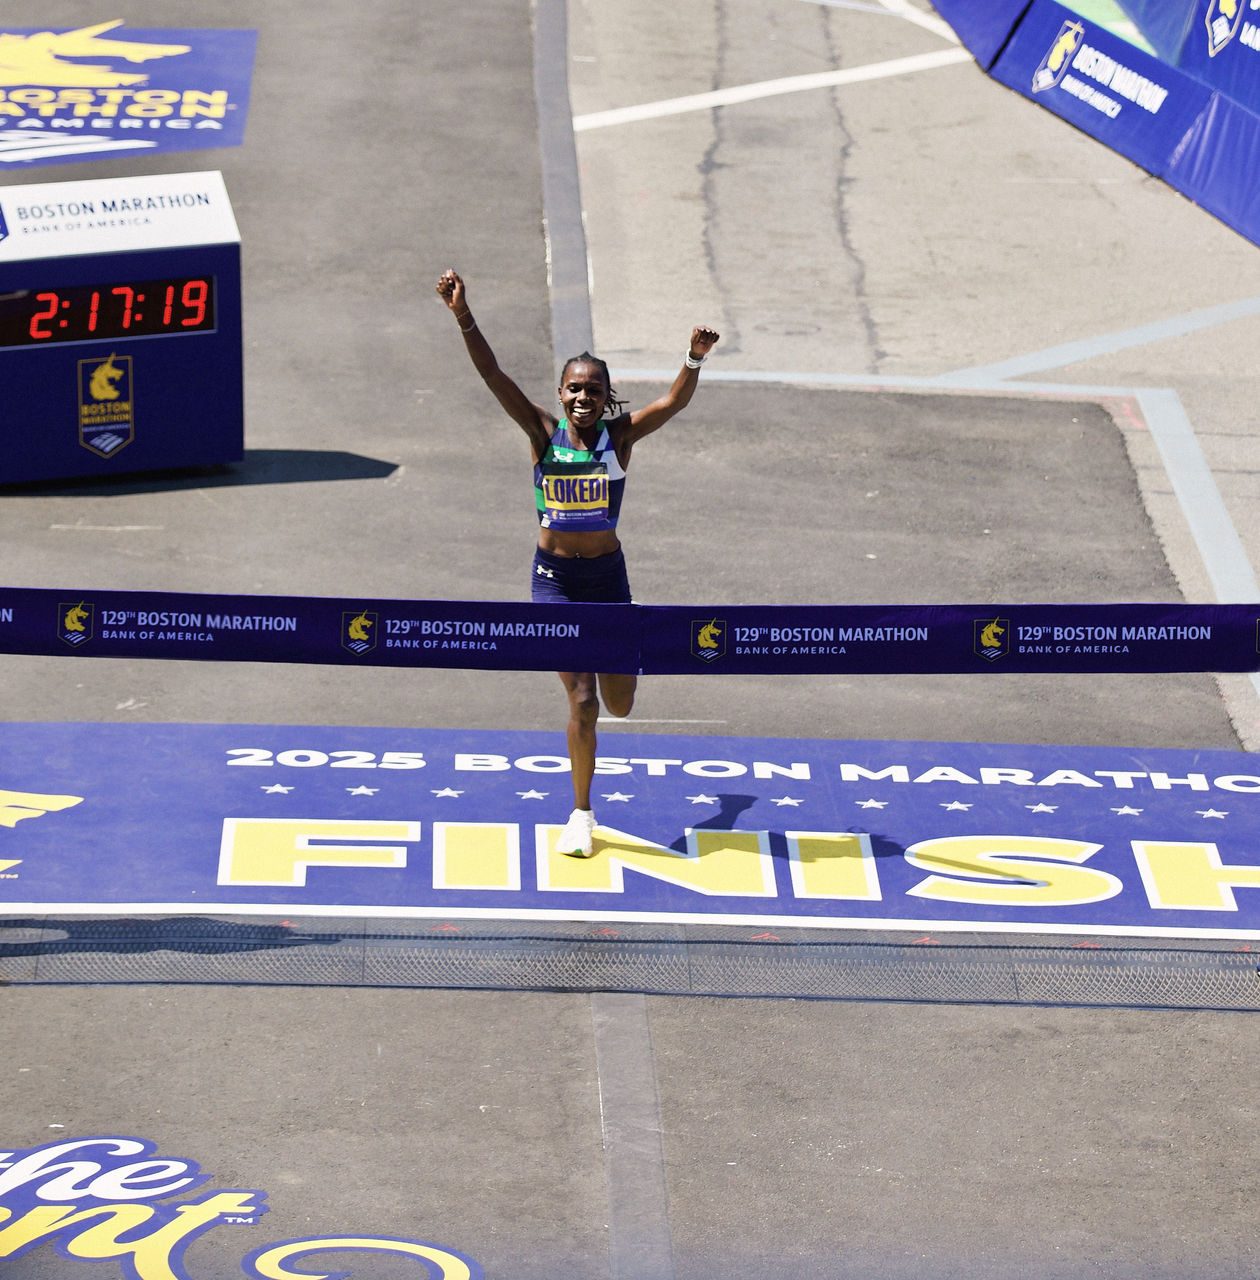
 View original content to download multimedia:


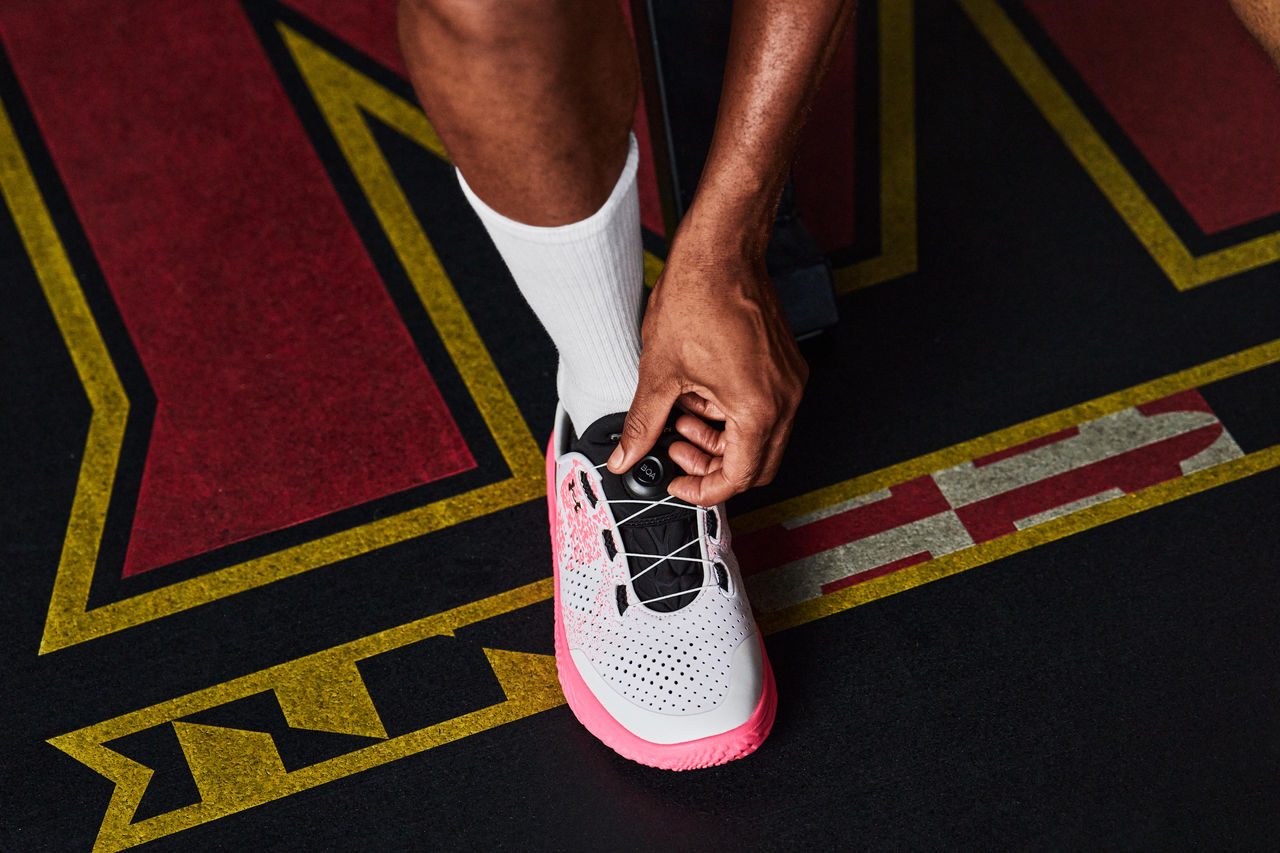
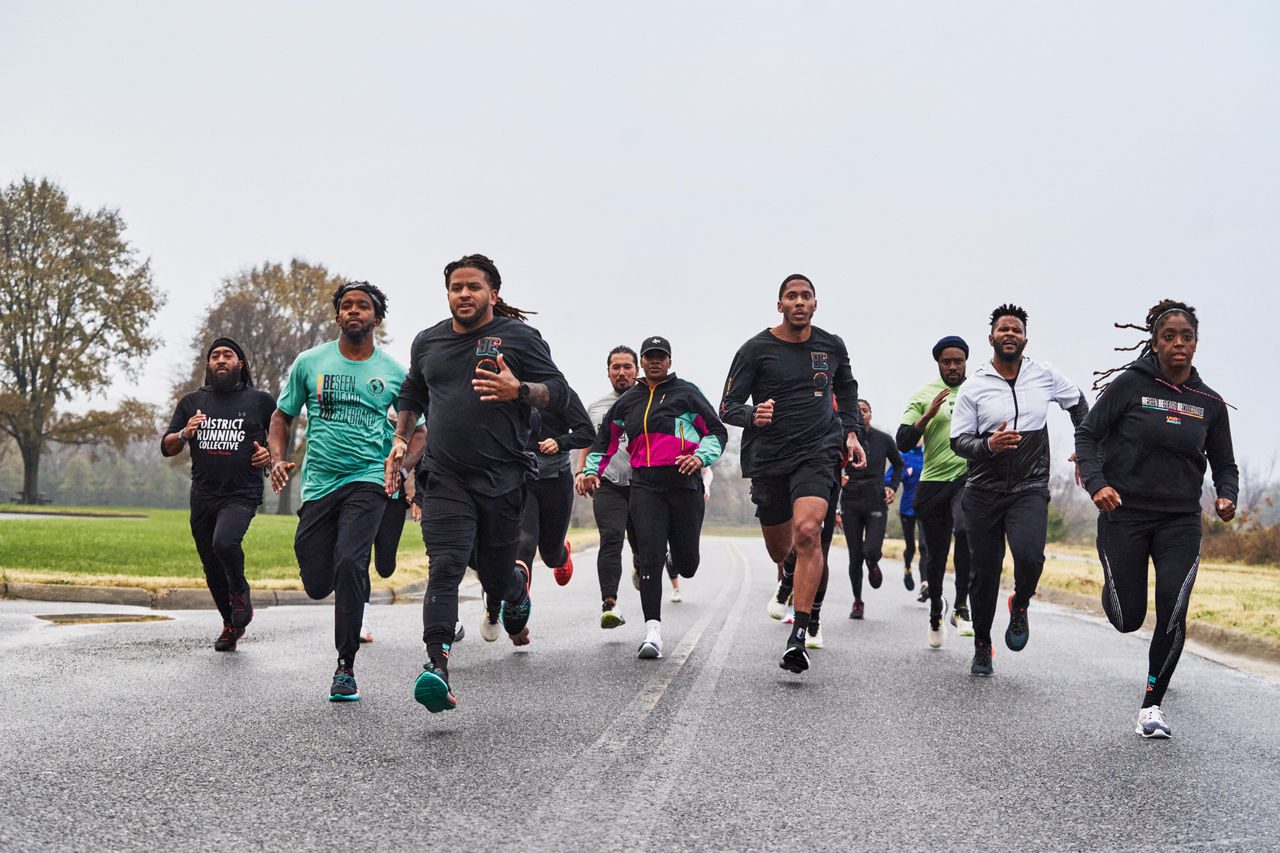
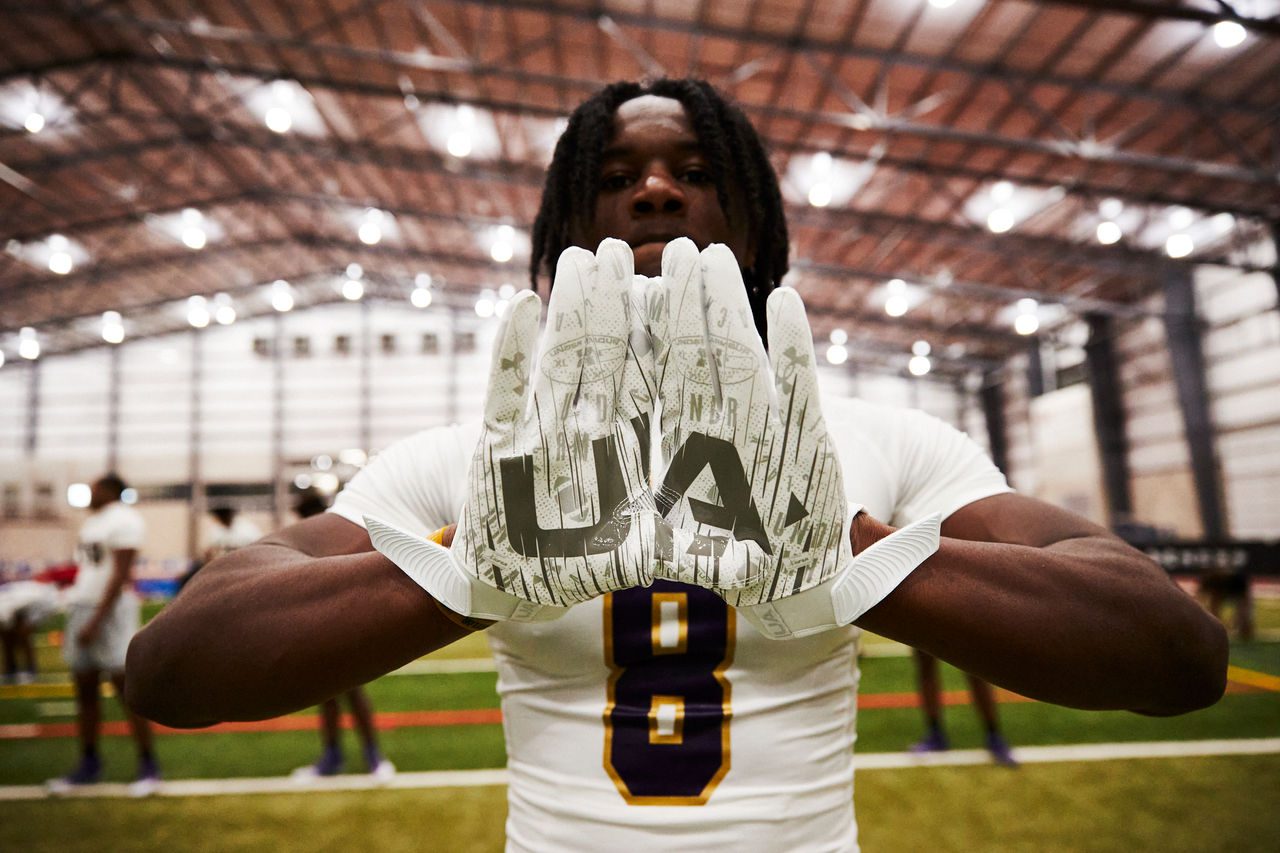
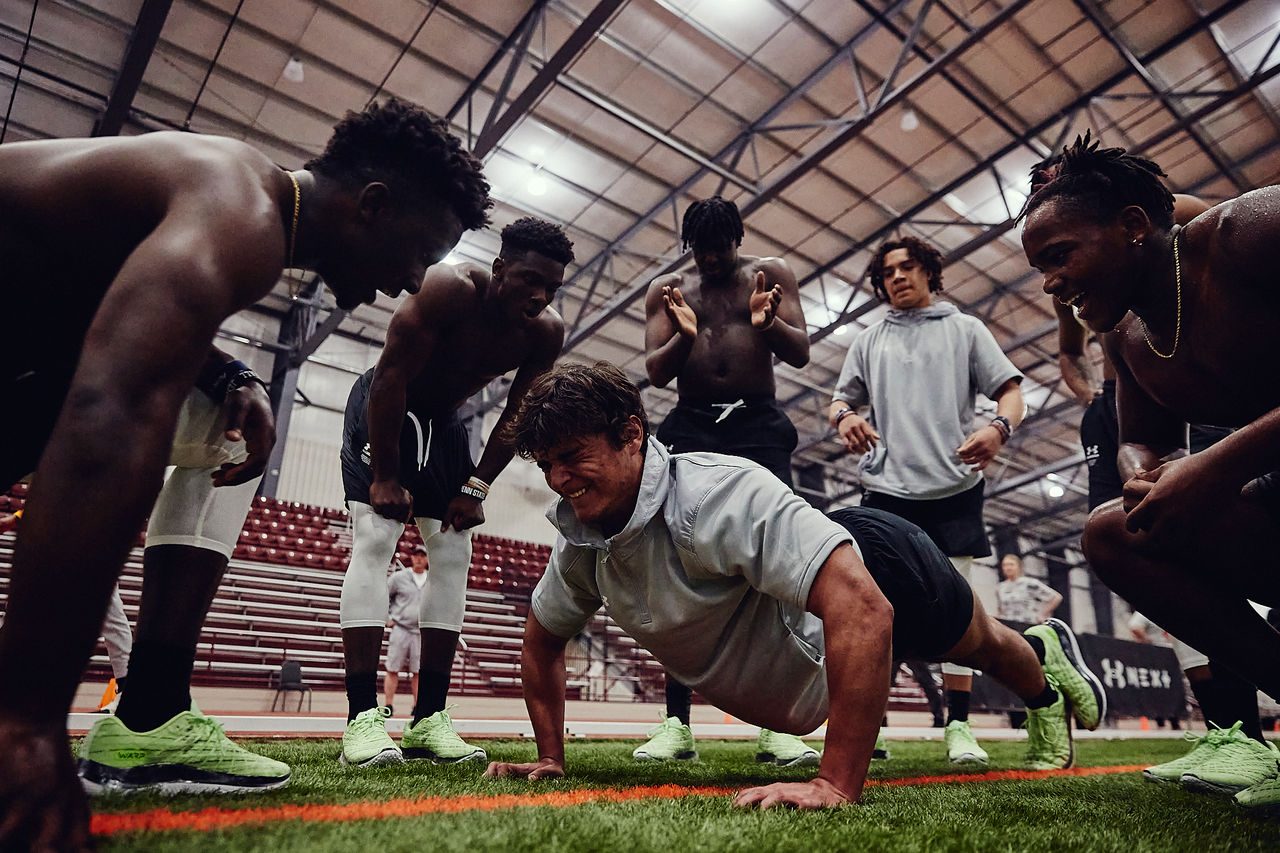


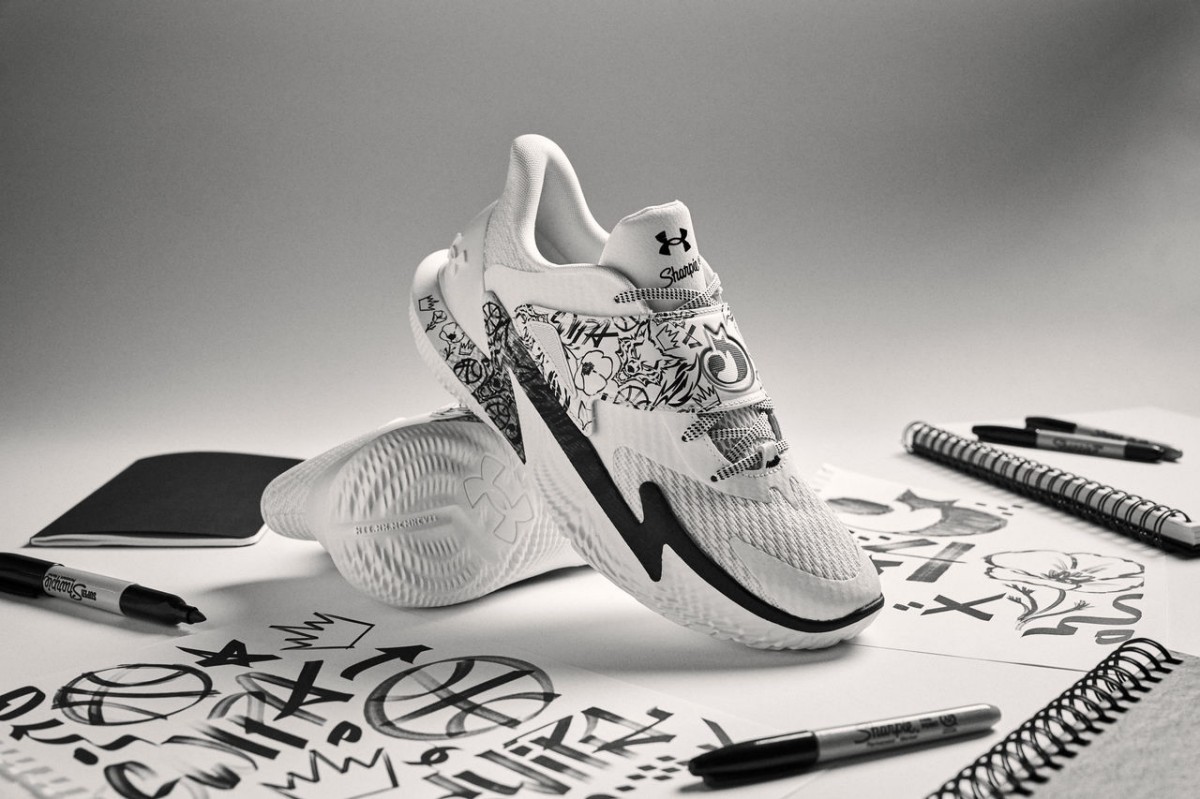
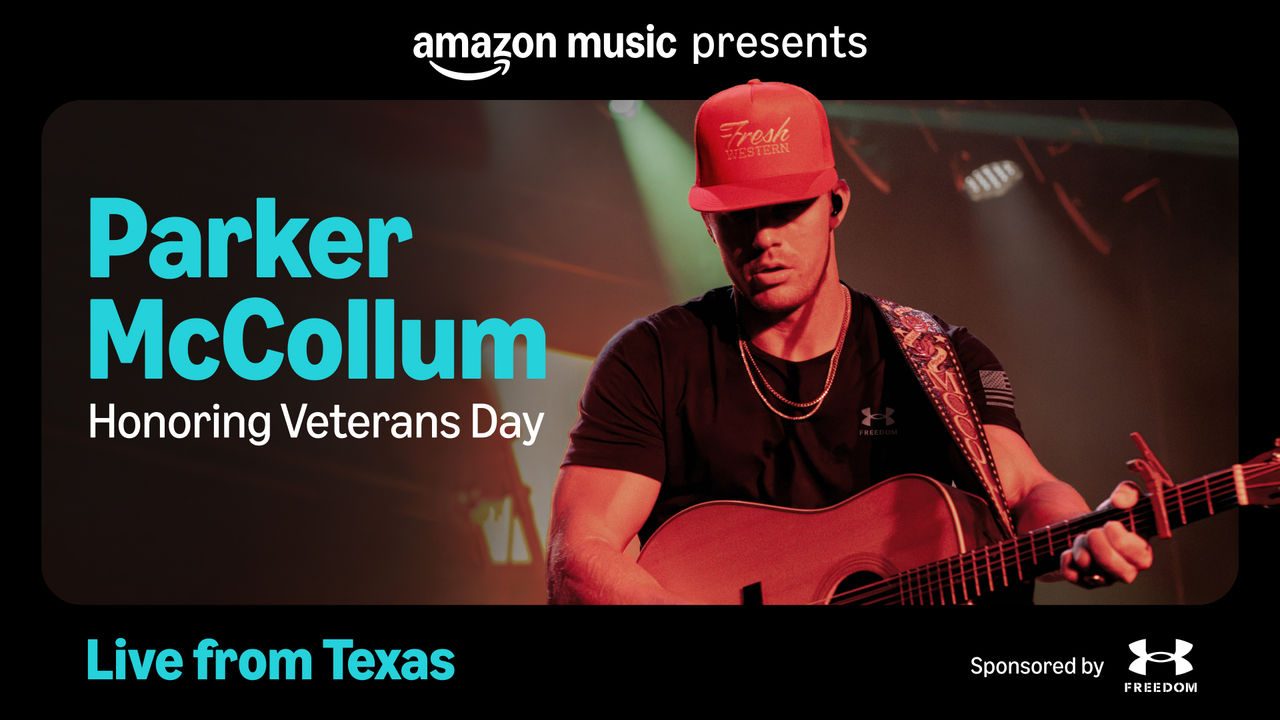


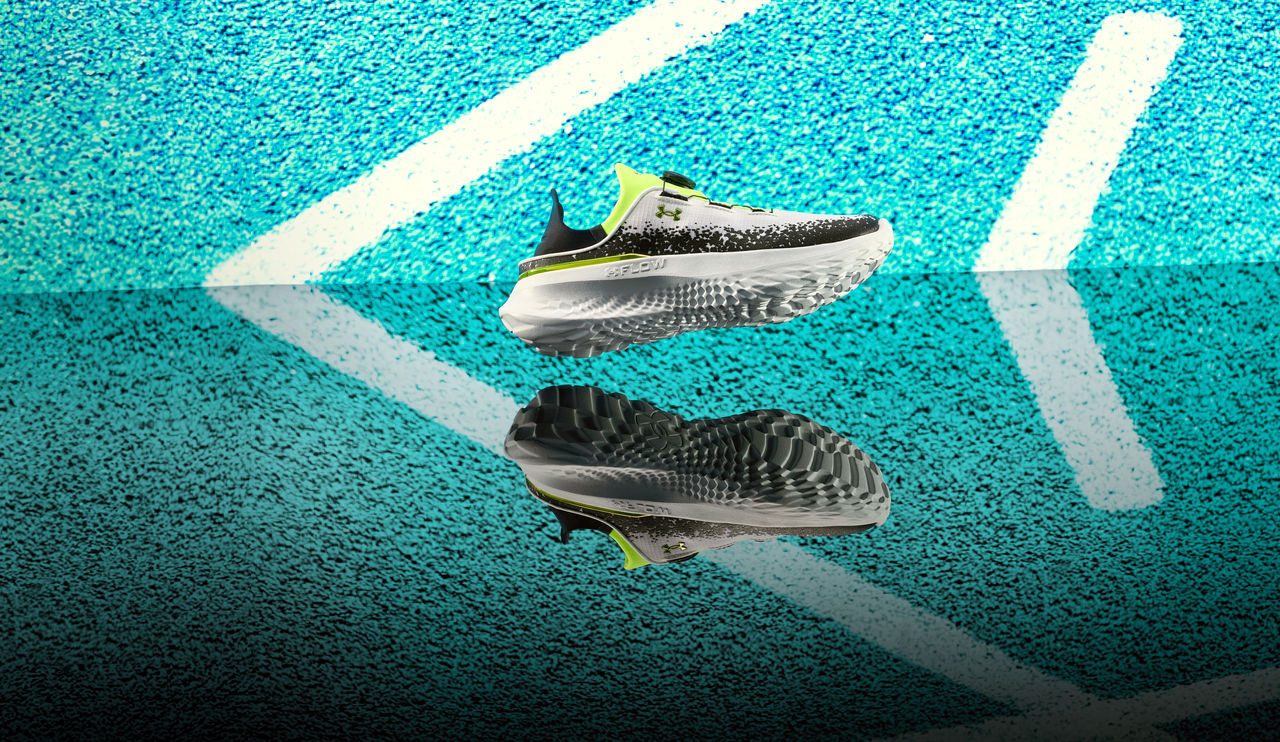
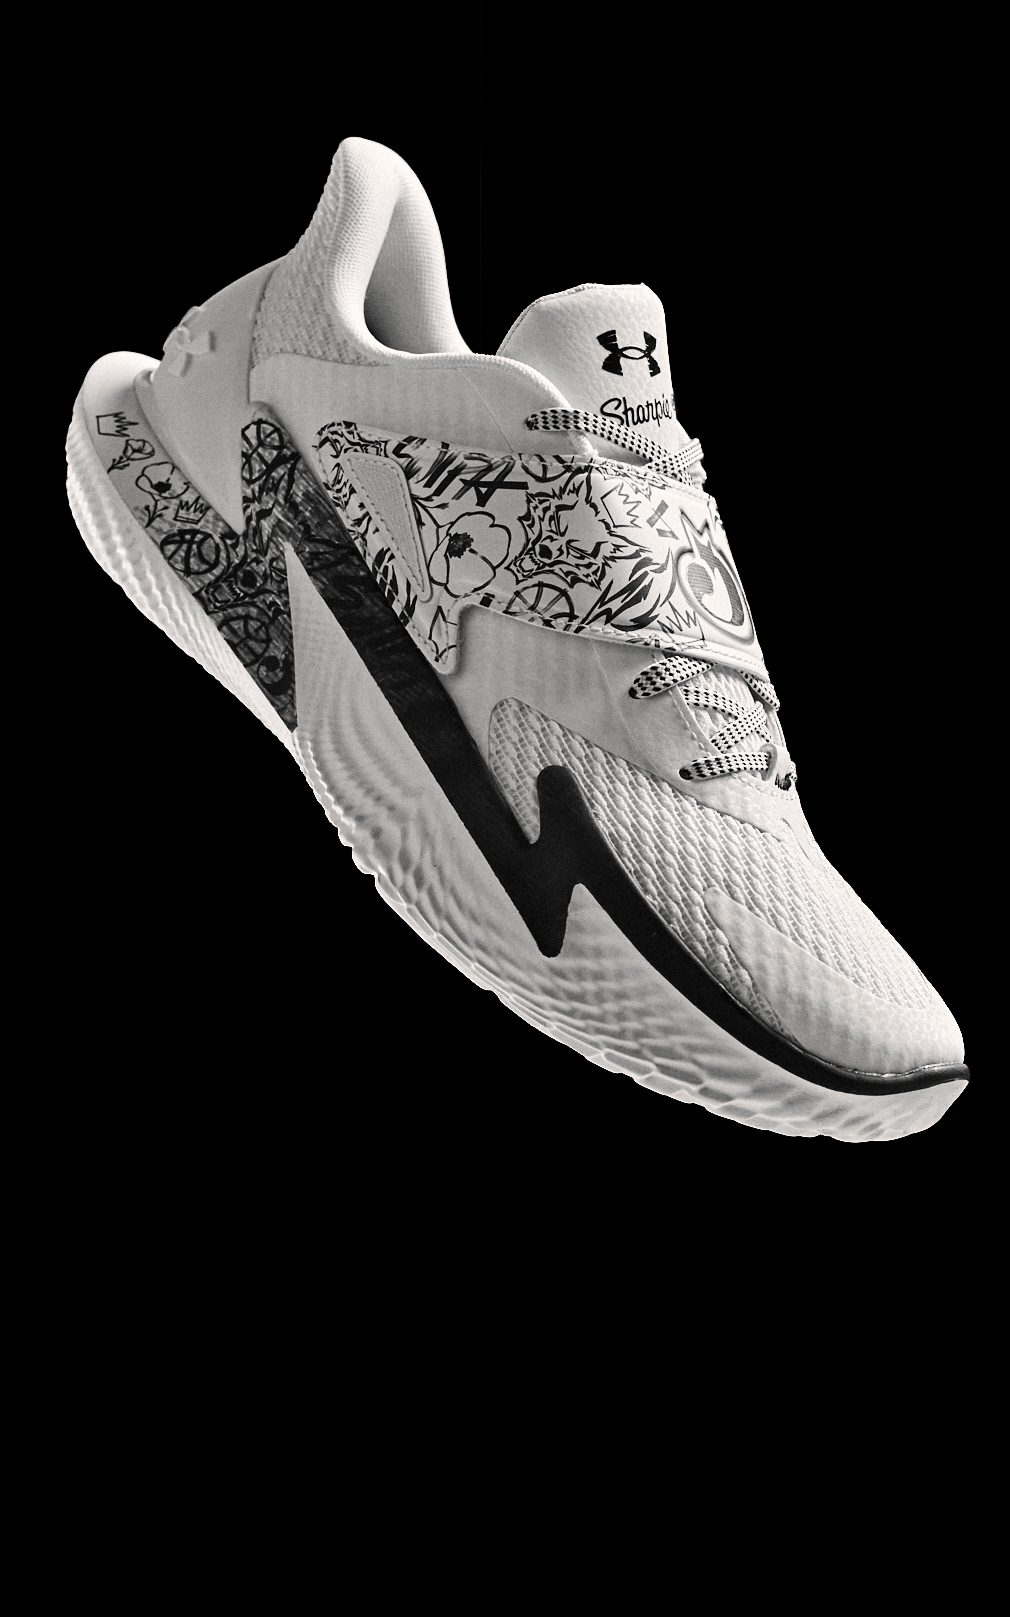


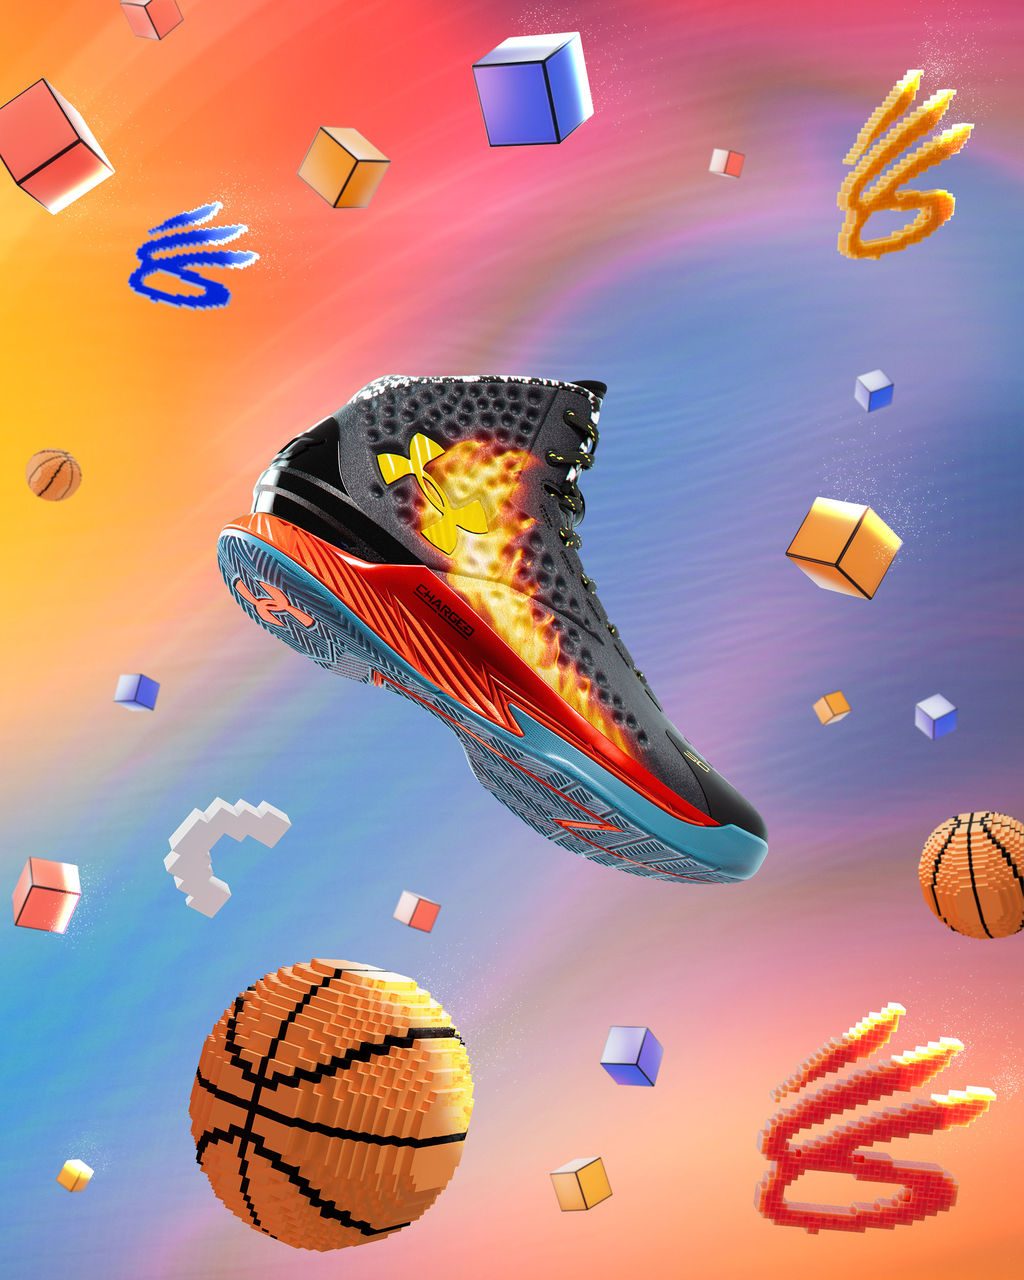
 View original content to download multimedia:
 View original content to download multimedia: