Strong Results Led by Continued Strength in Chicken and Prepared Foods to view the full report. Springdale, Arkansas – August 3, 2026 – Tyson Foods, Inc. (NYSE: TSN), one of the world’s largest food companies and a recognized leader in protein with…
Strong Results Led by Continued Strength in Chicken and Prepared Foods
to view the full report.
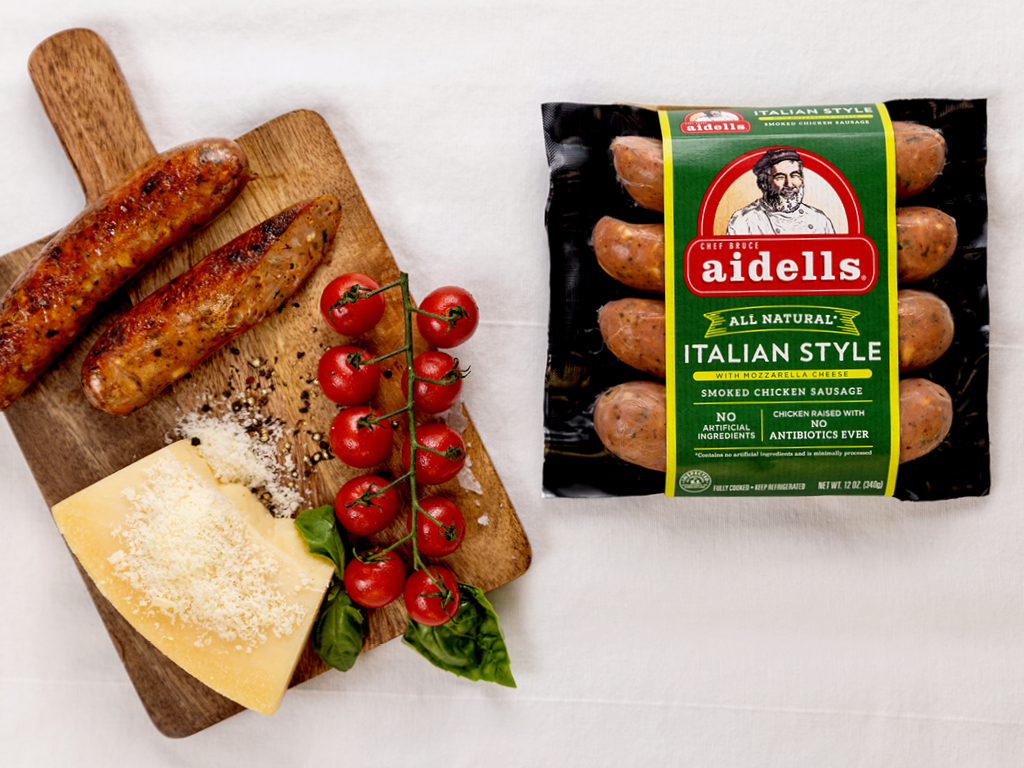
Springdale, Arkansas – August 3, 2026 – Tyson Foods, Inc. (NYSE: TSN), one of the world’s largest food companies and a recognized leader in protein with leading brands including Tyson, Jimmy Dean, Hillshire Farm, Ball Park, Wright, Aidells, ibp and State Fair, reported the following results:
First Nine Months Highlights
-
Sales of $41,834 million, up 3.1% from prior year; Sales up 2.8% excluding the impact of legal contingency accruals of
-
$248 million and $343 million recognized as reduction to Sales in the current year and prior year, respectively
-
GAAP operating income of $1,099 million, up 17% from prior year
-
Adjusted operating income of $1,616 million, down 4% from prior year
-
GAAP EPS of $1.49, up 24% from prior year
-
Adjusted EPS of $2.83, down 5% from prior year
-
Total Company GAAP operating margin of 2.6%
-
Total Company adjusted operating margin (non-GAAP) of 3.8%
-
Liquidity of $4.0 billion as of June 27, 2026
-
Cash provided by operating activities of $1,469 million, down $151 million from prior year
-
Free cash flow (non-GAAP) of $913 million, down $16 million from prior year
-
Reduced total debt $824 million
Third Quarter Highlights
-
Sales of $13,868 million, flat compared to prior year; Sales up 0.6% excluding the impact of a legal contingency accrual of
-
$98 million recognized as reduction to Sales in the current year
-
GAAP operating income of $362 million, up 39% from prior year
-
Adjusted operating income of $547 million, up 8% from prior year
-
GAAP EPS of $0.52, up $0.35 from prior year
-
Adjusted EPS of $0.99, up 9% from prior year
-
Total Company GAAP operating margin of 2.6%
-
Total Company adjusted operating margin (non-GAAP) of 3.9%
"We delivered strong third quarter results, fueled by continued strength in our Chicken and Prepared Foods segments, with seven consecutive quarters of growth in Chicken and continued market share gains by our iconic brands,” said Donnie King, President & CEO of Tyson Foods. “These results reflect the power of our differentiated multi-protein portfolio, strong customer partnerships and focus on operational excellence. We remain confident in our ability to deliver long-term growth and create value for shareholders through disciplined execution of our branded food products strategy."
OUTLOOK
For fiscal 2026, the United States Department of Agriculture (USDA) indicates domestic protein production (beef, pork, chicken and turkey) will increase approximately 1% compared to fiscal 2025 levels. The following is a summary of the updated outlook for each of our segments, as well as an outlook for corporate expenses and amortization, revenue, capital expenditures, net interest expense, liquidity, free cash flow and tax rate for fiscal 2026. As our accounting cycle results in a 53-week year in fiscal 2026 as compared to a 52-week year in fiscal 2025, the fiscal 2026 outlook is based on a comparable 52-week year. Certain of the outlook numbers include adjusted operating income (loss) and segment operating income (loss), as adjusted which are non-GAAP metrics. The Company is not able to reconcile its full-year fiscal 2026 projected adjusted results to its fiscal 2026 projected GAAP results because certain information necessary to calculate such measures on a GAAP basis is unavailable or dependent on the timing of future events outside of our control. Therefore, because of the uncertainty and variability of the nature of and the amount of any potential applicable future adjustments, which could be significant, the Company is unable to provide a reconciliation for these forward-looking non-GAAP measures without unreasonable effort. Adjusted operating income (loss) and segment operating income (loss), as adjusted should not be considered substitutes for operating income (loss) or any other measures of financial performance reported in accordance with GAAP. Investors should rely primarily on the Company’s GAAP results and use non-GAAP financial measures only supplementally in making investment decisions.
Beef
USDA projects domestic production will decrease approximately 3% in fiscal 2026 as compared to fiscal 2025. We anticipate segment operating loss, as adjusted, of $(650) million to $(500) million in fiscal 2026.
Pork
USDA projects domestic production will increase approximately 2% in fiscal 2026 as compared to fiscal 2025. We anticipate segment operating income, as adjusted, of $250 million to $300 million in fiscal 2026.
Chicken
USDA projects chicken production will increase approximately 3% in fiscal 2026 as compared to fiscal 2025. We anticipate segment operating income, as adjusted, of $1.90 billion to $2.05 billion in fiscal 2026.
Prepared Foods
We anticipate segment operating income, as adjusted, of $1.3 billion to $1.35 billion in fiscal 2026.
International
We anticipate segment operating income, as adjusted, of $150 million to $200 million in fiscal 2026.
Corporate Expenses and Amortization
We anticipate corporate expenses and amortization, as adjusted, of $950 million to $975 million in fiscal 2026.
Total Company
We anticipate total company adjusted operating income of $2.1 billion to $2.3 billion for fiscal 2026.
Revenue
We expect sales to be up 2.5% to 3.5% in fiscal 2026 as compared to fiscal 2025.
Capital Expenditures
We expect capital expenditures of $0.7 billion to $0.9 billion in fiscal 2026. Capital expenditures include investments in profit improvement projects as well as projects for maintenance and repairs.
Net Interest Expense
We expect net interest expense to approximate $365 million in fiscal 2026.
Liquidity
We expect total liquidity, which was $4.0 billion as of June 27, 2026, to remain above our minimum liquidity target of $1.0 billion.
Free Cash Flow
We expect free cash flow to be between $1.3 billion and $1.7 billion for fiscal 2026.
Tax Rate
We currently expect our adjusted effective tax rate to approximate 25% in fiscal 2026.
Non-GAAP Financial Measures
Adjusted Operating Income (Loss), Adjusted Income before Income Taxes, Adjusted Income Tax Expense, Adjusted Net Income Attributable to Tyson and Adjusted EPS, EBITDA, Adjusted EBITDA, net debt to EBITDA, net debt to Adjusted EBITDA, Segment Operating Income (Loss), As Adjusted, Corporate Expenses, As Adjusted, Amortization, As Adjusted, and Free Cash Flow are presented as supplemental financial measures in the evaluation of our business that are not required by, or presented in accordance with GAAP. The non-GAAP financial measures are tools intended to assist our management and investors in comparing our performance on a consistent basis for purposes of business decision-making by removing the impact of certain items that management believes do not directly reflect our core operations on an ongoing basis. These non-GAAP measures should not be a substitute for their comparable GAAP financial measures. Investors should rely primarily on our GAAP results and use non-GAAP financial measures only supplementally in making investment decisions. We believe the presentation of these non-GAAP financial measures helps management and investors to assess our operating performance from period to period, including our ability to generate earnings sufficient to service our debt, enhances understanding of our financial performance and highlights operational trends. These measures are widely used by investors and rating agencies in the valuation, comparison, rating and investment recommendations of companies. Our calculation of non-GAAP measures may not be comparable to similarly titled measures reported by other companies and other companies may not define these non-GAAP financial measures in the same way, which may limit their usefulness of comparative measures.
Definitions
EBITDA is defined as net income before interest, income taxes, depreciation and amortization. Net debt to EBITDA (Adjusted EBITDA) represents the ratio of our debt, net of cash, cash equivalents and short-term investments, to EBITDA (and to Adjusted EBITDA). EBITDA, Adjusted EBITDA, net debt to EBITDA and net debt to Adjusted EBITDA are presented as supplemental financial measurements in the evaluation of our business.
Adjusted EBITDA, Adjusted Operating Income (Loss), Adjusted Income before Income Taxes, Adjusted Income Tax Expense, Adjusted Net Income Attributable to Tyson and Adjusted EPS are defined as EBITDA, Operating Income (Loss), Income before Income Taxes, Income Tax Expense, Net Income Attributable to Tyson and diluted earnings per share, respectively, excluding the impacts of any items that management believes do not directly reflect our core operations on an ongoing basis.
Segment Operating Income (Loss) is defined as Operating Income (Loss) less corporate expenses and amortization. Corporate expenses are unallocated general and administrative costs, including the costs of corporate functions, that are shared across multiple segments. Amortization includes amortization generated from intangible assets including brands and trademarks, customer relationships, supply arrangements, patents and intellectual property, land use rights and software.
Segment Operating Income (Loss), As Adjusted is defined as Segment Operating Income (Loss) less the impact of items affecting comparability, which in management's judgment, affect the year-to-year assessment of operating results. Items affecting comparability include restructuring and related charges (including network optimization), plant closure and disposal charges (net of gains), goodwill and intangible impairments, brand and product line discontinuations, facility fire related costs (net of insurance proceeds), and certain non-ordinary course legal, regulatory and other matters.
Corporate Expenses, As Adjusted is defined as Corporate Expenses less the impact of items affecting comparability, which in management's judgment, affect the year-to-year assessment of operating results. Items affecting comparability include restructuring and related charges (including network optimization), corporate asset disposal charges (net of gains) and certain non-ordinary course legal, regulatory and other matters.
Amortization, As Adjusted is defined as Amortization less the impact of items affecting comparability, which in management's judgment, affect the year-to-year assessment of operating results. Items affecting comparability include accelerated amortization related to the discontinuance of intangible assets.
Free Cash Flow is defined as Cash Provided by Operating Activities minus payments for Property, Plant and Equipment.
About Tyson Foods, Inc.
Tyson Foods, Inc. (NYSE: TSN) is a world-class food company and recognized leader in protein. Founded in 1935 by John W. Tyson, it has grown under four generations of family leadership. The Company is unified by this purpose: Tyson Foods. We Feed the World Like Family™ and has a broad portfolio of iconic products and brands including Tyson®, Jimmy Dean®, Hillshire Farm®, Ball Park®, Wright®, State Fair®, Aidells® and ibp®. Tyson Foods is dedicated to bringing high-quality food to every table in the world, safely and affordably, now and for future generations. Headquartered in Springdale, Arkansas, the Company is a member of the S&P 500 and Russell 1000 large capitalization indices. It had approximately 133,000 team members on September 27, 2025. Visit www.tysonfoods.com.
Conference Call Information and Other Selected Data
A conference call to discuss the Company's financial results will be held at 9 a.m. Eastern Monday, August 3, 2026. A link for the webcast of the conference call is available on the Tyson Investor Relations website at https://ir.tyson.com. For those who cannot participate at the scheduled time, a replay of the live webcast and the accompanying slides will be available at https://ir.tyson.com. A telephone replay will also be available until September 3, 2026, toll free at 1-855-669-9658, international toll 1-412-317-0088 or Canada toll free 1-855-669-9658. The replay access code is 7882726. Financial information, such as this news release, as well as other supplemental data, can be accessed from the Company's website at https://ir.tyson.com.
Forward-Looking Statements
Certain information in this release constitutes forward-looking statements as contemplated by the Private Securities Litigation Reform Act of 1995. Such forward-looking statements include, but are not limited to, current views and estimates of our outlook for fiscal 2026, other future economic circumstances, industry conditions in domestic and international markets, our performance and financial results (e.g., debt levels, return on invested capital, value-added product growth, capital expenditures, tax rates, access to foreign markets and dividend policy). These forward-looking statements are subject to a number of factors and uncertainties that could cause our actual results and experiences to differ materially from anticipated results and expectations expressed in such forward-looking statements. We wish to caution readers not to place undue reliance on any forward-looking statements, which are expressly qualified in their entirety by this cautionary statement and speak only as of the date made. We undertake no obligation to update any forward-looking statements, whether as a result of new information, future events or otherwise. Among the factors that may cause actual results and experiences to differ from anticipated results and expectations expressed in such forward-looking statements are the following: (i) the effectiveness of financial excellence programs or operational optimization plans; (ii) access to, and inputs from, foreign markets together with foreign economic conditions, including currency fluctuations, import/export restrictions and foreign politics; (iii) global pandemics have had, and may in the future have, an adverse impact on our business and operations; (iv) cyber attacks, other cyber incidents, security breaches or other disruptions of our information technology systems; (v) risks associated with our failure to consummate favorable acquisition transactions or integrate certain acquisitions’ operations; (vi) the Tyson Limited Partnership’s ability to exercise significant control over the Company; (vii) fluctuations in the cost and availability of inputs and raw materials, such as live cattle, live swine, feed grains (including corn and soybean meal) and energy; (viii) market conditions for finished products, including competition from other global and domestic food processors, supply and pricing of competing products and alternative proteins and demand for alternative proteins; (ix) outbreak of a livestock disease (such as African swine fever (ASF), avian influenza (AI), New World screwworm or bovine spongiform encephalopathy (BSE)), which could have an adverse effect on livestock we own, the availability of livestock we purchase, consumer perception of certain protein products or our ability to conduct our operations; (x) changes in consumer preference and diets and our ability to identify and react to consumer trends; (xi) effectiveness of advertising and marketing programs; (xii) significant marketing plan changes by large customers or loss of one or more large customers; (xiii) our ability to leverage brand value propositions; (xiv) changes in availability and relative costs of labor and contract farmers and our ability to maintain good relationships with team members, labor unions, contract farmers and independent producers providing us livestock; (xv) issues related to food safety, including costs resulting from product recalls, regulatory compliance and any related claims or litigation; (xvi) compliance with and changes to regulations and laws (both domestic and foreign), including changes in accounting standards, tax laws, environmental laws, agricultural laws and occupational, health and safety laws; (xvii) the effect of climate change and any legal or regulatory response thereto; (xviii) adverse results from litigation; (xix) risks associated with leverage, including cost increases due to rising interest rates or changes in debt ratings or outlook; (xx) impairment in the carrying value of our goodwill or indefinite life intangible assets; (xxi) our participation in a multiemployer pension plan; (xxii) volatility in capital markets or interest rates; (xxiii) risks associated with our commodity purchasing activities; (xxiv) the effect of, or changes in, general economic conditions; (xxv) impacts on our operations caused by factors and forces beyond our control, such as natural disasters, fire, bioterrorism, pandemics, armed conflicts or extreme weather; (xxvi) failure to maximize or assert our intellectual property rights; (xxvii) effects related to changes in tax rates, valuation of deferred tax assets and liabilities, or tax laws and their interpretation; and (xxviii) the other risks and uncertainties detailed from time to time in our filings with the Securities and Exchange Commission, including those included under the captions "Risk Factors" and "Management's Discussion and Analysis of Financial Condition and Results of Operations" in our most recent Annual Report on Form 10-K and Quarterly reports on Form 10-Q.
Media Contact: Laura Burns, 479-713-9890
Investor Contact: Jon Kathol, 479-290-4235
Source: Tyson Foods, Inc.