TPR
Fiscal year ends June Quarters are offset from the calendar — Q1 is Jul–Sep

Tapestry, Inc. is a global fashion house of accessories and lifestyle brands. The company operates through two reportable segments: Coach and kate spade new york. Coach, founded in 1941, offers handbags, leather goods, footwear, and accessories, while kate spade new york, launched in 1993, provides handbags, ready-to-wear, jewelry, footwear, and home décor. The company sells products through direct-to-consumer channels, including retail stores, outlet stores, and e-commerce sites, as well as through wholesale and licensing businesses. Key licensing partners include Luxottica, Movado, Interparfums, Case-Mate, Komar, Live Comfortably, Lifeguard Press, and Safilo. The company serves customers in North America, Europe, Greater China, Japan, Australia, and other regions in Asia. In August 2025, the company completed the sale of its Stuart Weitzman business.

Summarised from the company's own disclosures, fiscal year ended Aug 2026

Industry Luxury Goods Homepage tapestry.com
Sector Consumer Cyclical IR page tapestry.com
Tags
handbags, leather goods, accessories, footwear, ready-to-wear, jewelry, home décor, direct-to-consumer, wholesale, licensing, Coach, kate spade new york, Stuart Weitzman, Luxottica, Movado, Interparfums, Case-Mate, Komar, Live Comfortably, Lifeguard Press, Safilo
Press page tapestry.com/newsroom

Metrics

Valuation  
Market cap $ 26.201B
Market cap (USD) $ 26.201B
P/E 17.09
PEG 0.96
P/BV 76.16
P/S 3.20
P/OCF 12.70
P/FCF 13.93
Dividend yield 1.2%
Turnover / mcap —
Returns  
ROE 197.1%
ROI 49.5%
ROIC 50.9%
Profit margin 19.1%
Growth  
Revenue growing Yes
Profits growing Yes
Revenue up 3y Yes
Revenue up 5y No
Earnings growth 3y (net profit CAGR) 17.7%
Quality  
Profitable Yes
Margin expanding Yes
Buying back stock Yes
Diluting (TTM) No
Debt/Equity 754.9%
Podcast bulls (TTM) Sign up
Podcast bears (TTM) Sign up
Podcast sentiment (TTM) Sign up
Podcast sentiment % (TTM) Sign up
News sentiment (TTM) 27
Quality score 47.4%
Insiders  
Buys, 1w Sign up
Buys, 1m Sign up
Buys, 1y Sign up
Sells, 1w Sign up
Sells, 1m Sign up
Sells, 1y Sign up

Sign up to see this company's insider trades

Figure FY 2026 FY 2025 FY 2024 FY 2023 FY 2022 FY 2021 FY 2020 FY 2019 FY 2018 FY 2017 FY 2016 FY 2015 FY 2014 FY 2013 FY 2012 FY 2011 FY 2010 FY 2009 FY 2008 FY 2007 FY 2006 FY 2005 FY 2004 FY 2003 FY 2002 FY 2001 FY 2000
Revenue 8.004B 7.011B 6.671B 6.661B 6.685B 5.746B 4.961B 6.027B 5.88B 4.488B 4.492B 4.192B 4.806B 5.075B 4.763B 4.159B 3.608B 3.23B 3.181B 2.612B 2.112B 1.71B 1.321B 953.226M 719.403M 616.079M 548.918M
Net profit 1.528B 183.2M 816M 936M 856.3M 834.2M -652.1M 643.4M 397.5M 591M 460.5M 402.4M 781.336M 1.034B 1.039B 880.8M 734.94M 623.369M 783.055M 663.665M 494.277M 388.652M 261.748M 146.628M 85.827M 64.03M 38.603M
Free cash flow 1.813B 1.094B 1.147B 791M 759.3M 1.208B 201.6M 517.5M 729.3M 570.7M 362.2M 738.1M 765.823M 1.173B 1.037B 885.527M 909.761M 672.123M 748.641M 638.23M 462.727M 449.671M 380.874M 164.512M 65.173M 92.461M 58.895M

Figure FY 2026 FY 2025 FY 2024 FY 2023 FY 2022 FY 2021 FY 2020 FY 2019 FY 2018 FY 2017 FY 2016 FY 2015 FY 2014 FY 2013 FY 2012 FY 2011 FY 2010 FY 2009 FY 2008 FY 2007 FY 2006 FY 2005 FY 2004 FY 2003 FY 2002 FY 2001 FY 2000
Share price 146.38 87.81 42.79 42.8 30.52 43.48 13.28 31.73 46.71 — 32.49 — — — — — — — — — — — — — — — —
Price performance 12m 0.67 1.05 -0 0.4 -0.3 2.27 -0.58 -0.32 — — — — — — — — — — — — — — — — — — —

Filed figures

Figure Jun 2017 Jun 2018 Jun 2019 Jun 2020 Jun 2021 Jun 2022 Jun 2023 Jun 2024 Jun 2025 Jun 2026
Balance sheet detail
Trade receivables (USD) 268M 314M 298M 193M 200M 252M 212M 228M 239M 237M
↳ YoY growth +9.3% +17.2% -5.1% -35.2% +3.6% +26.0% -16.2% +7.9% +4.9% -0.9%
↳ 5y CAGR +9.0% +12.3% +8.5% -2.5% -4.0% -1.2% -7.6% -5.2% +4.4% +3.4%
Borrowings, current (USD) 0.00 700,000 800,000 712M 0.00 31.2M 25M 303M 16.7M 0.00
Borrowings, non-current (USD) 1.6B 1.62B 1.62B 1.6B 1.6B 1.67B 1.64B 7B 2.4B 2.4B
Lease liabilities (USD) — — 2.32B 2.19B 1.85B 1.57B 1.63B 1.53B 1.5B 1.57B
Cash and deposits (USD) 2.67B 1.24B 969M 1.43B 2.01B 790M 726M 6.14B 1.1B 975M
Intangible assets (USD) 341M 1.73B 1.71B 1.38B 1.37B 1.37B 1.36B 1.35B 720M 717M
Right-of-use assets (USD) — — 2.13B 1.76B 1.5B 1.28B 1.38B 1.31B 1.33B 1.42B
Net debt (borrowings + leases - cash) (USD) -1.07B 375M 648M 3.08B 1.44B 2.48B 2.58B 2.69B 2.82B 3B
Cash flow detail
Operating cash flow (USD) 854M 997M 792M 407M 1.32B 853M 975M 1.26B 1.22B 1.98B
Purchases of property, plant and equipment (USD) -283M -267M -274M -205M -116M -93.9M -184M -109M -123M -166M
Change in receivables (cash effect) (USD) -29.4M -5.6M 25.7M 61.9M -9.6M -96M 44.1M -37.3M 8.8M -12M
Change in inventories (cash effect) (USD) -20M 30.4M -105M -58.6M 32.2M -312M 49.9M 85.8M -108M 35.4M
Change in payables (cash effect) (USD) 8.4M -77.3M -39.8M -91.7M 307M 86.4M -98.1M 49.1M -15M 132M
Dividends paid (cash effect) (USD) -378M -384M -391M -380M 0.00 -264M -283M -321M -299M -326M
Share buybacks (cash effect) (USD) 0.00 0.00 -100M -300M 0.00 -1.6B -704M 0.00 -1.72B -1.55B
Interest paid (cash effect) (USD) -35.4M -63M -45.4M -68.1M -69.7M -67.8M -82.6M -263M -395M -242M
Income taxes paid (cash effect) (USD) -159M -16.4M -184M -87.2M -252M -180M -232M -200M -190M -201M
Share-based compensation (USD) 73.6M 81.3M 84.8M 53.1M 64.1M 72.2M 78.8M 85.9M 87.3M 105M
Operating cash flow before change in receivables (USD) 883M 1B 766M 345M 1.33B 949M 931M 1.29B 1.21B 1.99B
Free cash flow (OCF - PPE - intangibles) (USD) 571M 729M 518M 202M 1.21B 759M 791M 1.15B 1.09B 1.81B
Income detail
Total comprehensive income (USD) 577M 402M 643M -661M 854M 757M 917M 860M 67.9M 1.57B
Comprehensive income to owners (USD) 577M 402M 643M -661M 854M 757M 917M 860M 67.9M 1.57B
Provision for credit losses (USD) — — — — — 19.9M 5.7M 4.3M 3.6M 6.1M
Credit cost ratio (credit losses / average receivables) (%) — — — — — 8.8% 2.5% 2.0% 1.5% 2.6%
Reported Aug 15, 2019 Aug 15, 2019 Nov 7, 2019 Aug 13, 2020 Aug 19, 2021 Aug 15, 2024 Aug 15, 2024 Aug 15, 2024 Aug 14, 2025 Aug 13, 2026

Sign up to see institutional holdings

Sign Up

Podcast Mentions

Sign up to see podcast mentions and sentiment

Sign Up

Analysts and Investors: Christina Colone Bull 6 Bear 0 Results

Global Head of Investor Relations

212/946-7252

[email protected]

Media:

Jennifer Leemann

Global Head of Communications

212/631-2797

[email protected]

TAPESTRY, INC. REPORTS FISCAL 2027 FIRST QUARTER RESULTS AND RAISES FULL YEAR OUTLOOK

Exceeded First Quarter Revenue, Gross Margin, Operating Margin, and EPS Guidance

• Delivered Revenue of $1.9 Billion, an Increase of 11% on a Reported Basis and 12% on a Pro Forma Basis Versus Prior Year, Led by 16% Growth at Coach Brand

• Expanded Gross Margin by 230 Basis Points on a GAAP Basis and 220 Basis Points on a Non-GAAP Basis

• Achieved GAAP Diluted EPS of $1.76, up 38% Versus Prior Year, and Non-GAAP Diluted EPS of $1.82, an Increase of 32% Versus Prior Year

• Returned Approximately $700 Million to Shareholders Through Dividends and Share Repurchases

• Increases Fiscal Year 2027 Capital Return Outlook to $2.0 Billion Driven by Incremental Share Repurchases

• Raises Fiscal Year 2027 Revenue, Operating Margin, and Earnings Outlook

Link to Download Tapestry’s Q1 Earnings Presentation, Including Brand Highlights

New York, November 5, 2026 – Tapestry, Inc.

Post Shuttle

By [email protected]

September 28, 2026 03:09 PM Eastern Daylight Time

In a recent appearance on CNBC’s Mad Money, Tapestry CEO Joanne Crevoiserat shared why our deep understanding of consumers is critical to building lasting brand connections. Throughout the conversation, Joanne reflected on how we earn the loyalty that turns first-time buyers into lifelong customers. In her words, “The best is yet to come. We’re just getting started.”

Watch the full interview below.

Related Articles

Professional woman in blazer with arms crossed beside text On The Opening Bid Unfiltered Podcast

WATCH: Joanne Crevoiserat on the Opening Bid Unfiltered Podcast

Tapestry CEO Joanne Crevoiserat joined Brian Sozzi on Yahoo Finance‘s...

April 15, 2026

Professional woman in blazer with arms crossed beside text On The Opening Bid Unfiltered Podcast

WATCH: Joanne Crevoiserat on the...

Tapestry CEO Joanne Crevoiserat joined Brian Sozzi on Yahoo Finance‘s...

April 15, 2026

Television interview between host and Tapestry executive in luxury handbag boutique; lower-third reads TAPESTRY, INC. (TPR)

Watch: Joanne Crevoiserat on CNBC’s Mad Money

Magic + logic: the foundation of our brands, and why consumers keep falling in...

March 18, 2026

Television interview between host and Tapestry executive in luxury handbag boutique; lower-third reads TAPESTRY, INC. (TPR)

Watch: Joanne Crevoiserat on...

Magic + logic: the foundation of our brands, and why consumers keep falling in...

March 18, 2026

Tapestry Advances Climate Strategy Through Community Solar Partnership

Tapestry is continuing to take meaningful action against its climate commitments...

January 9, 2026

Tapestry Advances Climate Strategy...

Tapestry is continuing to take meaningful action against its climate commitments...

January 9, 2026

Tapestry, Inc. Releases FY2025...

Tapestry, Inc. (NYSE: TPR), the parent company of Coach and kate spade new york,...

December 22, 2025

Decorative footer left border lines

Tapestry Logo

Tapestry on LinkedIn Tapestry on Instagram

BRANDS

ABOUT US

COMPANY

Post Shuttle

By Kristy Williams

September 16, 2026 04:09 PM Eastern Daylight Time

  • Coach and Kate Spade products are now purchasable directly within Google Search, including AI Mode, and the Gemini app
  • Customers complete single-item checkout in a few taps via Google Pay — no website redirect required
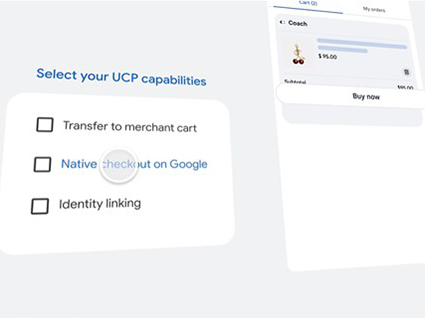
  • Checkout is powered by the Universal Commerce Protocol (UCP), an open industry standard for agentic commerce
  • Each transaction requires explicit consumer approval
  • Live in the U.S. now

NEW YORK–(BUSINESS WIRE)–Sep. 16, 2026– Tapestry (NYSE: TPR), a house of iconic accessories and lifestyle brands, is bringing Coach and Kate Spade into Google’s AI shopping ecosystem, making products purchasable directly from Google Search, including AI Mode, and the Gemini app.

This press release features multimedia. View the full release here: https://www.businesswire.com/news/home/20260916065964/en/

**How It Works
**Now, when consumers discover a Coach or Kate Spade item while using Gemini or AI Mode, a “Buy” button appears inline. After selecting their product, customers can complete checkout in just a few taps using Google Pay. This eliminates the need for website redirects and streamlines the path to purchase.

“Consumer behaviors are always evolving. At one time, discovery happened in a store window or a magazine. Then, it happened on social media. Now it’s happening inside a conversation with AI,” said Joanne Crevoiserat, Chief Executive Officer of Tapestry. “Our goal is for shoppers to find and engage with our brands at the moment when inspiration strikes, whether it be when a consumer passes by one of our stores, peruses our websites, or chats with AI.”

**Flexible Architecture for an Evolving AI Landscape
**Tapestry moved from concept to launch-ready quickly, implementing the Universal Commerce Protocol (UCP), an open industry standard for agentic commerce backed by several major tech and eCommerce companies.

“We built this layer to work with our existing operations today, but it’s truly protocol agnostic, so we can quickly move into new AI environments as consumer behaviors evolve,” said Yang Lu, Chief Information and Digital Officer at Tapestry. “That’s possible because of the strategic investments we’ve made in technology capabilities and infrastructure as well as the strength of our data and consumer insights engine.”

**Consumer Control and Transaction Security
**Importantly, each transaction is secure through Google Pay, ensuring a purchase requires a consumer’s explicit approval. This keeps shoppers in control of every transaction as AI plays a growing role in how people discover and buy products.

**Availability and Rollout
**UCP-powered checkout is now live in the U.S., with plans to expand across geographies in the future.

**Part of Tapestry’s Broader AI and Innovation Strategy
**This launch is part of Tapestry’s broader AI strategy, which focuses on using artificial intelligence to help power the company’s growth by connecting its brands more directly to consumers, strengthening business capabilities, and enabling transformation across its teams and operations.

**About Tapestry, Inc.
**Our global house of iconic accessories and lifestyle brands unites the magic of Coach and kate spade new york. Together, we stretch what’s possible – advancing brands further than they could go alone, expanding their reach to new geographies and generations. Inspired by our consumers, we create experiences and products that build lasting brand love and elevate everyday life. To learn more about Tapestry, please visit www.tapestry.com . For important news and information regarding Tapestry, visit the Investor Relations section of our website at www.tapestry.com/investors . In addition, investors should continue to review our news releases and filings with the SEC. We use each of these channels of distribution as primary channels for publishing key information to our investors, some of which may contain material and previously non-public information. The Company’s common stock is traded on the New York Stock Exchange under the symbol TPR.

View source version on businesswire.com: https://www.businesswire.com/news/home/20260916065964/en/

Media Contact:
Jackie Albano
Senior Director, Communications
212/656-9645
[email protected]

Source: Tapestry

Related Articles

Tapestry’s Culture of Curiosity Turns AI Experimentation into Business...

At its second annual Future Now AI Summit, employees across the company turning...

August 7, 2026

Tapestry’s Culture of...

At its second annual Future Now AI Summit, employees across the company turning...

August 7, 2026

Tapestry Awarded U.S. Patent for Innovative AI Platform: Mira

This is the second technology patent secured by Tapestry; Mira helps teams turn...

May 11, 2026

Tapestry Awarded U.S. Patent for...

This is the second technology patent secured by Tapestry; Mira helps teams turn...

May 11, 2026

Decorative footer left border lines

Tapestry Logo

Tapestry on LinkedIn Tapestry on Instagram

BRANDS

ABOUT US

COMPANY

Prompts

Tapestry, Inc. (ticker TPR), listed in United States.

Company History

Date Change Detail
Oct 31, 2017 Renamed COACH INC → TAPESTRY, INC.
May 1, 2017 Acquired Acquired Kate Spade & Co (CIK 352363). Its filings from before the deal are on its own company page, not shown here.

ETFs Holding Tapestry, Inc.

ETF Weight in ETF Shares Market value As of
CTEF 4.17% 191,634 $ 24.35M Nov 18, 2026
RJDI 4.04% 27,719 $ 4.058M Jun 30, 2026
BCUS 3.36% 36,945 $ 4.9M Nov 12, 2026
JMID 2.40% 3,717 $ 566.359K Jul 31, 2026
ABFL 2.32% 79,937 $ 12.18M Jul 31, 2026
QUSA 2.31% 3,418 $ 454.423K Nov 17, 2026
SMRI 2.23% 121,898 $ 15.49M Nov 18, 2026
FGSI 2.18% 333 $ 44.402K Nov 11, 2026
SEIM 2.12% 217,682 $ 31.864M Jun 30, 2026
CARK 2.10% 44,071 $ 6.715M Jul 31, 2026
WBIL 2.03% 4,229 $ 619.041K Jun 30, 2026
JDVL 1.75% 105,459 $ 15.437M Jun 30, 2026
FEMG 1.36% 621 $ 90.902K Jun 30, 2026
WBIF 1.15% 1,841 $ 269.486K Jun 30, 2026
BRES 1.03% 49,284 $ 6.26M Nov 18, 2026
SURE 0.95% 4,293 $ 545.383K Nov 17, 2026
WBIG 0.86% 1,609 $ 235.525K Jun 30, 2026
GINX 0.71% 6,117 $ 754.777K Aug 31, 2026
IEDI 0.68% 1,243 $ 189.396K Jul 31, 2026
FMDE 0.67% 336,416 $ 49.245M Jun 30, 2026
WCEO 0.65% 426 $ 64.91K Jul 31, 2026
BRNY 0.64% 28,016 $ 3.56M Nov 18, 2026
REMC 0.61% 141 $ 20.64K Jun 30, 2026
SGLC 0.54% 9,238 $ 1.14M Aug 31, 2026
IALT 0.50% 296,658 $ 39.441M Nov 16, 2026
FFLV 0.50% 537 $ 81.823K Jul 31, 2026
GEW 0.46% 5,447 $ 672.105K Aug 31, 2026
AFMC 0.45% 8,904 $ 1.184M Nov 16, 2026
DIVN 0.40% 9,981 $ 1.232M Aug 31, 2026
GQI 0.39% 6,840 $ 1.001M Jun 30, 2026
SXQG 0.38% 1,700 $ 225.471K Nov 12, 2026
OASC 0.37% 2,851 $ 351.785K Aug 31, 2026
LSVD 0.35% 14,808 $ 2.256M Jul 31, 2026
FFSM 0.33% 32,100 $ 4.891M Jul 31, 2026
LGDX 0.31% 3,186 $ 423.579K Nov 17, 2026
AVMC 0.29% 12,105 $ 1.609M Nov 16, 2026
AFLG 0.27% 18,973 $ 2.522M Nov 16, 2026
FEMV 0.26% 93 $ 13.613K Jun 30, 2026
IQSZ 0.26% 2,939 $ 447.815K Jul 31, 2026
SDVD 0.23% 16,064 $ 2.142M Nov 11, 2026
VFMO 0.22% 34,017 $ 4.197M Aug 31, 2026
AVSU 0.21% 7,481 $ 994.599K Nov 16, 2026
SFGV 0.21% 18,867 $ 2.4M Nov 18, 2026
DUHP 0.21% 304,591 $ 40.398M Nov 12, 2026
INFO 0.20% 16,768 $ 2.22M Nov 13, 2026
FEAC 0.20% 353 $ 51.672K Jun 30, 2026
VFMF 0.19% 15,045 $ 1.856M Aug 31, 2026
LCTU 0.19% 16,525 $ 2.197M Nov 16, 2026
AVMV 0.17% 10,582 $ 1.407M Nov 16, 2026
FLSP 0.17% 10,923 $ 1.599M Jun 30, 2026
CLSE 0.17% 12,218 $ 1.508M Aug 31, 2026
AVUQ 0.13% 4,039 $ 536.985K Nov 16, 2026
DFAC 0.13% 838,252 $ 111.177M Nov 12, 2026
HBTA 0.11% 2,243 $ 276.764K Aug 31, 2026
DCOR 0.10% 341,579 $ 45.304M Nov 12, 2026
AFGR 0.10% 635 $ 84.423K Nov 16, 2026
FBCG 0.10% 44,186 $ 6.733M Jul 31, 2026
AVUS 0.09% 100,948 $ 13.421M Nov 16, 2026
DXUV 0.09% 41,269 $ 5.474M Nov 12, 2026
ACIO 0.09% 13,247 $ 2.018M Jul 31, 2026
ADME 0.09% 1,647 $ 250.953K Jul 31, 2026
MSSM 0.08% 4,846 $ 597.948K Aug 31, 2026
BDVL 0.08% 10,783 $ 1.434M Nov 16, 2026
DFVX 0.07% 3,111 $ 412.612K Nov 12, 2026
AVLC 0.07% 8,769 $ 1.166M Nov 16, 2026
ACVF 0.07% 682 $ 103.916K Jul 31, 2026
DFSU 0.06% 11,020 $ 1.462M Nov 12, 2026
XMAG 0.06% 1,000 $ 132.63K Nov 13, 2026
DYNF 0.05% 152,337 $ 20.253M Nov 16, 2026
AAUS 0.05% 1,948 $ 250K Nov 18, 2026
VOXP 0.05% 18 $ 2,742.66 Jul 31, 2026
DFAU 0.04% 41,110 $ 5.452M Nov 12, 2026
JUSA 0.04% 2,715 $ 344.914K Nov 17, 2026
HCMT 0.04% 1,406 $ 214.232K Jul 31, 2026
DFUS 0.04% 61,315 $ 8.132M Nov 12, 2026
TACU 0.04% 49 $ 6,514.55 Nov 17, 2026
GSPY 0.03% 1,415 $ 188.124K Nov 17, 2026
NTSD 0.03% 62 $ 9,075.56 Jun 30, 2026
MODL 0.02% 1,723 $ 252.213K Jun 30, 2026
MSLC 0.02% 7,958 $ 981.938K Aug 31, 2026
NTSX 0.02% 2,241 $ 328.038K Jun 30, 2026
GDE 0.02% 831 $ 102.537K Aug 31, 2026
EBI 0.02% 1,074 $ 132.521K Aug 31, 2026
CSHP 0.01% 353 $ 46.931K Nov 16, 2026
NPFE 0.00% 12 $ 1,828.44 Jul 31, 2026
CORO 0.00% 126 $ 16.719K Nov 16, 2026
NTRL 0.00% 1,411 $ 0.00 Nov 16, 2026
THRO 0.00% 24 $ 3,190.80 Nov 16, 2026