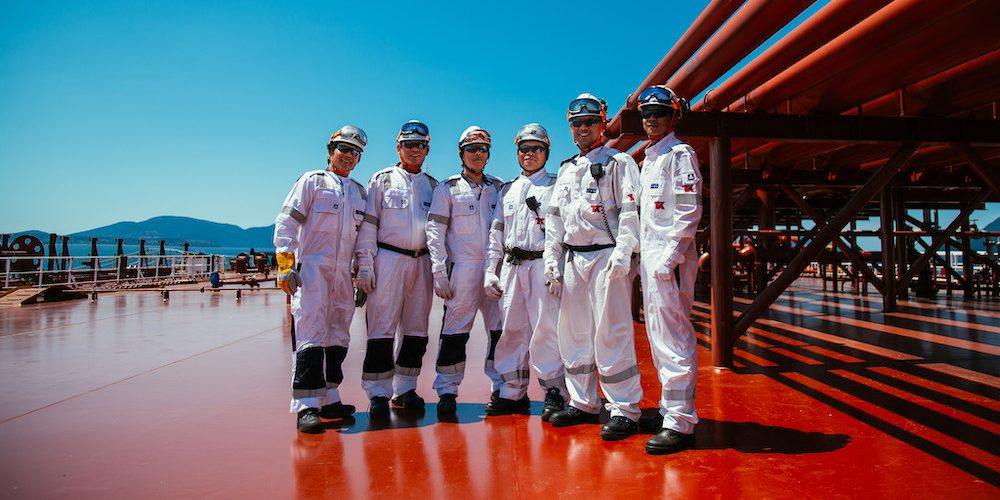
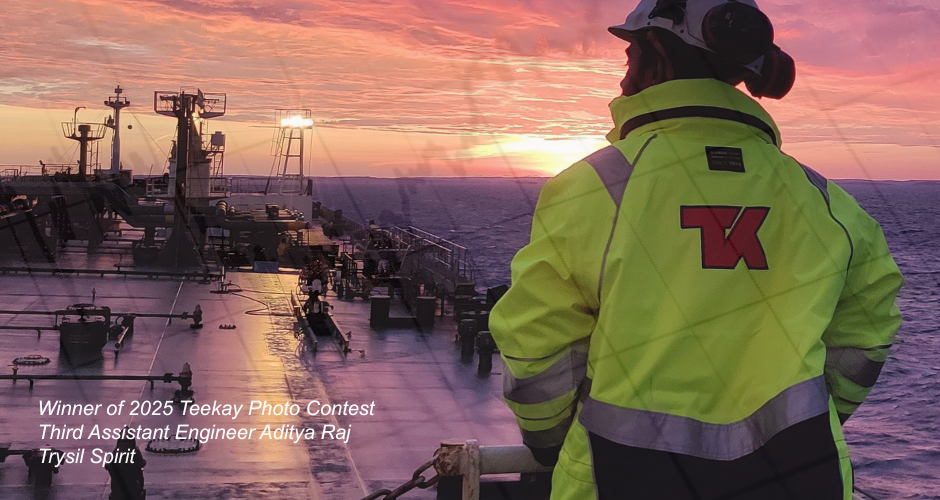
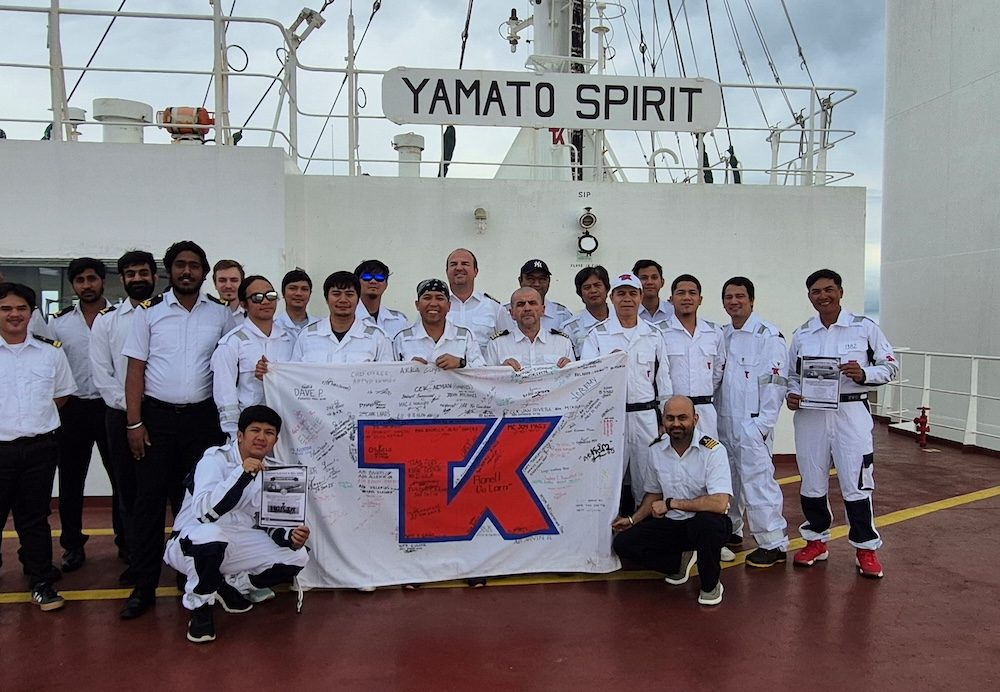
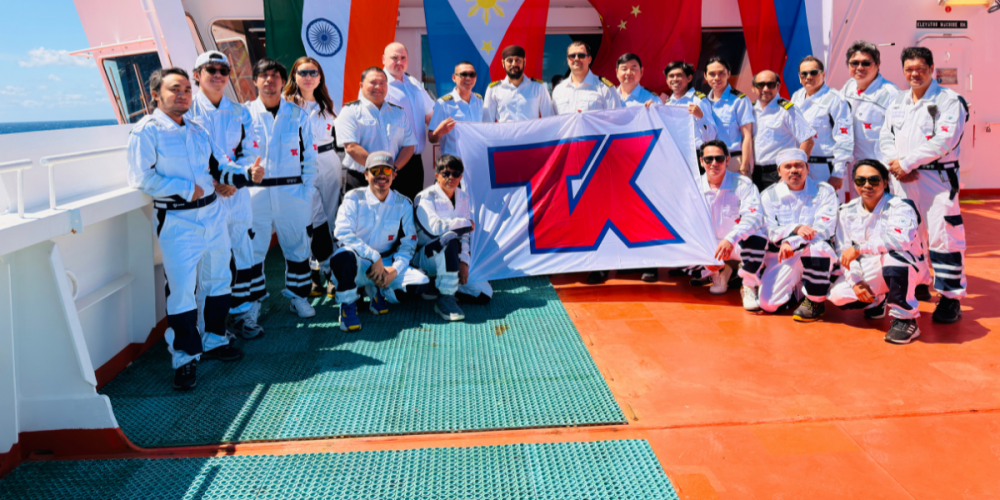
Teekay Tankers Ltd. is an international provider of marine transportation services to global oil industries. The company owns and operates a fleet of crude oil and product tankers, including Suezmax, Aframax, LR2, and VLCC vessels, employing a chartering strategy that combines spot market trading with fixed-rate time charters. In addition to its core tanker operations, the company provides ship-to-ship (STS) transfer services, lightering support, and operational and maintenance marine services through its Australian operations. Teekay Tankers also conducts in-house tanker commercial and technical management operations. The company was formed in October 2007 by Teekay Corporation and completed its initial public offering in December 2007. It serves customers in the global energy sector, including government entities and energy companies in Australia.

Summarised from the company's own disclosures, fiscal year ended Mar 2026

Industry Marine Shipping Homepage teekay.com
Sector Industrials IR page teekay.com/investors/teekay-corporation/financials-presentations
Tags
crude oil tankers, product tankers, ship-to-ship transfer, lightering services, marine transportation, tanker chartering, technical management, commercial management, Teekay Tanker Operations Ltd., Tanker Investments Ltd., Teekay Corporation, I.M. Skaugen SE, Wah Kwong Maritime Transport Holdings Limited
Press page teekay.com/investors/teekay-corporation/news-releases

Metrics

Valuation  
Market cap $ 3.349B
Market cap (USD) $ 3.349B
P/E 9.61
PEG 0.63
P/BV 1.64
P/S 3.52
P/OCF 10.95
P/FCF 28.96
Dividend yield 2.1%
Turnover / mcap —
Returns  
ROE 18.5%
ROI 28.5%
ROIC 25.1%
Profit margin 36.9%
Growth  
Revenue growing No
Profits growing No
Revenue up 3y No
Revenue up 5y No
Earnings growth 3y (net profit CAGR) 15.3%
Quality  
Profitable Yes
Margin expanding No
Buying back stock No
Diluting (TTM) No
Debt/Equity —
Podcast bulls (TTM) Sign up
Podcast bears (TTM) Sign up
Podcast sentiment (TTM) Sign up
Podcast sentiment % (TTM) Sign up
News sentiment (TTM) 33
Quality score 0%
Insiders  
Buys, 1w Sign up
Buys, 1m Sign up
Buys, 1y Sign up
Sells, 1w Sign up
Sells, 1m Sign up
Sells, 1y Sign up

Sign up to see this company's insider trades

Figure FY 2025 FY 2024 FY 2023 FY 2022 FY 2021 FY 2020 FY 2019 FY 2018 FY 2017 FY 2016 FY 2015 FY 2014 FY 2013 FY 2012 FY 2011 FY 2010 FY 2009
Revenue 951.797M 1.229B 1.364B 1.063B 542.367M 886.434M 943.917M 755.763M 431.178M 526.896M 514.193M 235.593M 170.087M 197.429M 120.997M 139.479M 159.69M
Net profit 351.186M 403.667M 513.671M 229.086M -242.372M 87.317M 41.362M -52.548M -58.023M 62.855M 176.927M 57.142M -8.138M -370.181M -9.065M 16.309M 42.084M
Free cash flow 115.635M 401.408M 615.874M 177.835M -128.759M 331.918M 106.033M -13.09M 74.908M 209.976M -445.211M — — — — — 86.73M

Figure FY 2025 FY 2024 FY 2023 FY 2022 FY 2021 FY 2020 FY 2019 FY 2018 FY 2017 FY 2016 FY 2015 FY 2014 FY 2013 FY 2012 FY 2011 FY 2010 FY 2009
Share price 53.42 39.79 49.97 30.81 10.9 11.01 23.97 0.93 1.4 2.26 6.88 5.06 3.93 2.9 9.4 8.53 8.53
Price performance 12m 0.34 -0.2 0.62 1.83 -0.01 -0.54 24.84 -0.34 -0.38 -0.67 0.36 0.29 0.36 -0.69 0.1 0 —

Filed figures

Figure Dec 2016 Dec 2017 Dec 2018 Dec 2019 Dec 2020 Dec 2021 Dec 2022 Dec 2023 Dec 2024 Dec 2025
Balance sheet detail
Trade receivables (USD) 30.2M 19.3M 17.4M 95.6M 36.2M 41.1M 117M 99.9M 82.4M 82.8M
↳ YoY growth +6.8% -36.2% -10.0% +450.8% -62.2% +13.5% +184.1% -14.4% -17.5% +0.4%
↳ 5y CAGR +186.4% +33.7% +32.5% +87.0% +5.0% +6.3% +43.3% +41.9% -2.9% +18.0%
Borrowings, current (USD) 171M 167M 106M 93.6M 20.9M 40.5M 0.00 — — —
Borrowings, non-current (USD) 762M 786M 629M 516M 232M 305M 0.00 — — —
Lease liabilities (USD) — — 375M 434M 364M 309M 576M 216M 53.6M 38.2M
Cash and deposits (USD) 68.1M 71.4M 54.9M 88.8M 97.2M 50.6M 181M 365M 512M 831M
Intangible assets (USD) 17.7M 14.6M 11.6M 2.55M 1.99M 1.49M 1.05M 658,000 307,000 0.00
Right-of-use assets (USD) — — 0.00 19.6M 2.53M 14.3M 42.9M 76.3M 52.2M 38.2M
Net debt (borrowings + leases - cash) (USD) 865M 881M 680M 955M 520M 603M 396M — — —
Cash flow detail
Operating cash flow (USD) 210M 79.6M -7.26M 118M 348M -107M 193M 626M 472M 306M
Purchases of property, plant and equipment (USD) 0.00 -4.73M -5.83M -11.6M -16M -21.4M -15.4M -10.2M -70.5M -190M
Change in inventories (cash effect) (USD) — -8.32M 15.6M 28.6M -13.6M 17.6M 11.8M -6.15M 6.13M 7.97M
Change in payables (cash effect) (USD) -21.3M -14M 9.78M 83.2M 50M 13.9M -21.1M 15.9M -9.85M -3.12M
Dividends paid (cash effect) (USD) -46.8M -20.7M -8.05M 0.00 0.00 0.00 0.00 -59.5M -103M -69M
Interest paid (cash effect) (USD) -38.5M -26.4M -47.6M -61.8M -47.9M -34.3M -29.4M -20.2M -5.6M -1.9M
Income taxes paid (cash effect) (USD) — — — — — — — -5.3M -6.2M -7.4M
Free cash flow (OCF - PPE - intangibles) (USD) 210M 74.9M -13.1M 106M 332M -129M 178M 616M 401M 116M
Income detail
Total comprehensive income (USD) — — — — — — 236M 522M 404M 351M
Comprehensive income to owners (USD) — — — — — — 236M 522M 404M 351M
Reported Apr 26, 2017 Apr 15, 2020 Apr 15, 2020 Apr 15, 2020 Apr 1, 2021 Mar 15, 2024 Mar 14, 2025 Mar 13, 2026 Mar 13, 2026 Mar 13, 2026

Sign up to see institutional holdings

Sign Up

Podcast Mentions

Sign up to see podcast mentions and sentiment

Sign Up

Item 1 — Information Contained in this Form 6-K Report

Attached as Exhibit 1 is a copy of an announcement of Teekay Tankers Ltd. dated November 11, 2026.

Exhibit 1

THIRD QUARTER 2026 RESULTS

Highlights
•Reported GAAP net income of $195.2 million, or $5.60 per share, and adjusted net income(1) of $175.8 million, or $5.04 per share, in the third quarter of 2026 (excluding items listed in Appendix A to this release).
•Spot tanker rates have remained at historic highs, with the third quarter of 2026 Suezmax and Aframax / Long Range 2 (or LR2) spot rates averaging $106,400 per day and $67,600 per day, respectively. So far in the fourth quarter of 2026, Suezmax and Aframax / LR2 spot rates are setting new records, averaging $272,000 per day and $208,300 per day for approximately 63% and 53% of fourth quarter spot days booked to date, respectively.

October 27, 2026

HAMILTON, Bermuda, Oct. 27, 2026 (GLOBE NEWSWIRE) — Teekay Corporation Ltd. (Teekay) (NYSE:TK) and Teekay Tankers Ltd. (Teekay Tankers) (NYSE:TNK) (collectively, the Teekay Group) plan to release their financial results for the third quarter of 2026 after market closes on Wednesday, November 11, 2026.

The Teekay Group plans to host a conference call on Thursday, November 12, 2026 at 11:00 a.m. (ET) to discuss its results for the third quarter of 2026. All shareholders and interested parties are invited to listen to the live conference call by choosing from the following options:

  • By dialing 1(800) 330-6710, or 1(647) 361-1999 if outside of North America, and quoting conference ID code 5692912.
  • By accessing the webcast, which will be available on the Teekay Group’s website at www.teekay.com (the archive will remain on the website for a period of one year).

The accompanying Teekay Group third quarter of 2026 earnings presentation will also be available at www.teekay.com in advance of the conference call start time.

About Teekay

Teekay is a leading provider of international crude oil marine transportation and marine services. Teekay provides these services through its controlling ownership interest in Teekay Tankers, a leading owner and operator of mid-sized crude tankers. Teekay Tankers has a fleet of 34 double-hull tankers (including 14 Suezmax tankers, 18 Aframax / LR2 tankers, and two Suezmax tanker newbuilds) and has three time chartered-in tankers. In addition, Teekay Tankers manages and operates vessels for the Australian government and Australian energy companies as part of the marine services provided by Teekay Tankers and owns a ship-to-ship transfer business that performs full-service lightering and lightering support operations in the U.S. Gulf and Caribbean.

Teekay’s common shares trade on the New York Stock Exchange under the symbol “TK”.

About Teekay Tankers

Teekay Tankers has a fleet of 34 double-hull tankers (including 14 Suezmax tankers, 18 Aframax / LR2 tankers, and two Suezmax tanker newbuilds) and has three time chartered-in tankers. Teekay Tankers’ vessels are typically employed through a mix of spot tanker market trading and short- or medium-term fixed-rate time charter contracts. In addition, Teekay Tankers manages and operates vessels for the Australian Government and Australian energy companies as part of the marine services provided by the Company and owns a ship-to-ship transfer business that performs full service lightering and lightering support operations in the U.S. Gulf and Caribbean. Teekay Tankers was formed in December 2007 by Teekay Corporation Ltd.

Teekay Tankers’ Class A common shares trade on the New York Stock Exchange under the symbol “TNK.”

For Investor Relations enquiries contact:

E-mail: [email protected]

Website: www.teekay.com

Explore Stories

Reset

Recap: Teekay Group First Quarter 2026 Earnings Results

May 14, 2026

Blog

Load more stories

Sign up to Receive Communications From Teekay

Subscribe

© 1973–2026 Teekay Corporation Ltd.

Designed by Blender

By using this site you agree to the use of cookies for analytics and personalized content.Accept Read more

Item 1 — Information Contained in this Form 6-K Report

Attached as Exhibit 1 is a copy of an announcement of Teekay Tankers Ltd. dated July 29, 2026.

Exhibit 1

SECOND QUARTER 2026 RESULTS

Highlights
•Reported GAAP net income of $225.9 million, or $6.49 per share, and adjusted net income(1) of $193.6 million, or $5.56 per share, in the second quarter of 2026 (excluding items listed in Appendix A to this release), which is the highest quarterly adjusted net income in the Company's history.
•Record second quarter of 2026 spot rates with Suezmax tankers and Aframax/LR2 tankers averaging $109,200 per day and $74,100 per day, respectively. To-date in the third quarter of 2026, Suezmax tankers and Aframax/LR2 tankers spot rates are averaging $104,800 per day and $59,900 per day, respectively, for approximately 44% of third quarter spot days booked to date.

Prompts

Teekay Tankers Ltd. (ticker TNK), listed in United States.

ETFs Holding Teekay Tankers Ltd.

ETF Weight in ETF Shares Market value As of
MLPI 3.46% 323,487 $ 31.398M Sep 30, 2026
RNIN 1.11% 26,572 $ 2.33M Nov 18, 2026
FTKI 1.10% 3,181 $ 278.719K Nov 16, 2026
AFSM 0.75% 12,417 $ 1.088M Nov 16, 2026
BSVO 0.65% 177,942 $ 15.58M Nov 18, 2026
DSMC 0.60% 11,841 $ 768.126K Jun 30, 2026
LITL 0.47% 306 $ 26.799K Nov 17, 2026
QIDX 0.45% 2,202 $ 174.773K Jul 31, 2026
SCDS 0.40% 418 $ 36.608K Nov 17, 2026
FSEV 0.30% 313 $ 20.304K Jun 30, 2026
AVUV 0.27% 971,835 $ 85.152M Nov 16, 2026
IVSS 0.22% 903 $ 58.578K Jun 30, 2026
DFSV 0.20% 617,816 $ 54.677M Nov 12, 2026
FESM 0.18% 159,877 $ 10.371M Jun 30, 2026
VFMF 0.17% 18,772 $ 1.683M Aug 31, 2026
RUSC 0.15% 1,873 $ 121.502K Jun 30, 2026
SYZ 0.14% 1,528 $ 99.121K Jun 30, 2026
AVSC 0.14% 49,330 $ 4.322M Nov 16, 2026
DFAT 0.14% 495,712 $ 43.871M Nov 12, 2026
PSC 0.14% 49,384 $ 3.204M Jun 30, 2026
VFMO 0.11% 24,444 $ 2.191M Aug 31, 2026
VFVA 0.09% 9,996 $ 896.041K Aug 31, 2026
EBI 0.06% 4,900 $ 439.236K Aug 31, 2026
RESM 0.06% 35 $ 2,270.45 Jun 30, 2026
DFAS 0.06% 229,535 $ 20.314M Nov 12, 2026
AVIE 0.03% 58 $ 5,081.96 Nov 16, 2026
DXUV 0.03% 19,741 $ 1.747M Nov 12, 2026
SFGV 0.02% 2,565 $ 220K Nov 18, 2026
DFAC 0.02% 149,285 $ 13.212M Nov 12, 2026
DFUV 0.01% 22,654 $ 2.005M Nov 12, 2026
MSSM 0.01% 826 $ 74.043K Aug 31, 2026
AVUS 0.01% 20,882 $ 1.83M Nov 16, 2026
DCOR 0.01% 47,547 $ 4.208M Nov 12, 2026
DFAU 0.01% 7,878 $ 697.203K Nov 12, 2026
DFUS 0.00% 7,336 $ 649.236K Nov 12, 2026
AVSU 0.00% 157 $ 13.756K Nov 16, 2026