October 21, 2026 Revenue Grew 9% Including 6% Organic Revenue Growth Grew GAAP Diluted EPS 9% and Adjusted EPS 15% Outstanding performance driven by proven growth strategy and PPI Business System WALTHAM, Mass.--(BUSINESS WIRE)-- Thermo Fisher…
October 21, 2026
Revenue Grew 9% Including 6% Organic Revenue Growth
Grew GAAP Diluted EPS 9% and Adjusted EPS 15%
Outstanding performance driven by proven growth strategy and PPI Business System
WALTHAM, Mass.--(BUSINESS WIRE)-- Thermo Fisher Scientific Inc. (NYSE: TMO), the world leader in serving science, today reported its financial results for the third quarter ended September 26, 2026.
Third Quarter Highlights
-
Third quarter revenue grew 9% to $12.14 billion
-
Third quarter GAAP diluted earnings per share (EPS) grew 9% to $4.64
-
Third quarter adjusted EPS grew 15% to $6.68
“We are very pleased to deliver another excellent quarter, with outstanding financial performance on both the top and bottom line,” said Marc N. Casper, chairman and chief executive officer of Thermo Fisher Scientific. “We’re advancing our proven growth strategy, which is resonating strongly with our customers, and our PPI Business System is enabling outstanding execution across the company.”
Casper added, “Looking ahead, we’re well positioned to deliver an excellent 2026 as we continue to drive long-term value creation for all of our stakeholders and build an even brighter future for our company.”
Growth Strategy and Capital Deployment
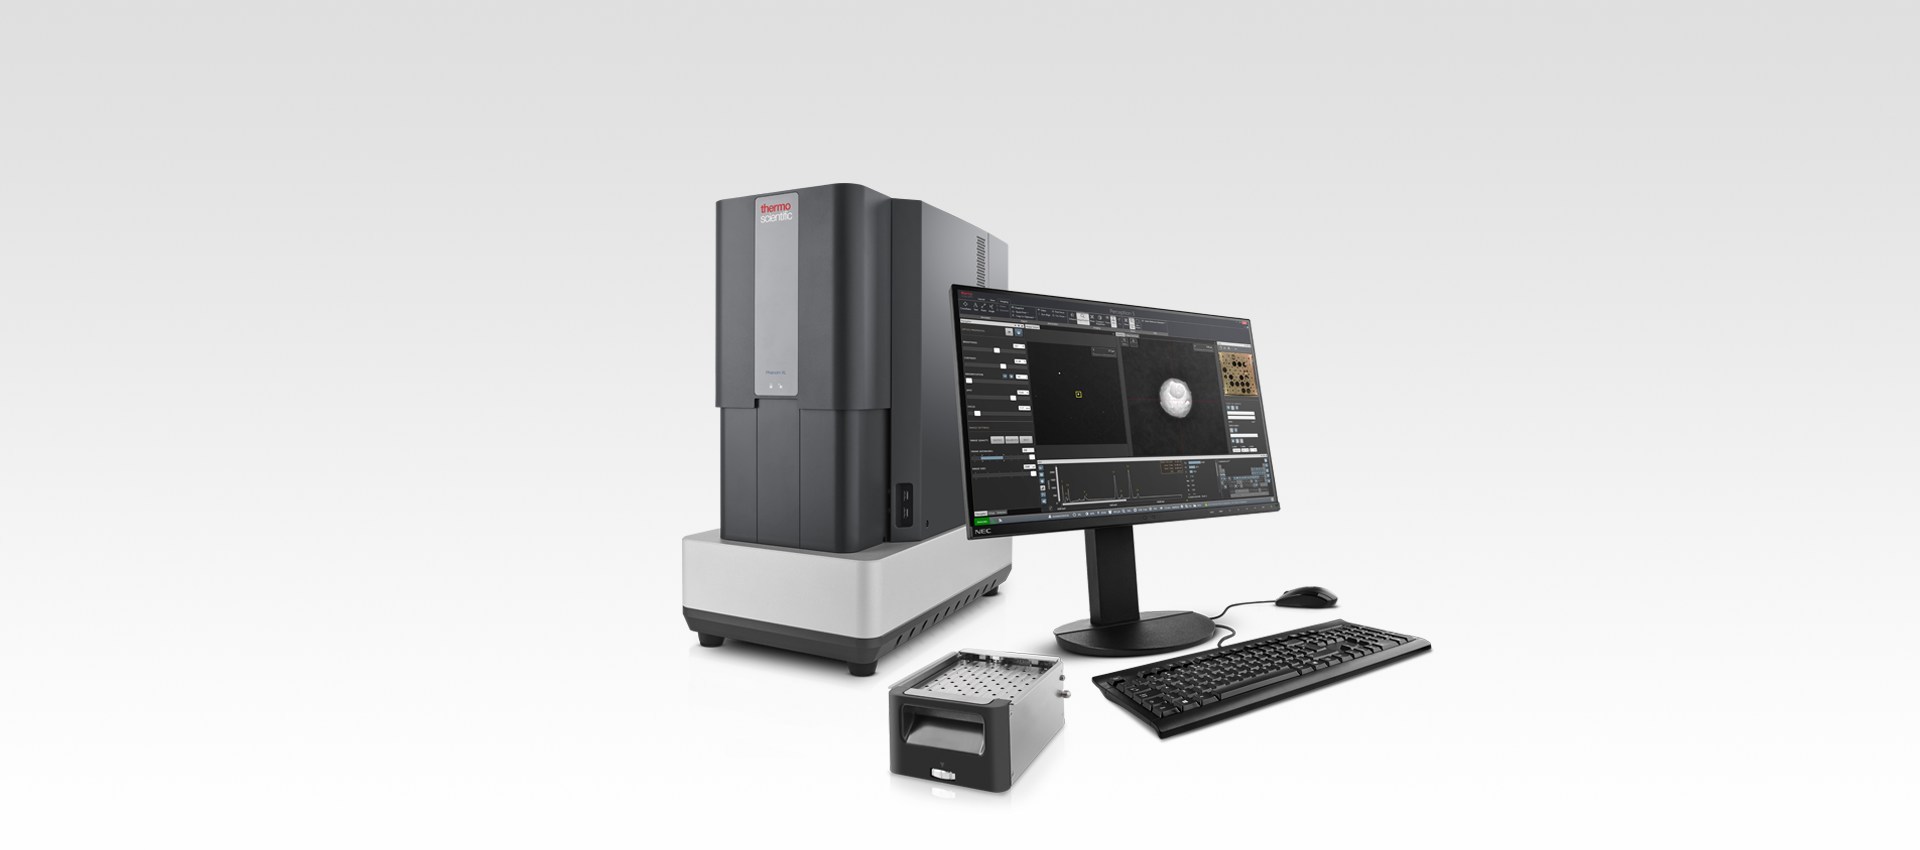
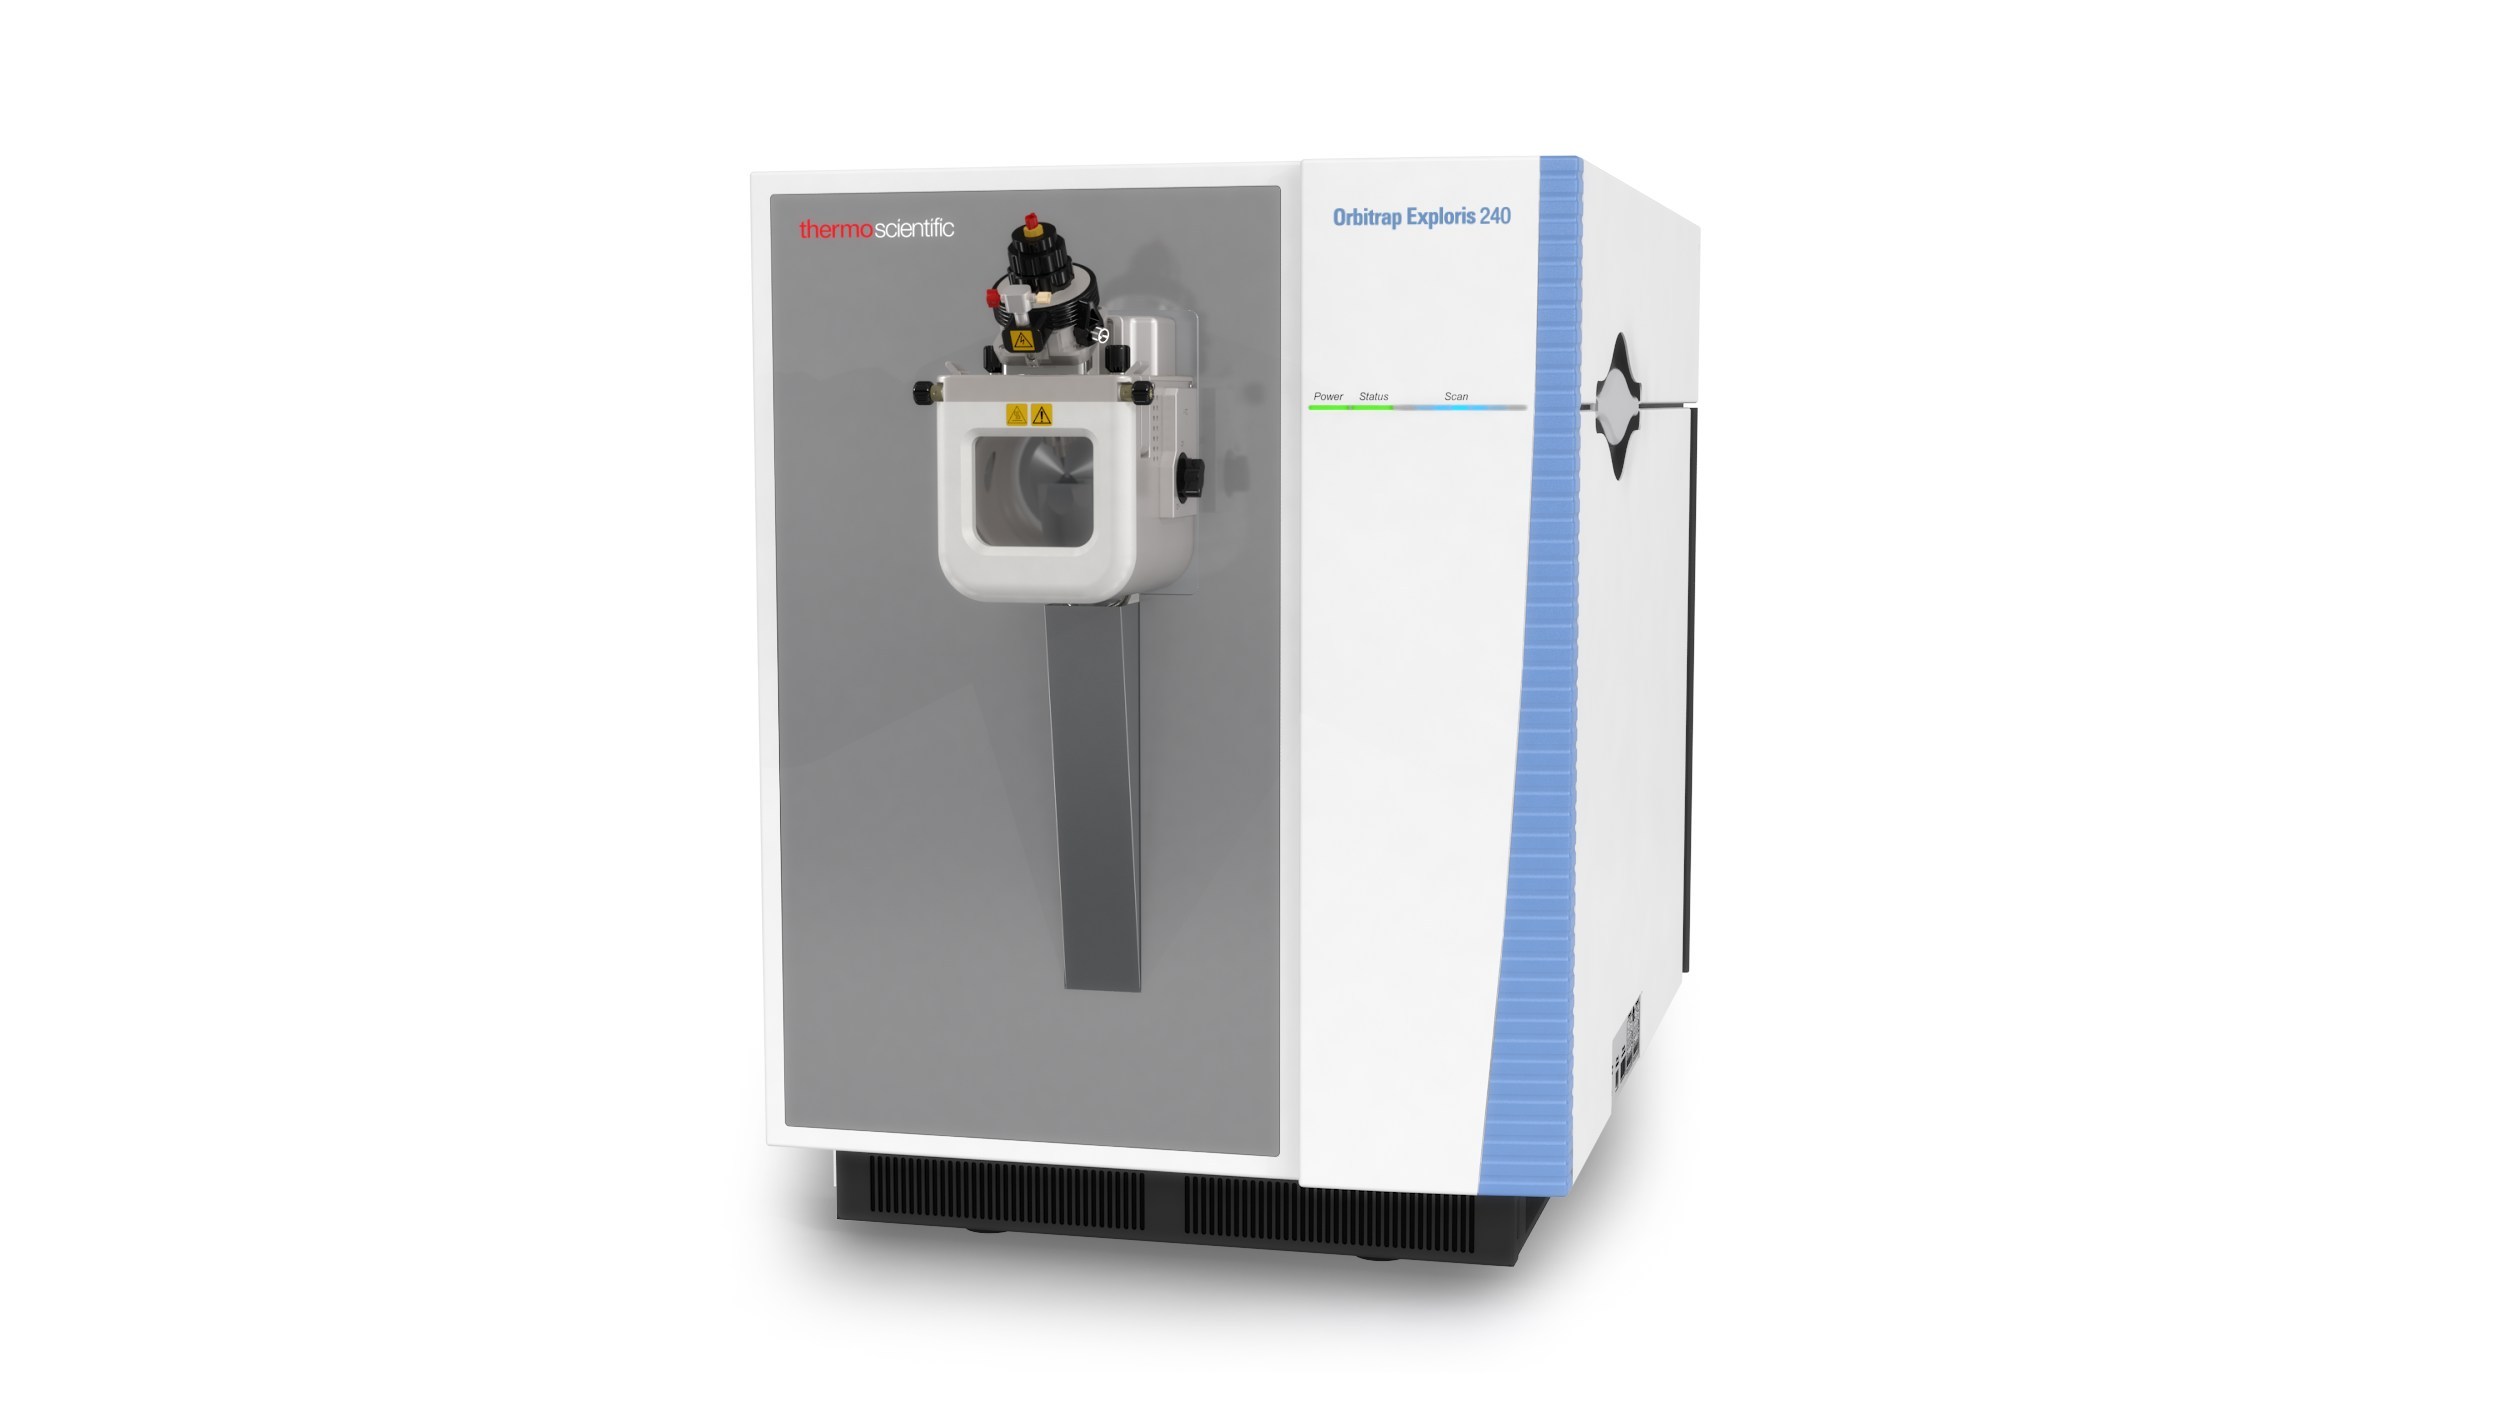
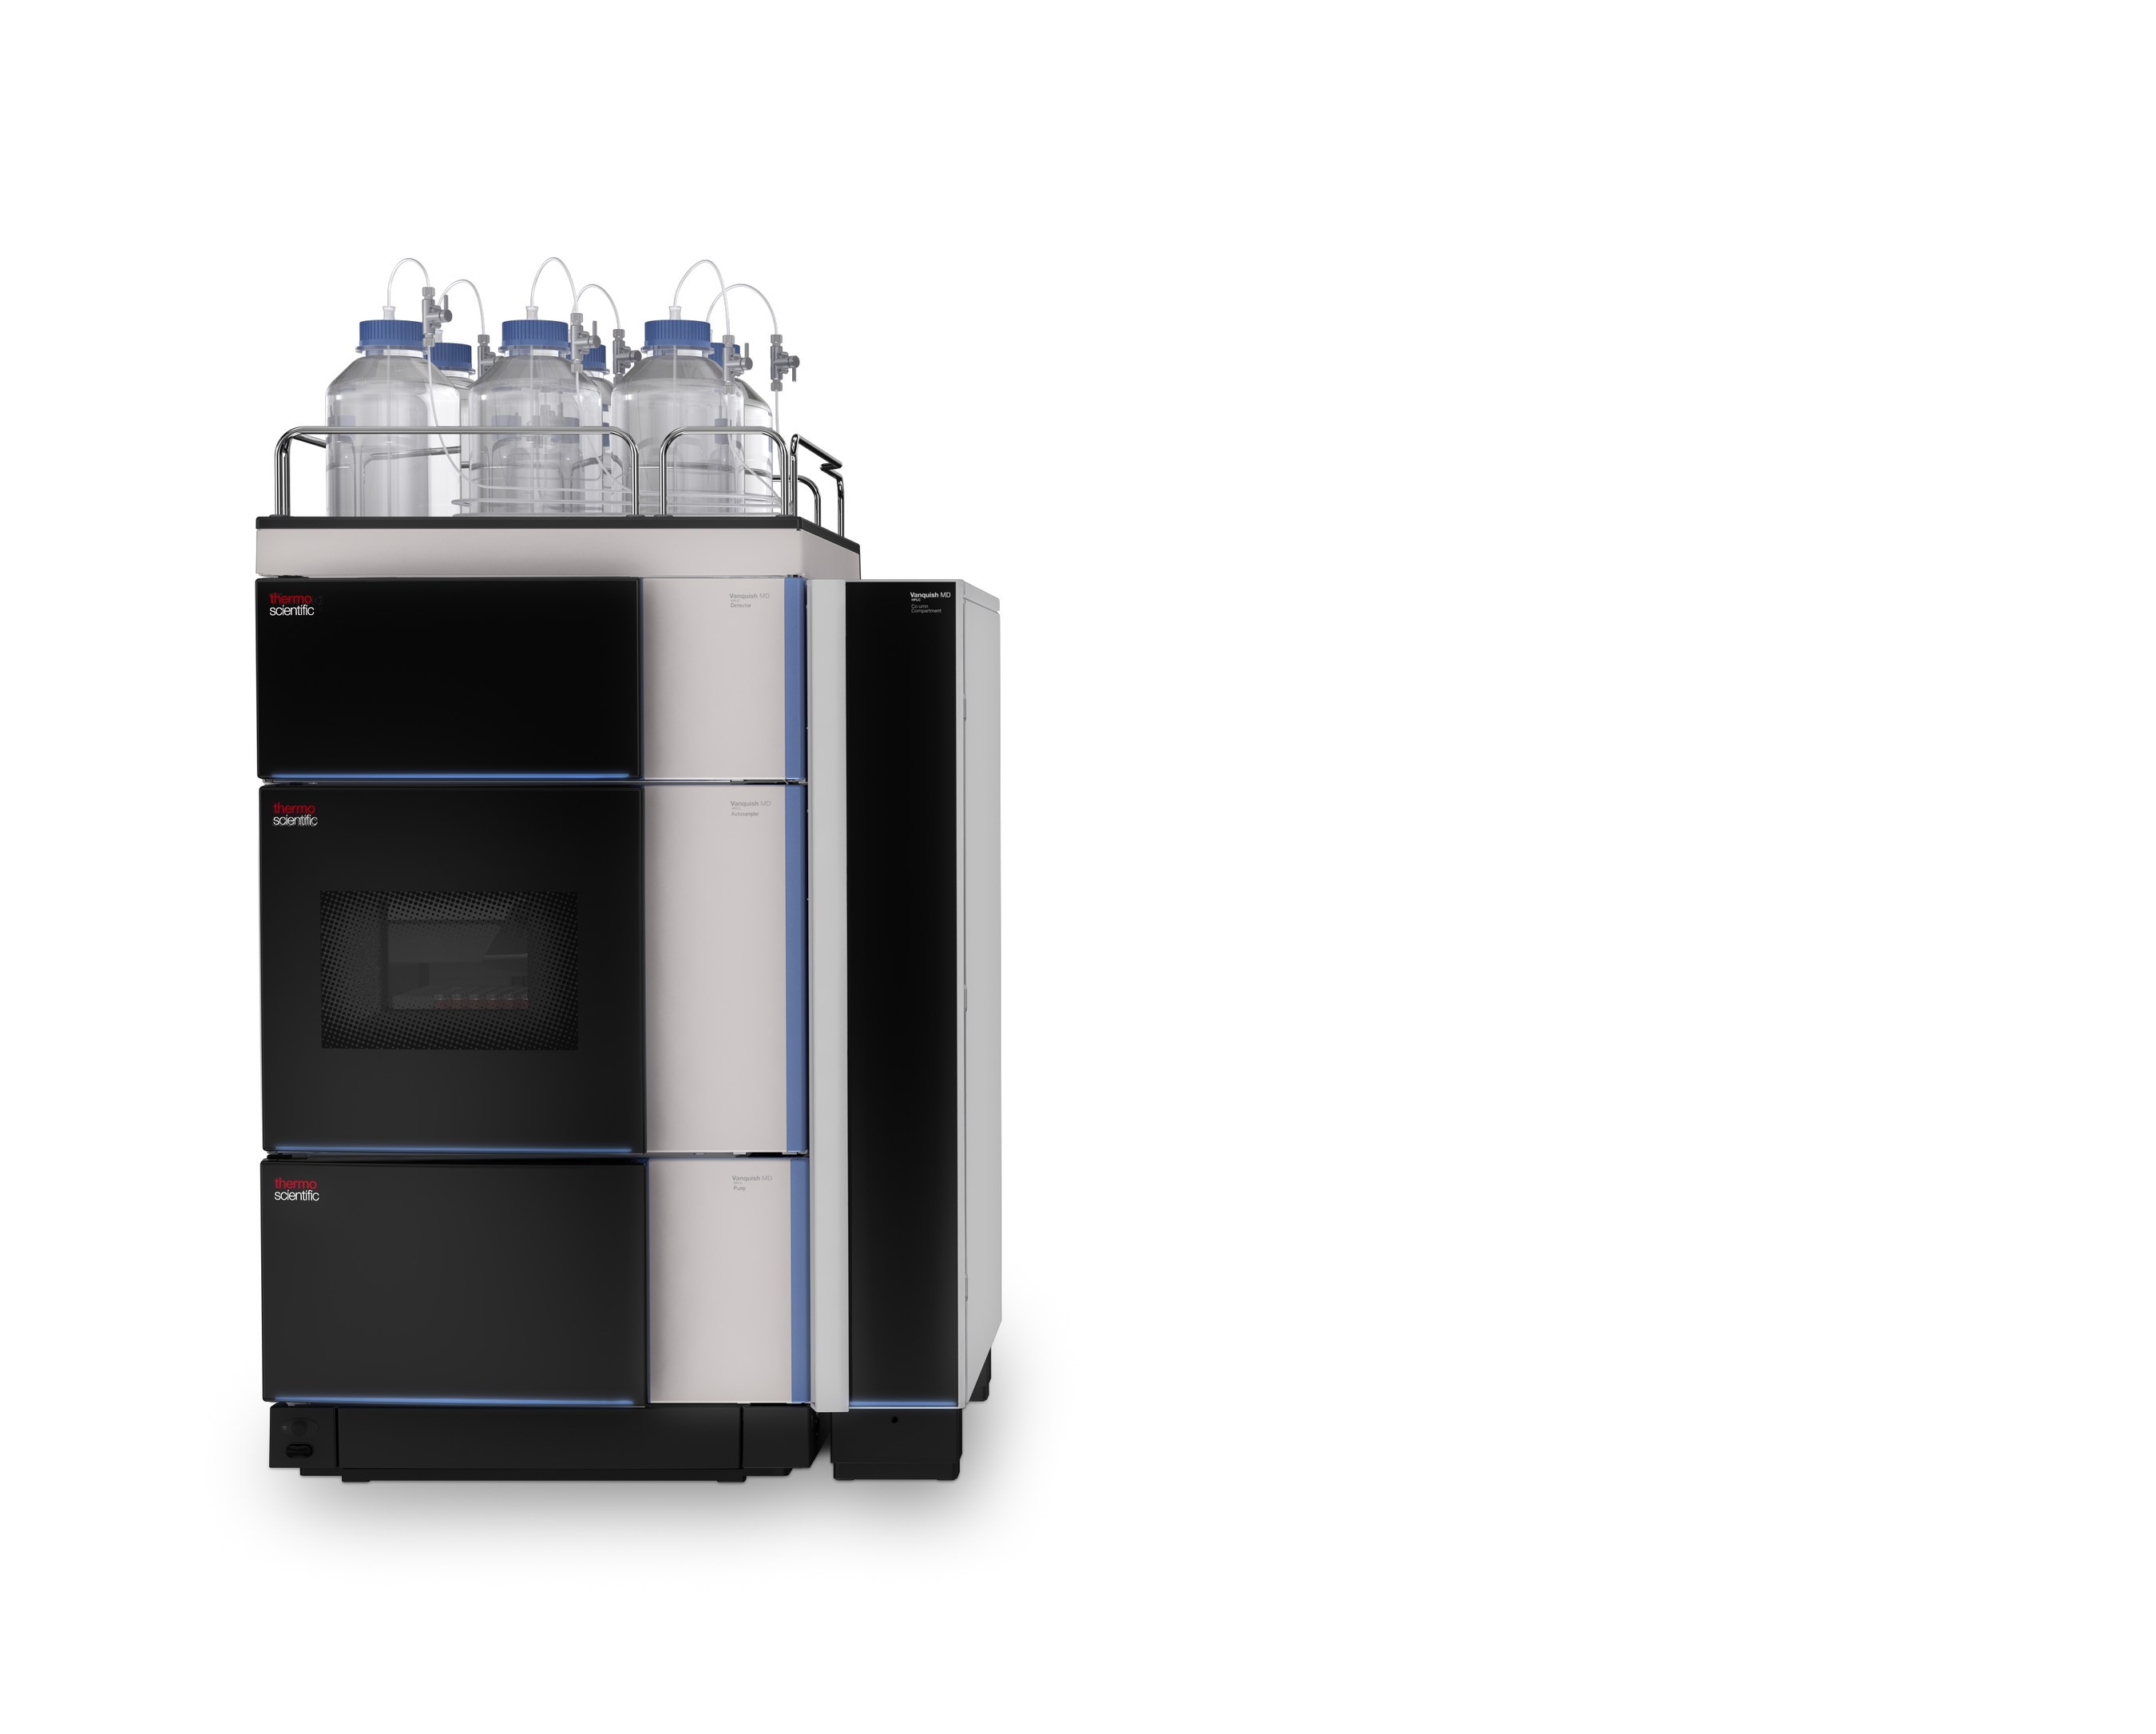
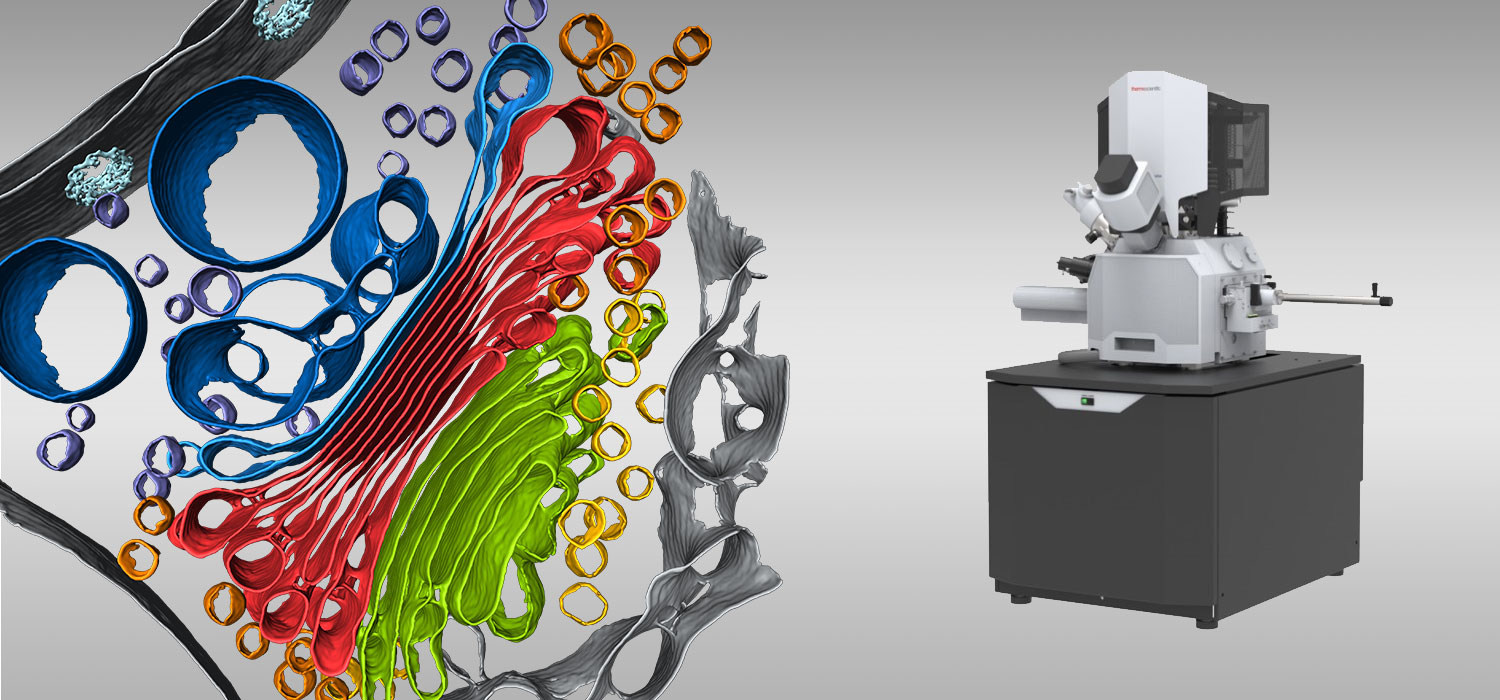
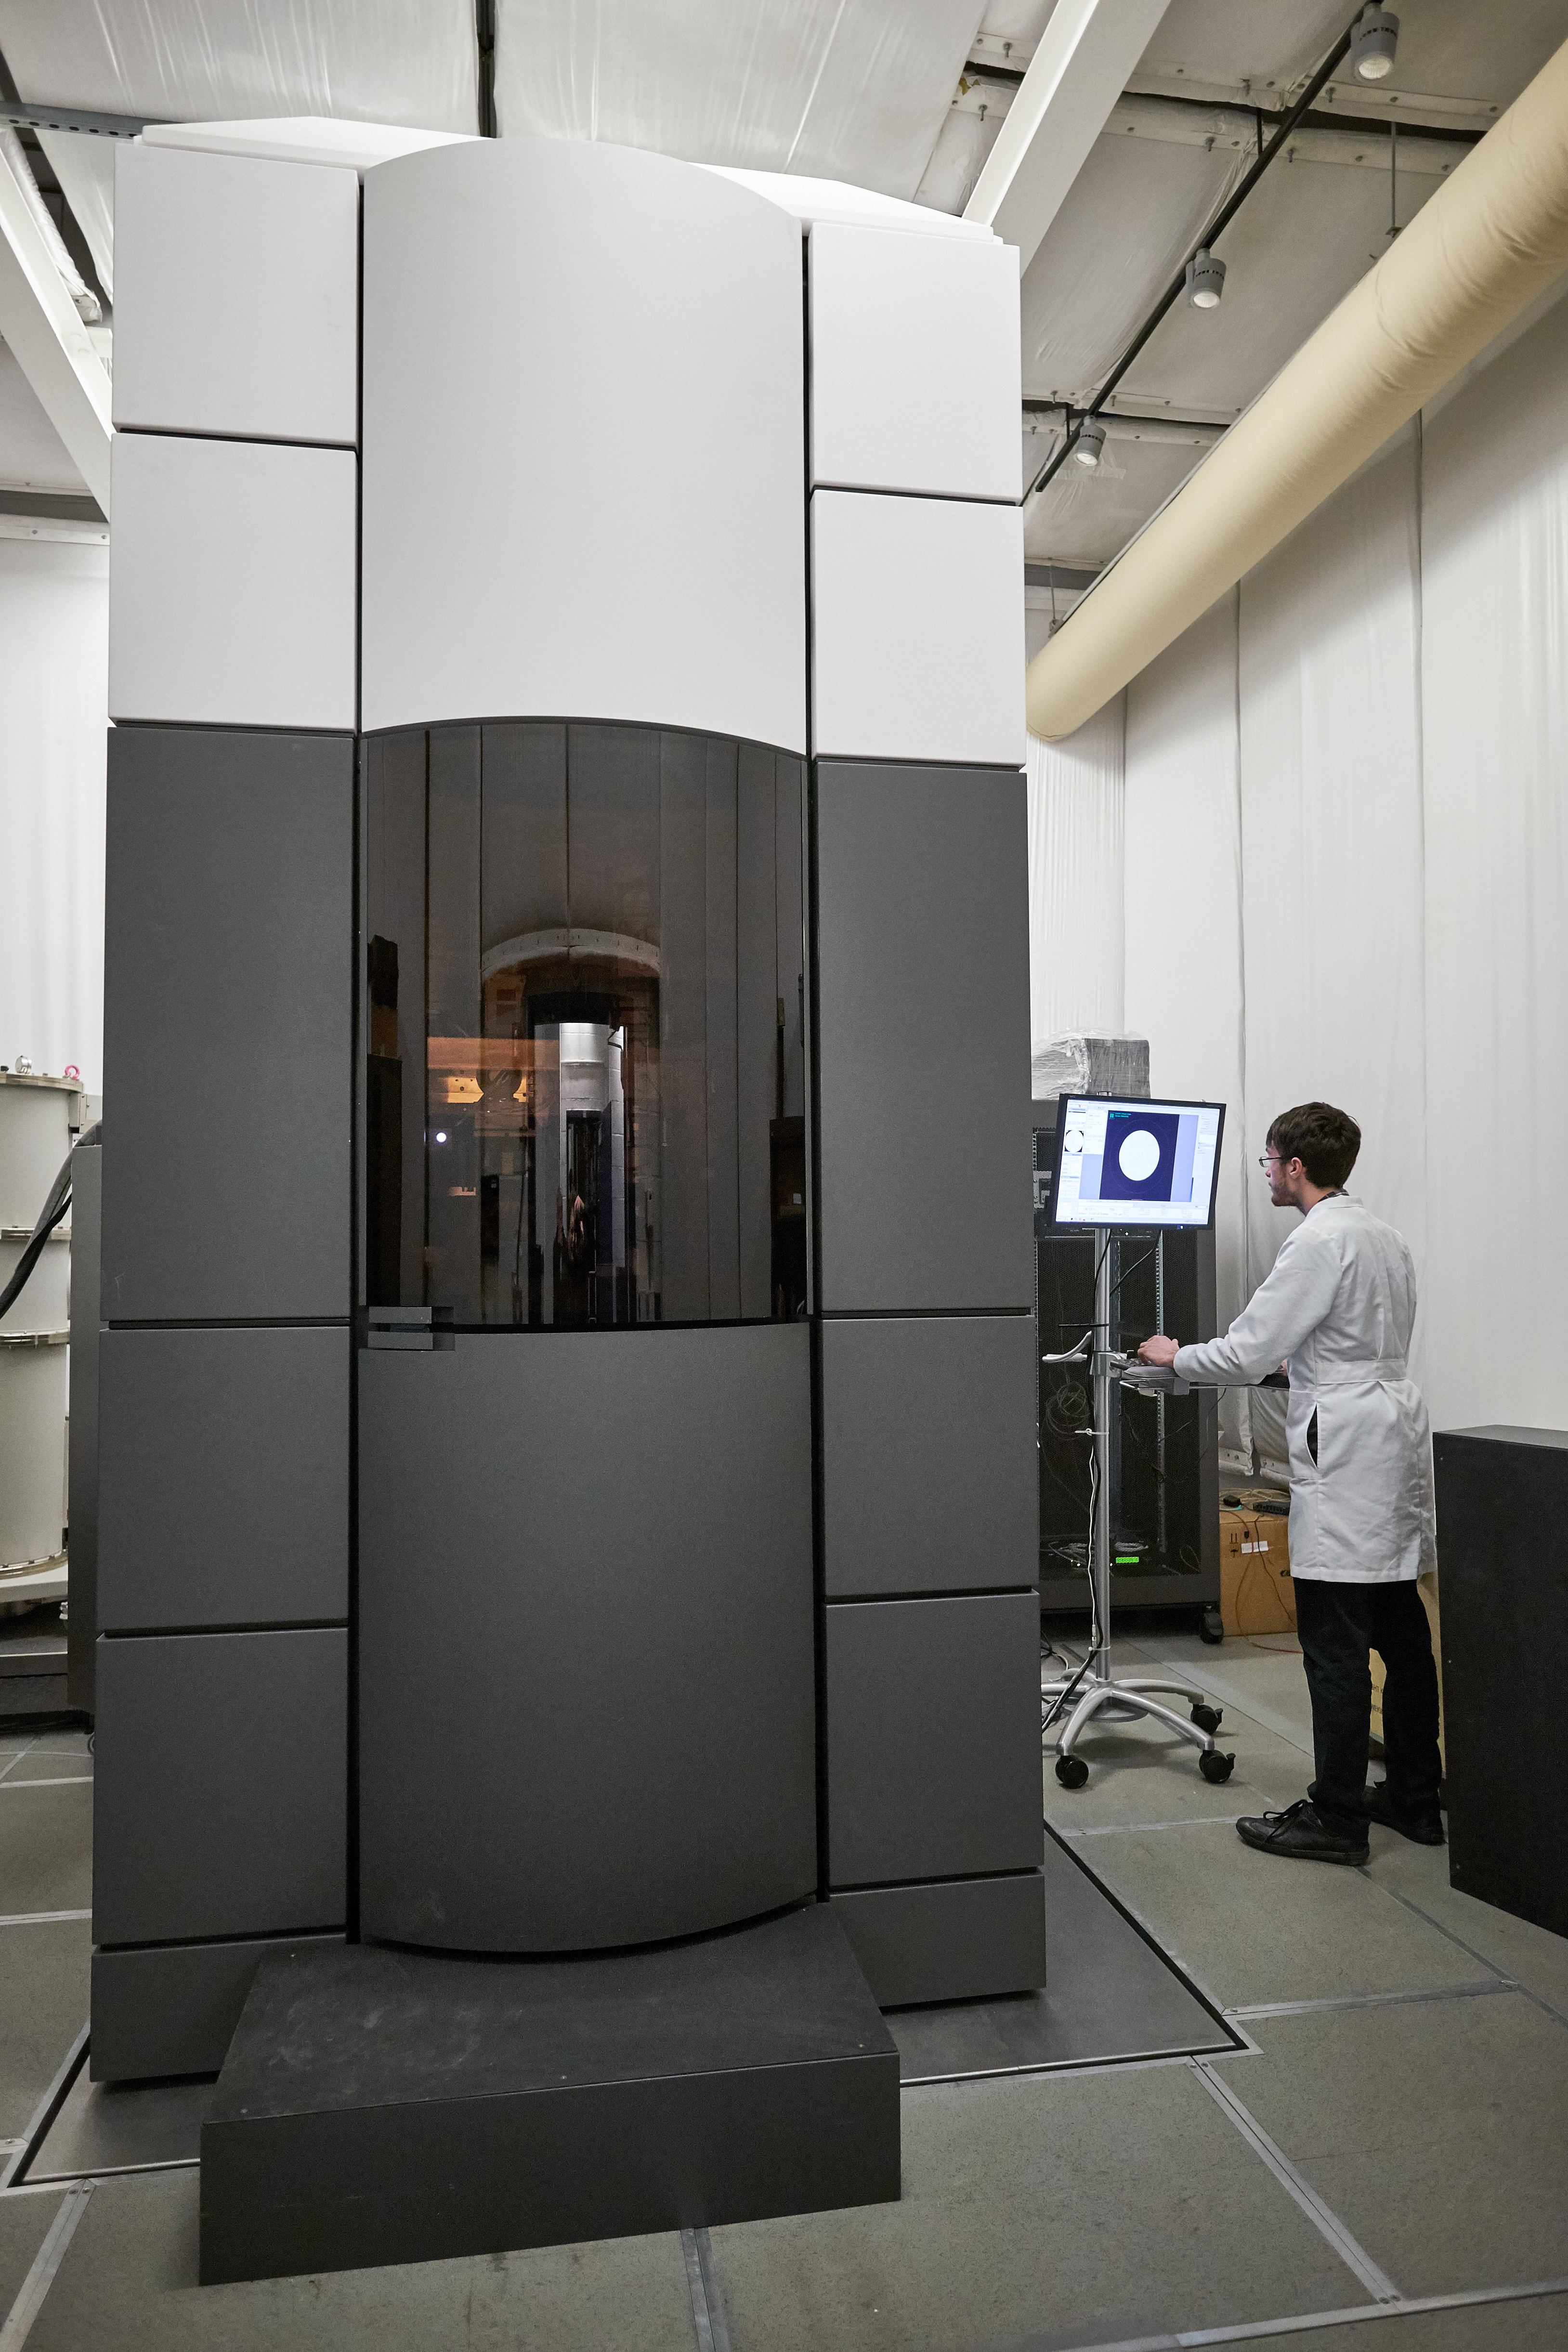
, the first Orbitrap system designed for isotope ratio analysis, enabling faster, simplified workflows and providing deeper insights into the origin and composition of samples for environmental and life sciences research; the Thermo Scientific™ EMPAD™ G2 electron detector
enabling faster, more detailed electron microscopy characterization of advanced materials to support the development of next-generation electronics, memory and energy technologies; the FDA-cleared EliA™ CTD 13 Screen
in the U.S., a new autoimmune test for systemic connective tissue diseases, including lupus, helping laboratories streamline testing and providing clinicians with reliable information to inform patient care; and the Ion 560 Chip
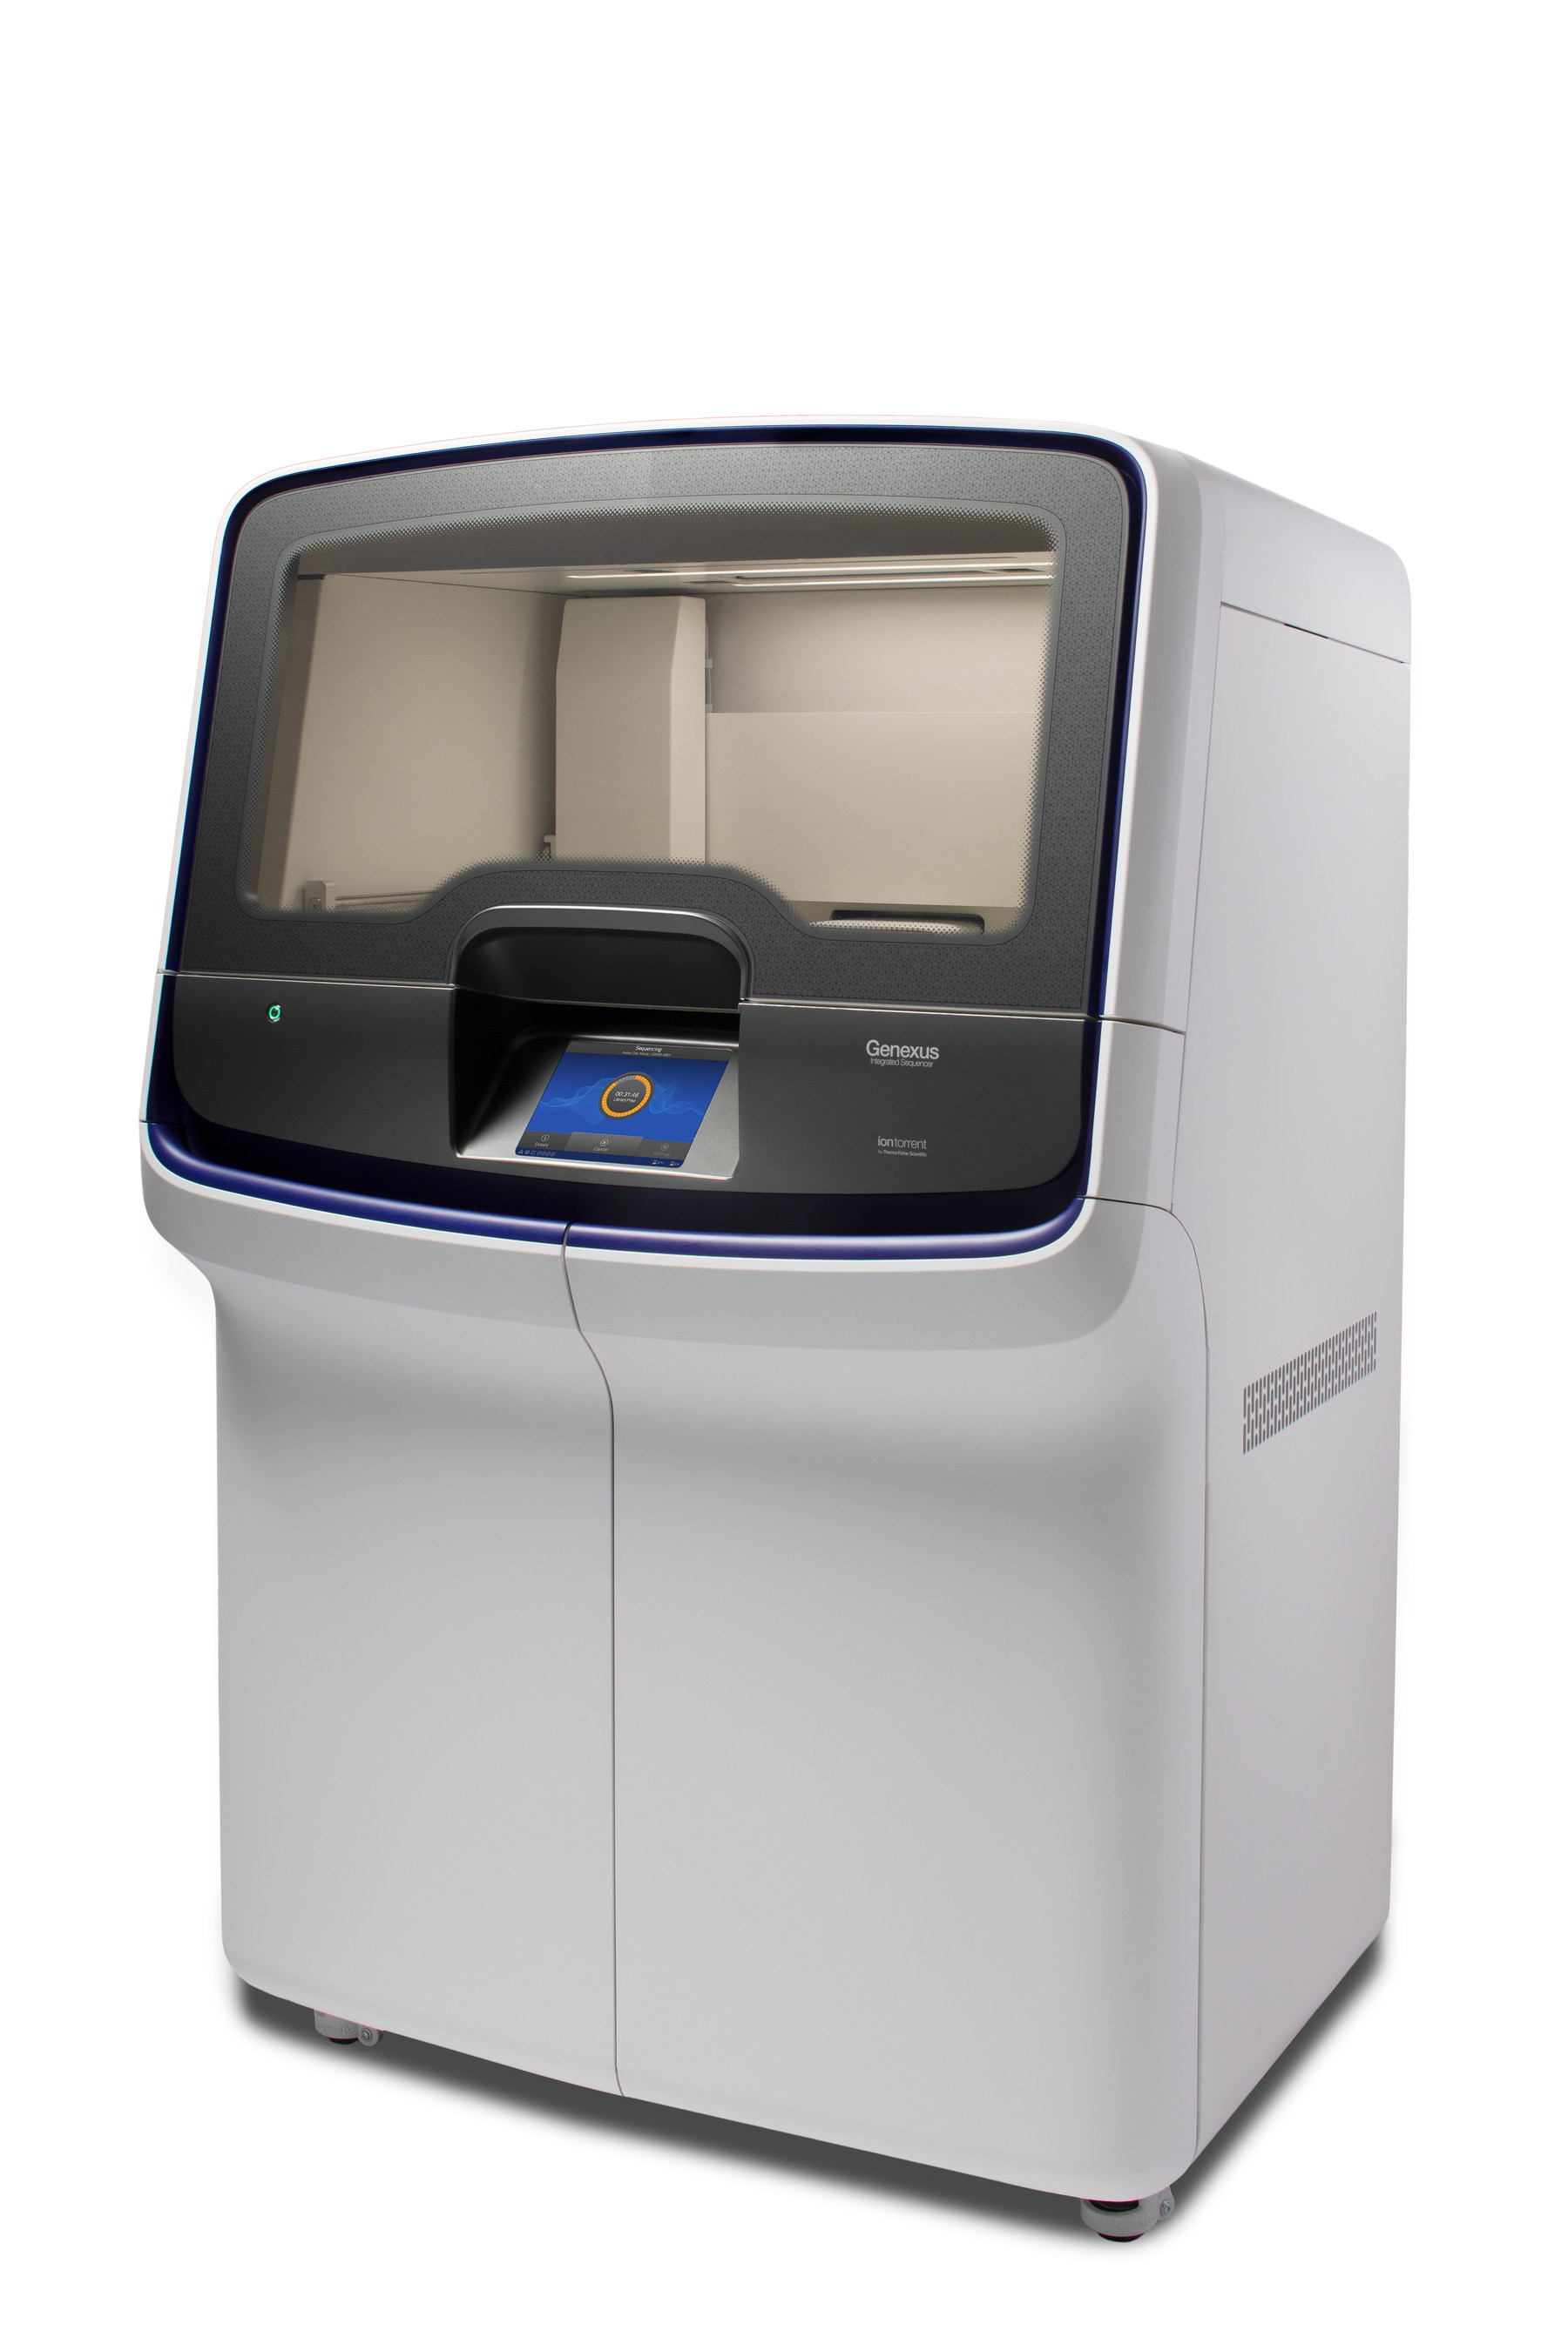
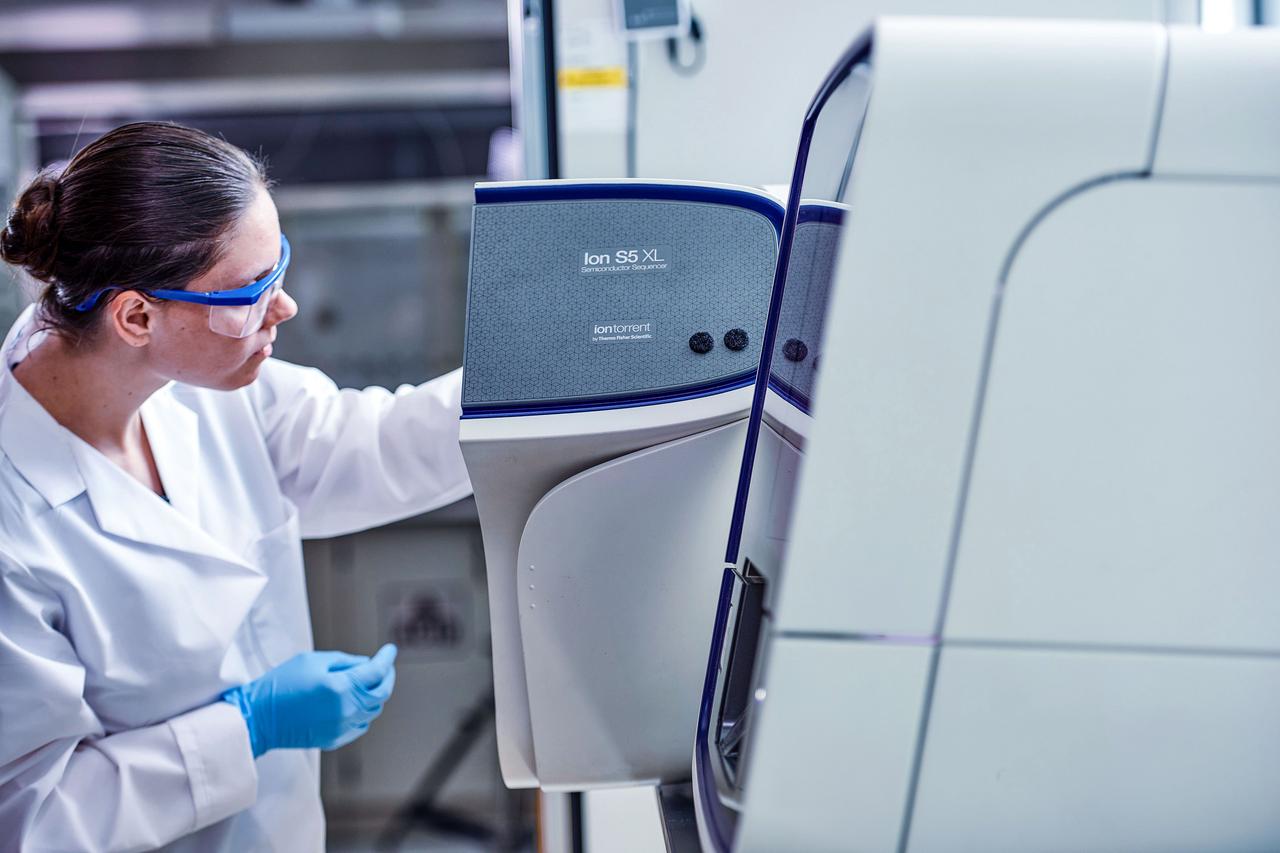
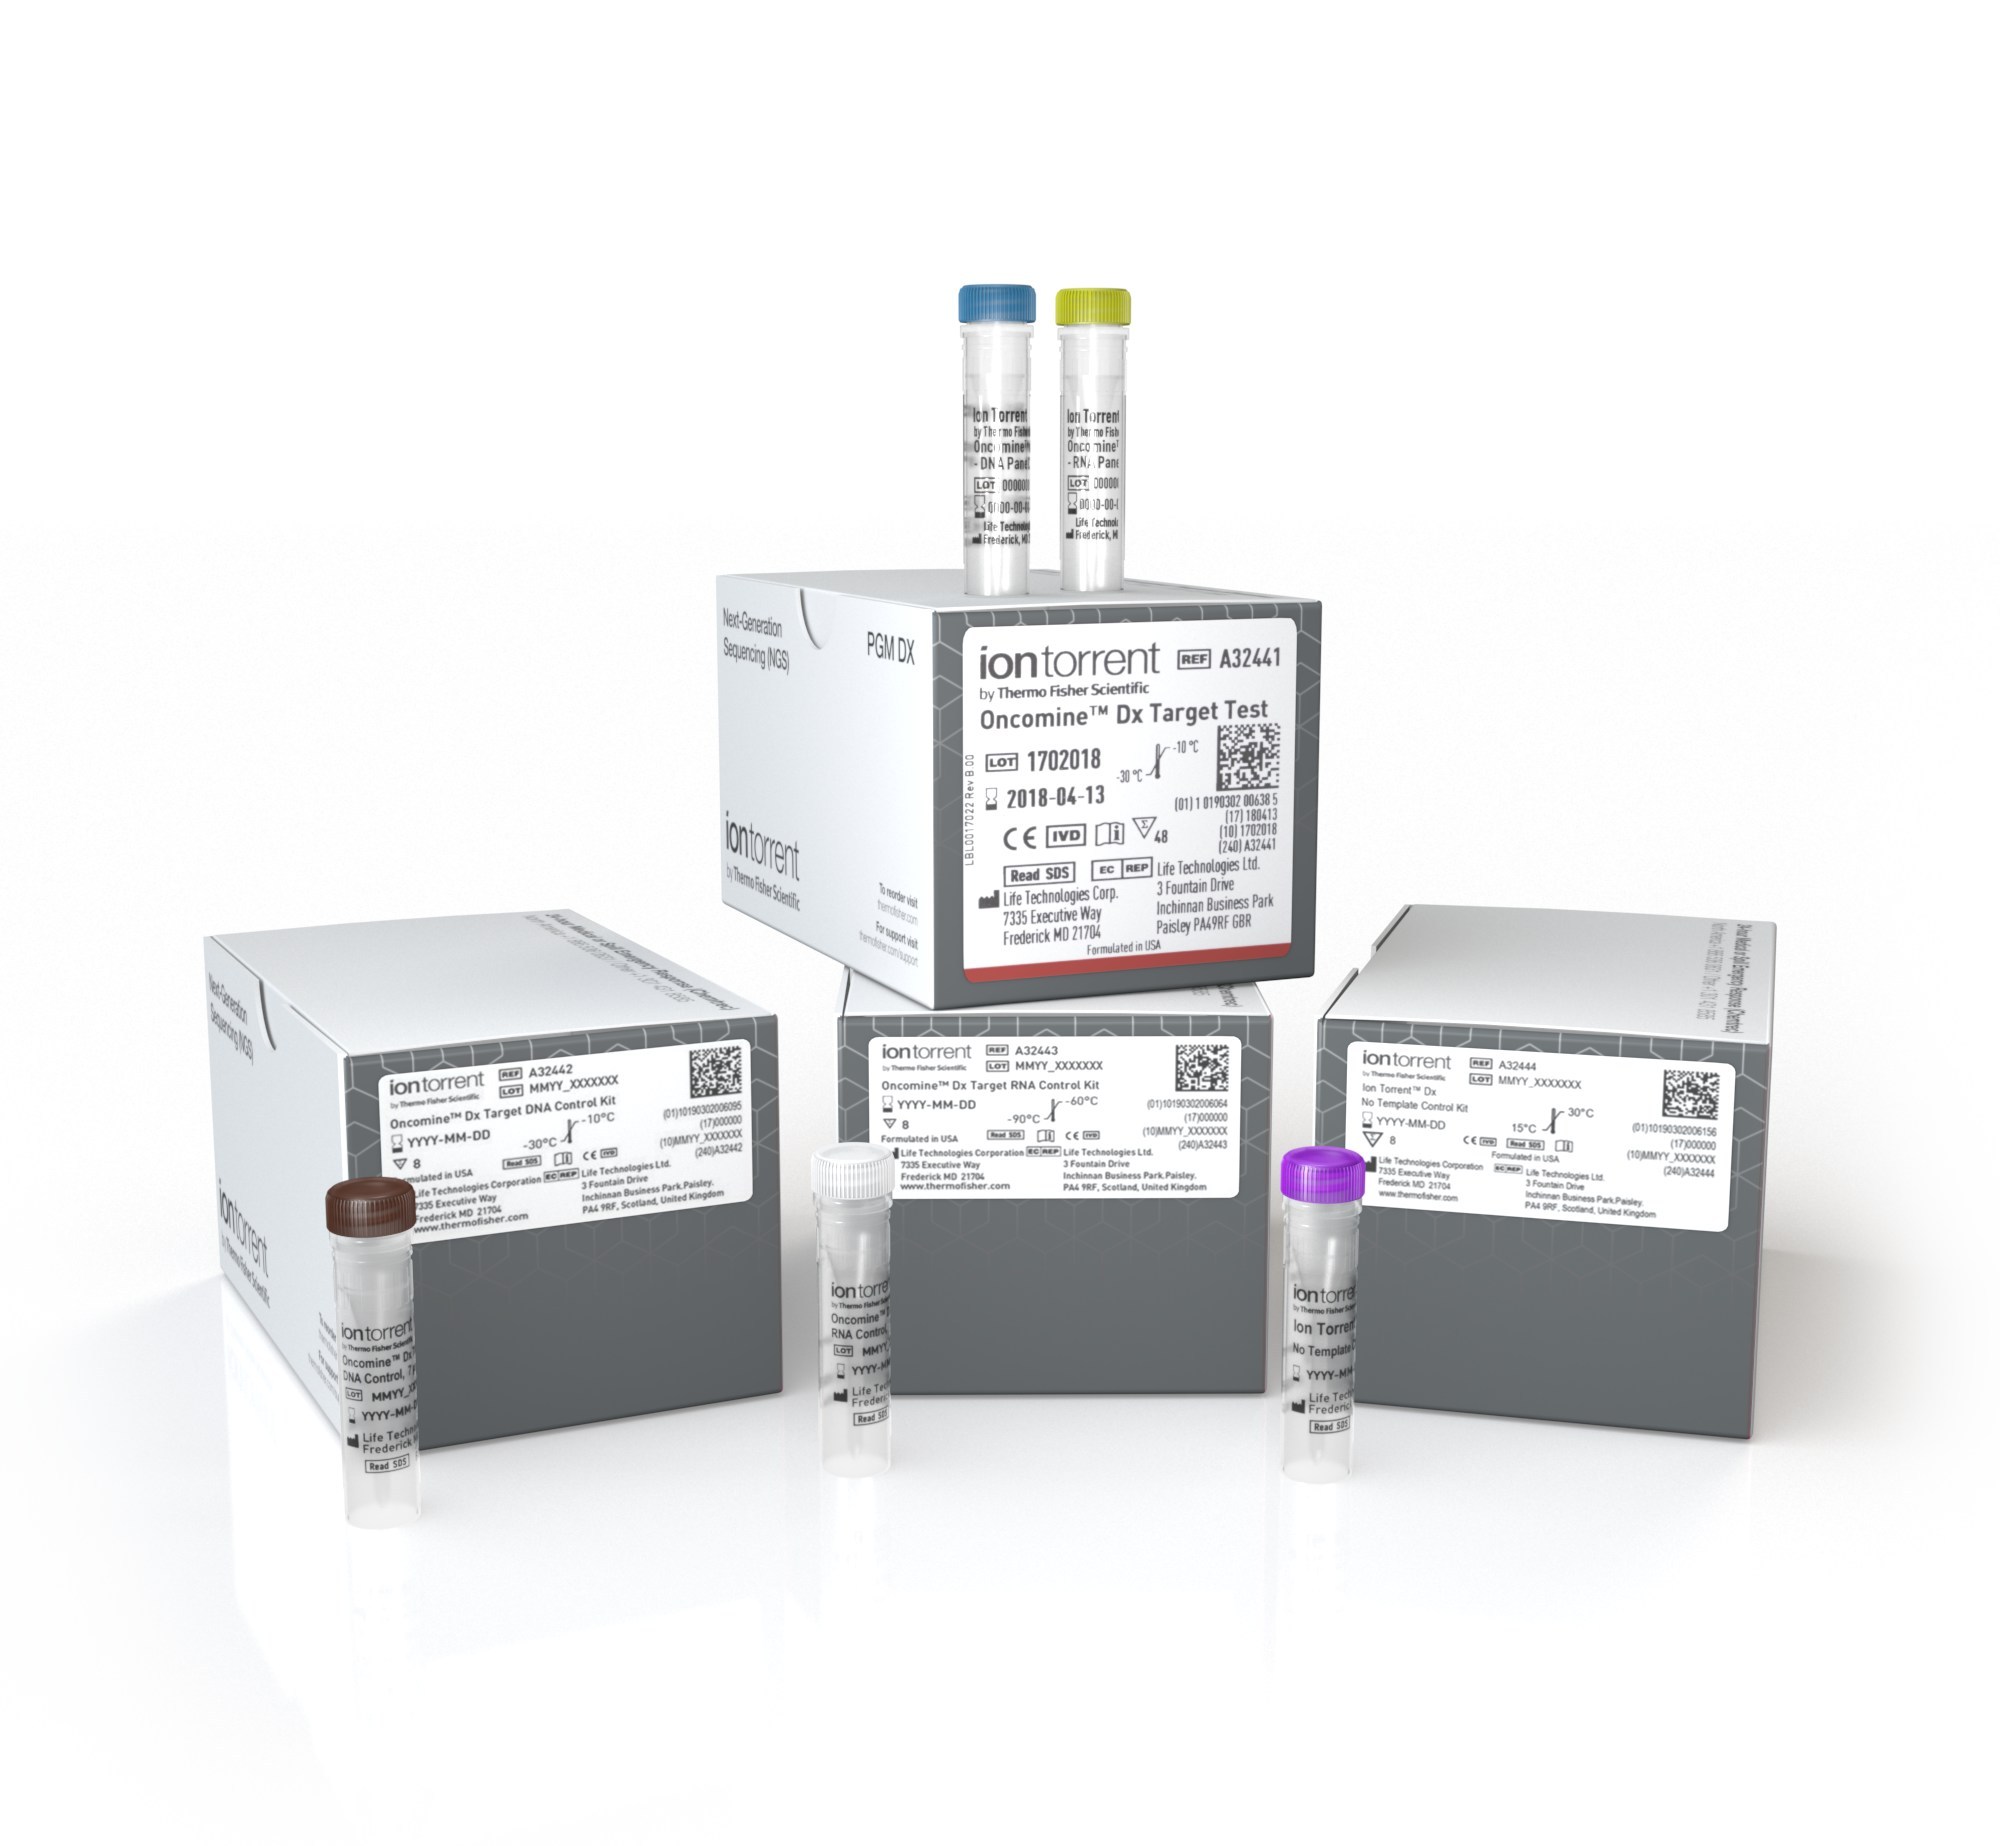
, the highest-throughput sequencing chip for the Ion GeneStudio™ S5 platform, providing nearly twice the sequencing capacity of the prior offering to enable laboratories to process more samples and meet growing genomic profiling needs in oncology research.
- Strengthened our industry-leading commercial engine and deepened our trusted partner status with customers. In partnership with Mayo Clinic, we launched Precure
, a pioneering initiative that will combine data from more than one million patient samples with our differentiated proteomics ecosystem, including Orbitrap™ mass spectrometry and Olink™ technologies, to generate new insights into disease progression, enable earlier detection and advance precision medicine. In South Korea, we opened our first AI-Automation Innovation Center, bringing together our advanced analytical technologies, automation and AI to enable our customers to accelerate innovation and enhance R&D productivity. In our channel businesses, we also opened a highly automated distribution center in Kentucky, to enhance speed, flexibility and assurance of supply for our customers across North America.
- Continued to successfully execute our capital deployment strategy. During the quarter, we completed our previously announced divestiture of our microbiology business.
Financial Results
Revenue for the third quarter of 2026 grew 9% to $12.14 billion, versus $11.12 billion in the same quarter of 2025. Organic revenue growth was 6%.
GAAP Earnings Results
GAAP diluted EPS in the third quarter of 2026 was $4.64, 9% growth versus the third quarter of 2025. GAAP operating income for the third quarter of 2026 was $2.26 billion, 17% higher than the year-ago quarter. GAAP operating margin was 18.6%, compared with 17.4% in the third quarter of 2025.
Non-GAAP Earnings Results
Adjusted EPS for the third quarter of 2026 was $6.68, 15% growth versus the third quarter of 2025. Adjusted operating income for the third quarter of 2026 was $2.97 billion, 15% higher than the year-ago quarter. Adjusted operating margin was 24.5%, compared with 23.3% in the third quarter of 2025.
Annual Guidance for 2026
The company will provide updated 2026 financial guidance during its earnings conference call this morning at 7:00 a.m. Eastern Time.
Use of Non-GAAP Financial Measures
Adjusted EPS, adjusted net income, adjusted operating income, adjusted operating margin, free cash flow, and organic revenue growth are non-GAAP measures that exclude certain items detailed after the tables that accompany this press release, under the heading “Supplemental Information Regarding Non-GAAP Financial Measures.” The reconciliations of GAAP to non-GAAP financial measures are provided in the tables that accompany this press release.
Conference Call
Thermo Fisher Scientific will hold its earnings conference call today, October 21, 2026, at 7:00 a.m. Eastern Time. During the call, the company will discuss its financial performance, as well as future expectations.
The call will be webcast live on the “Investors” section of our website, www.thermofisher.com
. You can access the conference call by dialing (833) 461-5787 within the U.S. or +1 (585) 542-9983 outside the U.S. The access code is 500554659.
The earnings press release and related information can also be found on the Investor Relations
section of our website, under the heading “Financials”. A replay of the call will be available under “News, Events & Presentations” until the next quarterly earnings call.
About Thermo Fisher Scientific
Thermo Fisher Scientific Inc. is the world leader in serving science, with annual revenue over $45 billion. Our Mission is to enable our customers to make the world healthier, cleaner and safer. Whether our customers are accelerating life sciences research, solving complex analytical challenges, increasing productivity in their laboratories, improving patient health through diagnostics or the development and manufacture of life-changing therapies, we are here to support them. Our global team delivers an unrivaled combination of innovative technologies, purchasing convenience and pharmaceutical services through our industry-leading brands, including Thermo Scientific, Applied Biosystems, Invitrogen, Gibco, Fisher Scientific, Unity Lab Services, Patheon and PPD. For more information, please visit www.thermofisher.com
.
Safe Harbor Statement
The following constitutes a “Safe Harbor” statement under the Private Securities Litigation Reform Act of 1995: This press release contains forward-looking statements that involve a number of risks and uncertainties. Important factors that could cause actual results to differ materially from those indicated by forward-looking statements include risks and uncertainties relating to: the need to develop new products and adapt to significant technological change; implementation of strategies for improving growth; general economic conditions and related uncertainties; dependence on customers' capital spending policies and government funding policies; the effect of economic and political conditions and exchange rate fluctuations on international operations; use and protection of intellectual property; the effect of changes in governmental regulations; any natural disaster, public health crisis or other catastrophic event; and the effect of laws and regulations governing government contracts, as well as the possibility that expected benefits related to recent or pending acquisitions, may not materialize as expected. Additional important factors that could cause actual results to differ materially from those indicated by such forward-looking statements are set forth in our most recent reports on Form 10-K and Form 10-Q under the heading “Risk Factors.” These filings are on file with the SEC and available in the “Investors” section of our website under the heading “SEC Filings.” These forward-looking statements are based on our current expectations and speak only as of the date of this press release. While we may elect to update forward-looking statements at some point in the future, we specifically disclaim any obligation to do so, in the event of new information, future developments or otherwise.
| | | | | | | | | | | | | | | |
| --- | --- | --- | --- | --- | --- | --- | --- | --- | --- | --- | --- | --- | --- | --- |
| Condensed Consolidated Statements of Income (unaudited) | | | | | | | | | | | | | | |
| | | Three months ended | | | | | | | | | | | | |
| | | September 26, | | | | % of | | | September 27, | | | | % of | |
| (Dollars in millions except per share amounts) | | | 2026 | | | Revenues | | | | 2025 | | | Revenues | |
| Revenues | | $ | 12,137 | | | | | | $ | 11,122 | | | | |
| Costs and operating expenses: | | | | | | | | | | | | | | |
| Cost of revenues (a) | | | 6,945 | | | 57.2 | % | | | 6,470 | | | 58.2 | % |
| Selling, general and administrative expenses (b) | | | 1,863 | | | 15.3 | % | | | 1,795 | | | 16.1 | % |
| Amortization of acquisition-related intangible assets | | | 519 | | | 4.3 | % | | | 435 | | | 3.9 | % |
| Research and development expenses | | | 348 | | | 2.9 | % | | | 346 | | | 3.1 | % |
| Restructuring and other costs (c) | | | 199 | | | 1.6 | % | | | 135 | | | 1.2 | % |
| Total costs and operating expenses | | | 9,874 | | | 81.4 | % | | | 9,182 | | | 82.6 | % |
| Operating income | | | 2,263 | | | 18.6 | % | | | 1,941 | | | 17.4 | % |
| Interest income | | | 252 | | | | | | | 234 | | | | |
| Interest expense | | | (417 | ) | | | | | | (347 | ) | | | |
| Other income/(expense) (d) | | | (10 | ) | | | | | | (2 | ) | | | |
| Income before income taxes | | | 2,088 | | | | | | | 1,826 | | | | |
| Benefit from/(provision for) income taxes (e) | | | (352 | ) | | | | | | (207 | ) | | | |
| Equity in earnings/(losses) of unconsolidated entities | | | (9 | ) | | | | | | 2 | | | | |
| Net income | | | 1,727 | | | | | | | 1,621 | | | | |
| Less: net income/(loss) attributable to noncontrolling interests and redeemable noncontrolling interest | | | 6 | | | | | | | 5 | | | | |
| Net income attributable to Thermo Fisher Scientific Inc. | | $ | 1,721 | | | 14.2 | % | | $ | 1,616 | | | 14.5 | % |
| | | | | | | | | | | | | | | |
| Earnings per share attributable to Thermo Fisher Scientific Inc.: | | | | | | | | | | | | | | |
| Basic | | $ | 4.65 | | | | | | $ | 4.28 | | | | |
| Diluted | | $ | 4.64 | | | | | | $ | 4.27 | | | | |
| Weighted average shares: | | | | | | | | | | | | | | |
| Basic | | | 370 | | | | | | | 378 | | | | |
| Diluted | | | 371 | | | | | | | 378 | | | | |
| | | | | | | | | | | | | | | |
| Reconciliation of adjusted operating income and adjusted operating margin | | | | | | | | | | | | | | |
| GAAP operating income | | $ | 2,263 | | | 18.6 | % | | $ | 1,941 | | | 17.4 | % |
| Cost of revenues adjustments (a) | | | 9 | | | 0.1 | % | | | 10 | | | 0.1 | % |
| Selling, general and administrative expenses adjustments (b) | | | (20 | ) | | -0.2 | % | | | 66 | | | 0.6 | % |
| Restructuring and other costs (c) | | | 199 | | | 1.6 | % | | | 135 | | | 1.2 | % |
| Amortization of acquisition-related intangible assets | | | 519 | | | 4.3 | % | | | 435 | | | 3.9 | % |
| Adjusted operating income (non-GAAP measure) | | $ | 2,968 | | | 24.5 | % | | $ | 2,587 | | | 23.3 | % |
| | | | | | | | | | | | | | | |
| Reconciliation of adjusted net income | | | | | | | | | | | | | | |
| GAAP net income attributable to Thermo Fisher Scientific Inc. | | $ | 1,721 | | | | | | $ | 1,616 | | | | |
| Cost of revenues adjustments (a) | | | 9 | | | | | | | 10 | | | | |
| Selling, general and administrative expenses adjustments (b) | | | (20 | ) | | | | | | 66 | | | | |
| Restructuring and other costs (c) | | | 199 | | | | | | | 135 | | | | |
| Amortization of acquisition-related intangible assets | | | 519 | | | | | | | 435 | | | | |
| Other income/expense adjustments (d) | | | 14 | | | | | | | (5 | ) | | | |
| Income taxes adjustments (e) | | | 27 | | | | | | | (64 | ) | | | |
| Equity in earnings/losses of unconsolidated entities | | | 9 | | | | | | | (2 | ) | | | |
| Adjusted net income (non-GAAP measure) | | $ | 2,477 | | | | | | $ | 2,190 | | | | |
| | | | | | | | | | | | | | | |
| Reconciliation of adjusted earnings per share | | | | | | | | | | | | | | |
| GAAP diluted EPS attributable to Thermo Fisher Scientific Inc. | | $ | 4.64 | | | | | | $ | 4.27 | | | | |
| Cost of revenues adjustments (a) | | | 0.02 | | | | | | | 0.03 | | | | |
| Selling, general and administrative expenses adjustments (b) | | | (0.06 | ) | | | | | | 0.17 | | | | |
| Restructuring and other costs (c) | | | 0.54 | | | | | | | 0.36 | | | | |
| Amortization of acquisition-related intangible assets | | | 1.40 | | | | | | | 1.15 | | | | |
| Other income/expense adjustments (d) | | | 0.04 | | | | | | | (0.01 | ) | | | |
| Income taxes adjustments (e) | | | 0.07 | | | | | | | (0.17 | ) | | | |
| Equity in earnings/losses of unconsolidated entities | | | 0.02 | | | | | | | (0.01 | ) | | | |
| Adjusted EPS (non-GAAP measure) | | $ | 6.68 | | | | | | $ | 5.79 | | | | |
| | | | | | | | | | | | | | | |
| Reconciliation of free cash flow | | | | | | | | | | | | | | |
| GAAP net cash provided by operating activities | | $ | 2,551 | | | | | | $ | 2,239 | | | | |
| Purchases of property, plant and equipment | | | (437 | ) | | | | | | (404 | ) | | | |
| Proceeds from sale of property, plant and equipment | | | 1 | | | | | | | 5 | | | | |
| Free cash flow (non-GAAP measure) | | $ | 2,115 | | | | | | $ | 1,840 | | | | |
 Link to company website