Turkcell Medya Turkcell Medya BASIN BÜLTENLERİ VİDEOLAR GÖRSEL ARŞİV İLETİŞİM Turkcell Medya ================================================================== 0 Veliler sınav sonuçlarını BiP’ten hızlıca öğreniyor Türkiye’nin anlık mesajlaşma…
Turkcell Medya
Turkcell Medya
Turkcell Medya
==================================================================
0
Veliler sınav sonuçlarını BiP’ten hızlıca öğreniyor
Türkiye’nin anlık mesajlaşma uygulaması BiP’in, Millî Eğitim Bakanlığı (MEB) iş birliğiyle hayata geçirdiği Okul Veli Asistanı (OVA) kanalı, bu sınav döneminde de velilerin çocuklarının notlarını hızlı bir şekilde öğrenmesini sağlıyor.
30.10.2026
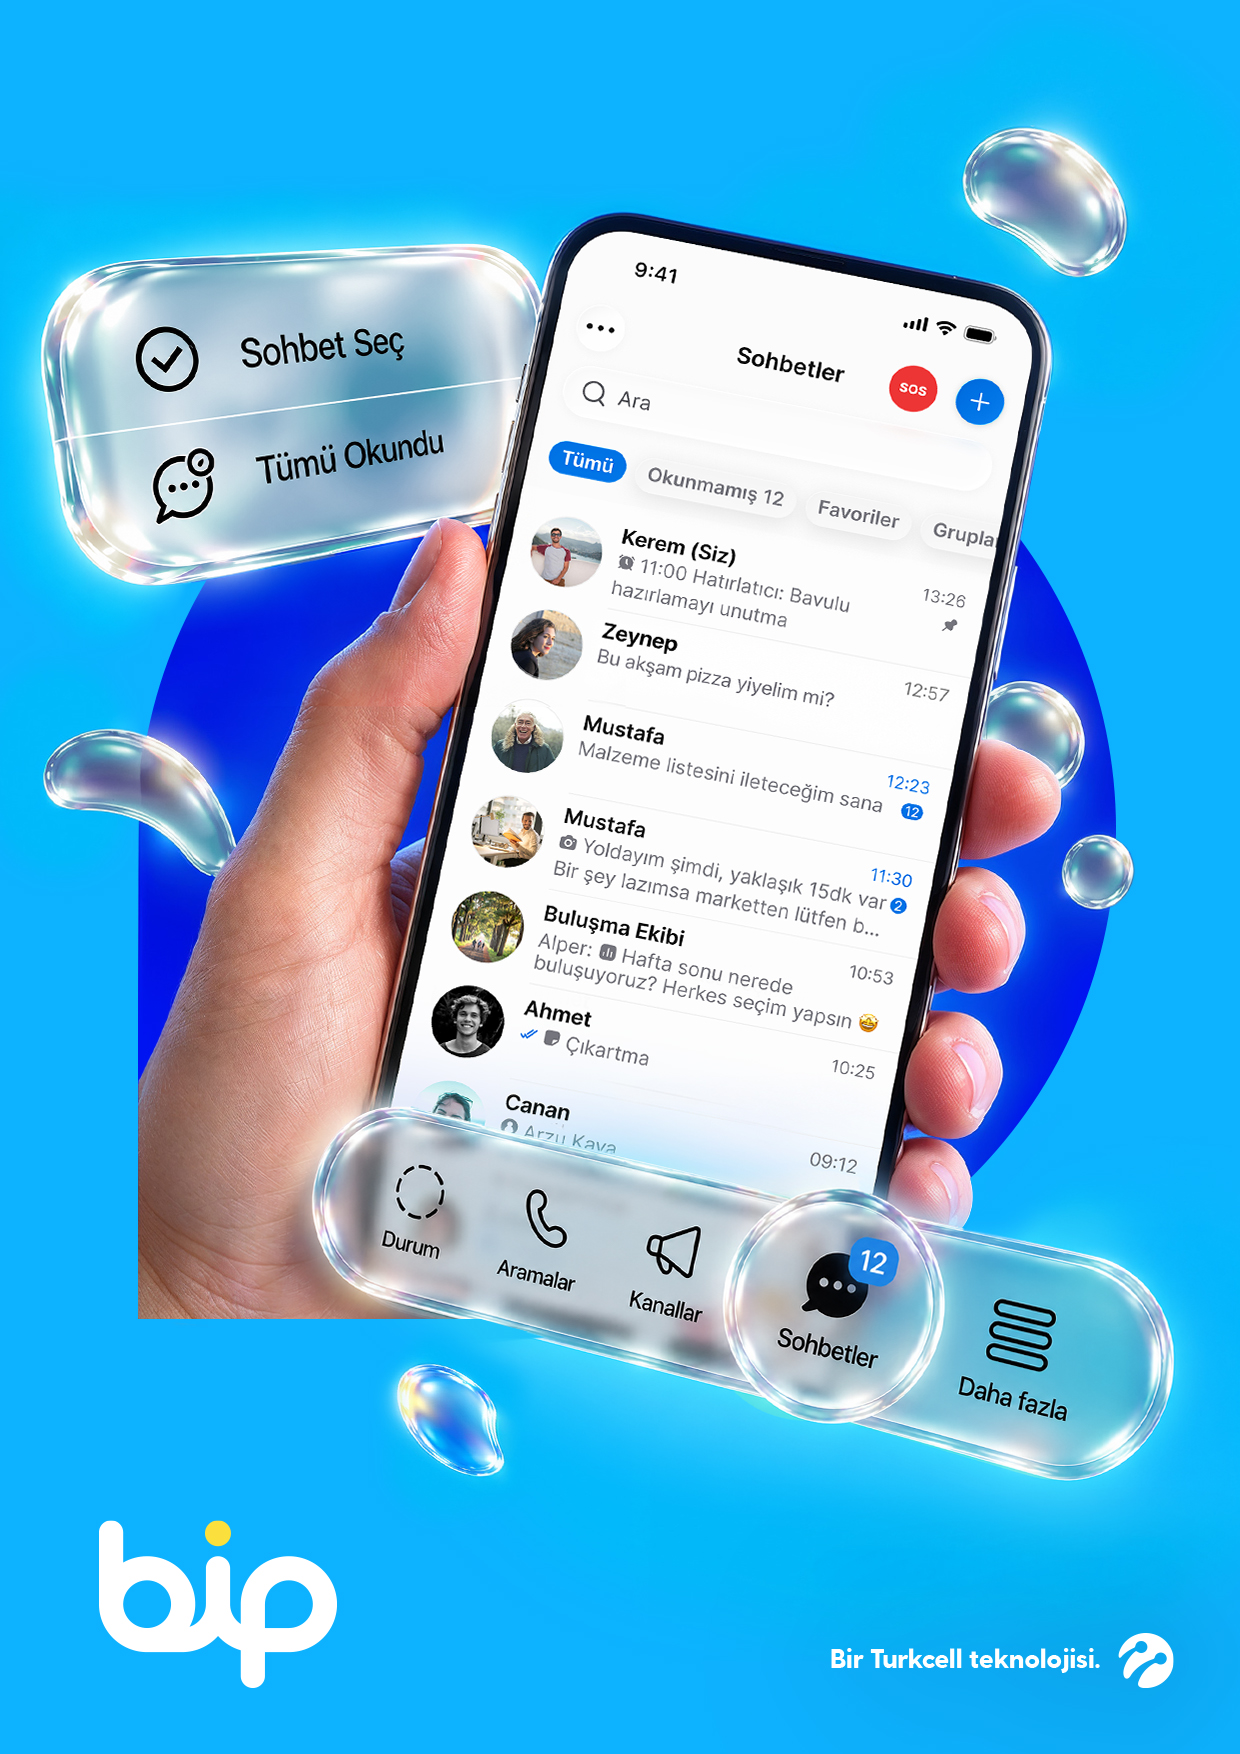
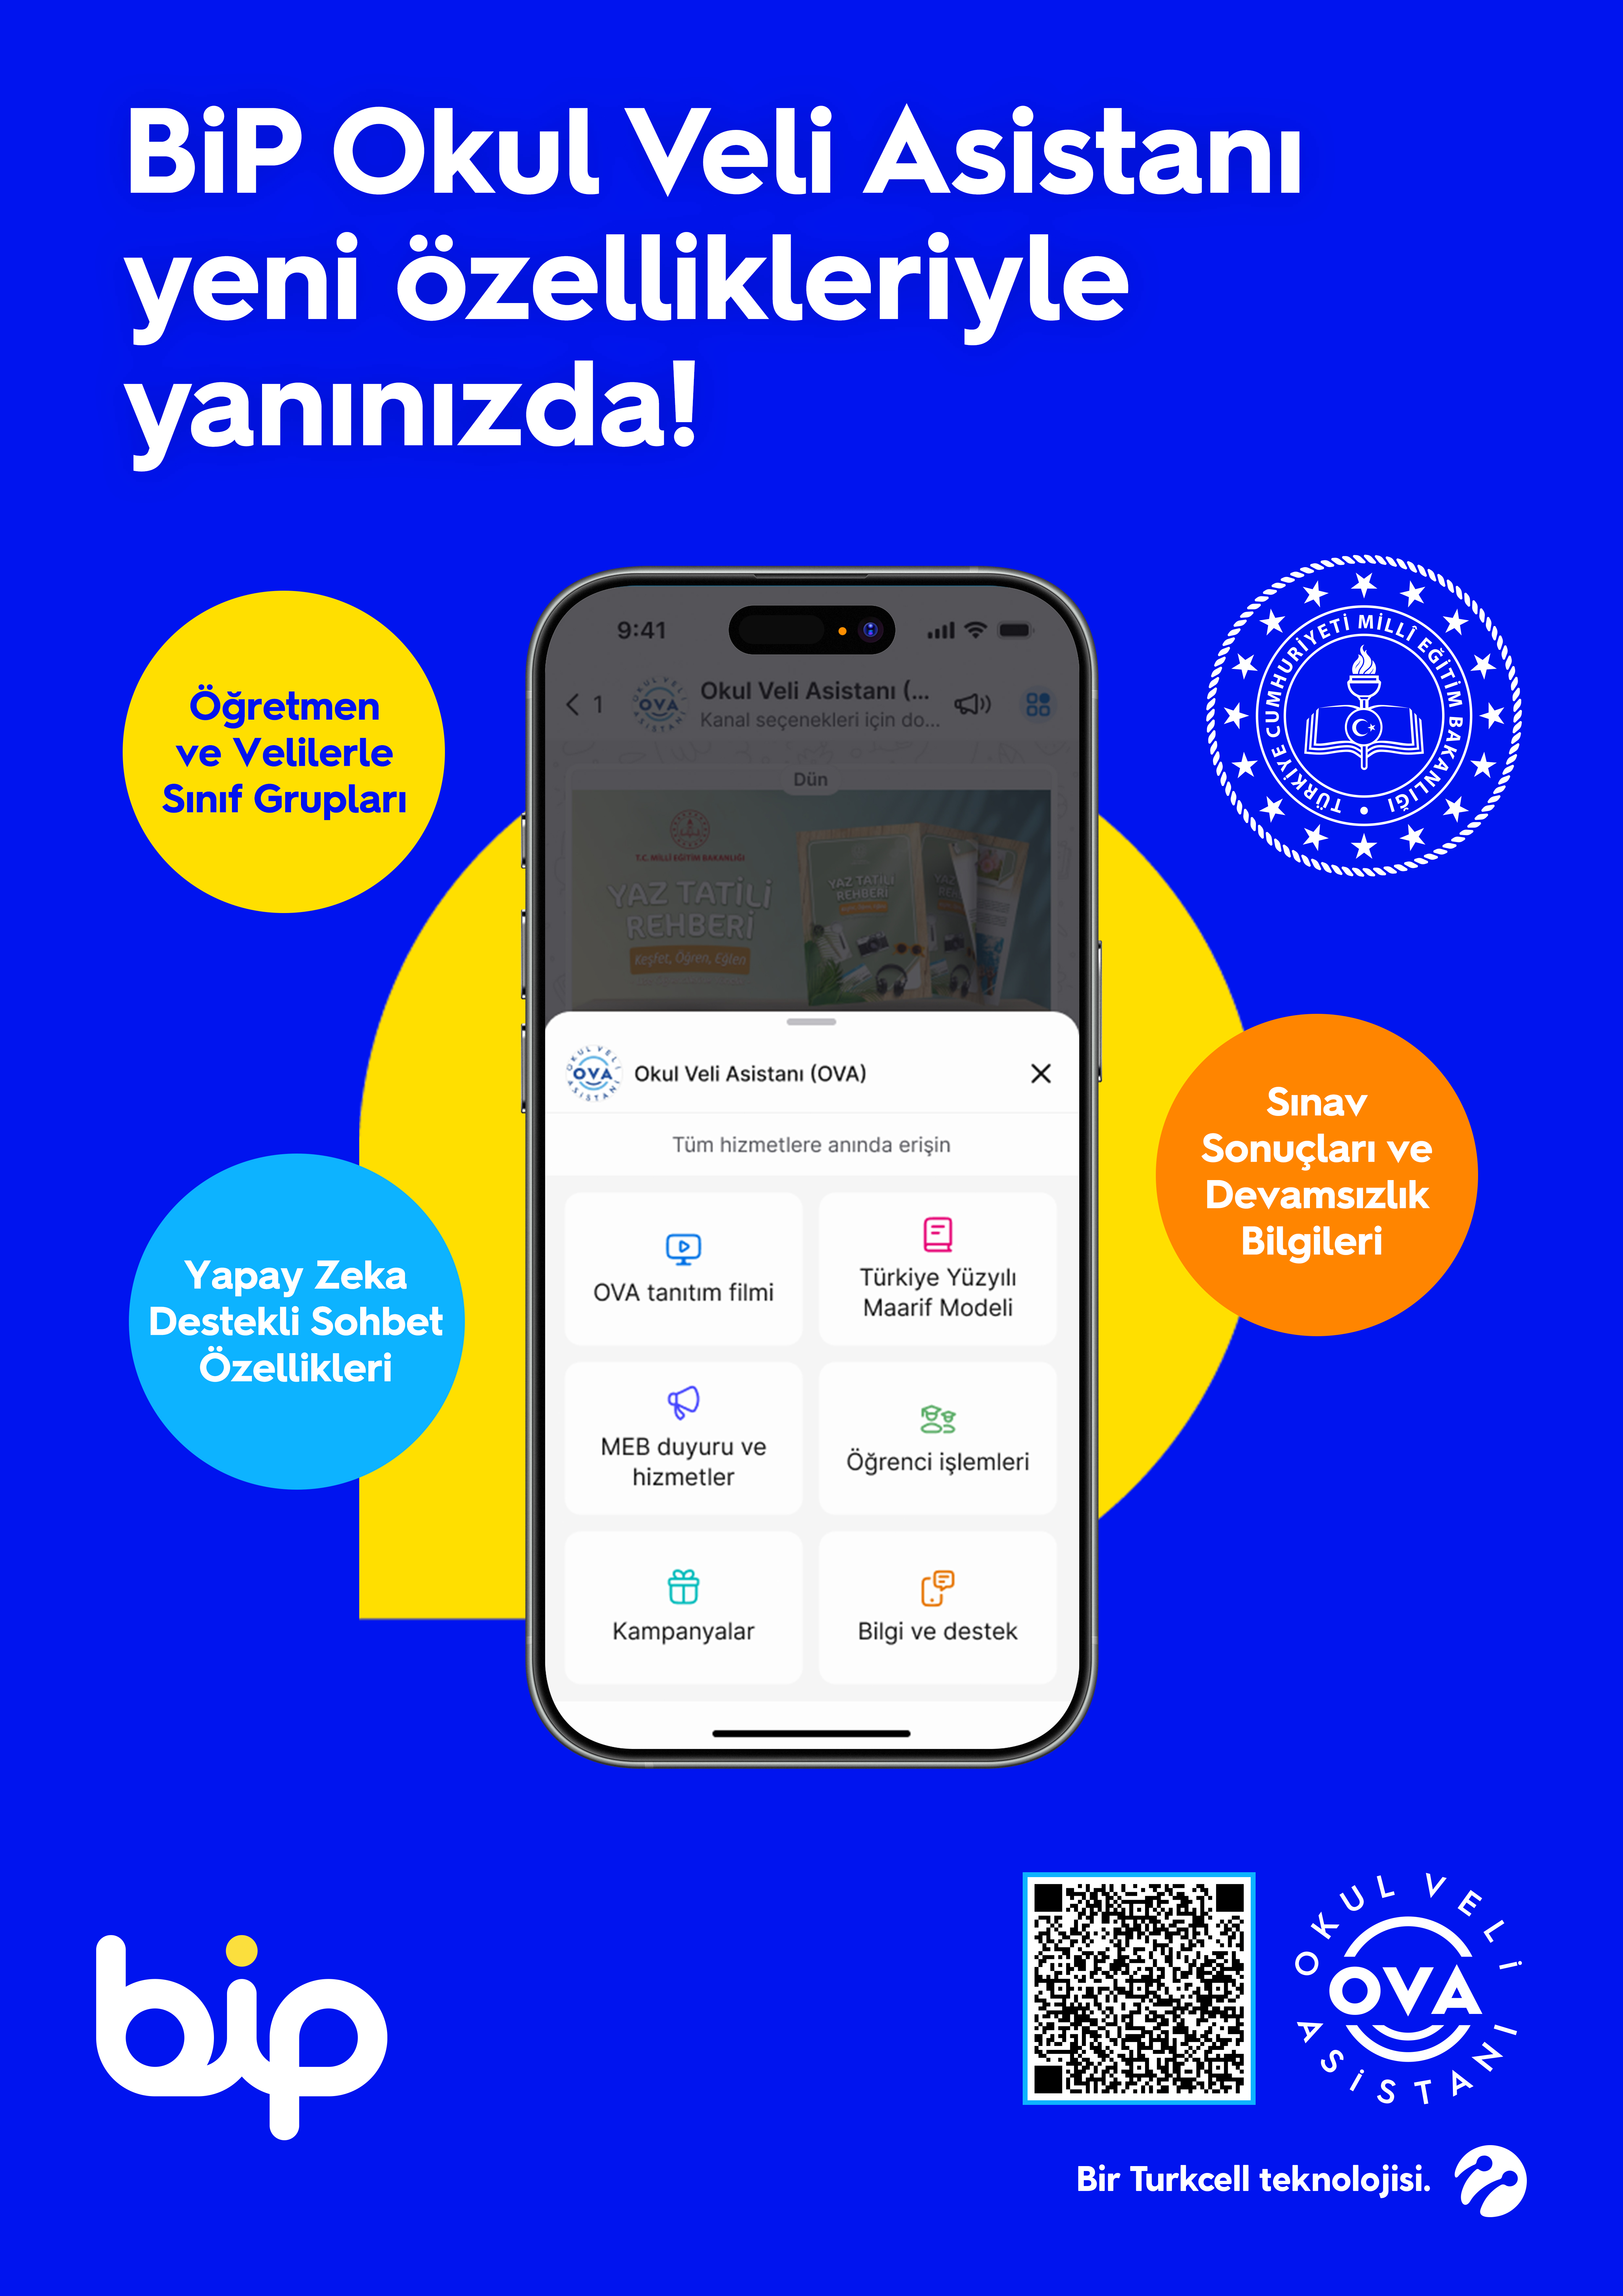
Turkcell’in mesajlaşma uygulaması BiP, geçtiğimiz yıl Millî Eğitim Bakanlığı ile gerçekleştirdiği stratejik iş birliği kapsamında Okul Veli Asistanı (OVA) kanalını kullanıma sunmuştu. Veliler, Okul Veli Asistanı (OVA) kanalı ile öğrencilerinin sınav sonuçlarını kolayca öğrenebiliyor. Aynı zamanda sınav tarihleri, devamsızlık bilgileri ve bakanlık duyuruları gibi detaylara da kanalın pratik arayüzü ile hızlı biçimde ulaşılabiliyor.
Okul Veli Asistanı bu sınav döneminde de velilerin yanında
Okul Veli Asistanı (OVA) kanalı, her eğitim-öğretim döneminde, özellikle de sınav sonuçlarının açıklandığı tarihlerde yoğun ilgi görüyor ve kullanım rekorları kırıyor.
Veliler, bu yıl da birinci dönem sınav haftası ve sonrasındaki günlerde, Okul Veli Asistanı (OVA) ile çocuklarının sınav sonuçlarına rahatlıkla bakabilecek.
Sınıf sohbet grupları otomatik kuruluyor
Yeni eğitim öğretim döneminde Okul Veli Asistanı (OVA) veliler için yeni bir özellik daha sunuyor. Artık öğretmenler, BiP üzerinde otomatik olarak sınıf sohbet grupları kurulabiliyor.
Millî Eğitim Bakanlığı’nın sisteminde yer alan, doğrulanmış veli iletişim bilgileriyle öğretmenlerin de dahil olduğu sohbet grupları BiP’te devreye giriyor. Böylece öğretmenlerin tek tek veli telefon numarası toplamasına ve grup oluşturmasına gerek kalmıyor. Öğretmenlerin ve velilerin telefon numaraları bu sohbet gruplarında açık bir şekilde gözükmüyor, gizli kalıyor. Dileyen veliler bu gruplara hızlı bir şekilde katılabiliyor.
Sınıf sohbet gruplarında mesajları yalnızca öğretmenler gönderebiliyor. Yapay zekâ destekli Pano özelliği ile önemli içerikler kategorize edilerek paylaşılabiliyor. Veliler de ihtiyaç duydukları içeriklere Pano alanından rahatlıkla ulaşabiliyor.
Sadece velilerin yer aldığı sınıf grupları da BiP**’**te
Veliler, öğretmenlerin dahil olmadığı, sadece sınıftaki velilerinden oluşan ayrı bir sohbet grubuna da tek bir adımda dahil olabiliyor. Veli sınıf grup sohbetlerinde de yapay zekâ özelliği kullanılabiliyor. Böylece veliler anlık takip edemedikleri uzun grup yazışmalarının özetine daha sonra erişebiliyor.
Ayrıca Turkcell, Türk Telekom ve Vodafone Pass aboneleri BiP’te internet kotalarından ücretsiz bir şekilde harcamadan iletişim kurabiliyor; sesli ve görüntülü görüşme yapabiliyor, mesaj, video ve fotoğraf gönderebiliyor.
**“**Okul Veli Asistanı (OVA) kanalına velilerin ilgisi; eğitimde tek kanaldan bilgi akışına duyulan ihtiyacı gösteriyor”
BiP Direktörü Eren Önal, BiP Okul Veli Asistanı kanalının genişleyen kapsamına dair şunları söyledi:
“BiP uygulamamızın Okul Veli Asistanı (OVA) kanalı, eğitimde güvenli ve tek kanaldan bilgi akışına duyulan ihtiyacı karşılayarak velilerimizin hayatını kolaylaştırıyor. Veliler, bu yılın ilk sınav haftasında da çocuklarının eğitim süreçleri ile ilgili bilgileri Okul Veli Asistanı (OVA) ‘dan hızlıca öğrenebilecek. Ayrıca sınav tarihleri, devamsızlık bilgileri ve bakanlık duyuruları gibi bilgilere de ulaşabilecek. Bu yıl devreye aldığımız sınıf sohbet gruplarıyla öğretmenler ve veliler arasındaki bilgi paylaşımını da kolaylaştırıyoruz. BiP’i önümüzdeki dönemde ek özelliklerle zenginleştirmek için çalışmalarımızı sürdürüyoruz.”
Okul Veli Asistanı (OVA) nasıl kullanılır?
Okul Veli Asistanı (OVA), tüm operatör kullanıcılarının anlık mesajlaşma uygulaması BiP içinde yer alan “Keşfet” alanından ücretsiz olarak katılabileceği bir kanal.
Okul Veli Asistanı (OVA) kanalını aktif bir şekilde kullanabilmek için velilerin ilk kullanımda e-Devlet üzerinden kimlik doğrulaması yaparak e-Okul sistemine bağlanması ve öğrencisini kanala eklemesi yeterli.
Veliler, Okul Veli Asistanı (OVA) ile öğrencilerinin sınav tarihleri, sınav notları, devamsızlık bilgileri ve nakil detaylarına ulaşabiliyor. Ayrıca öğretmenlerden randevu alabiliyor ve sınıf sohbet gruplarına katılabiliyor.
Millî Eğitim Bakanlığı tarafından paylaşılan güncel duyuru ve bilgilendirmeler de Okul Veli Asistanı (OVA) üzerinden iletiliyor.
Okul Veli Asistanı (OVA) kanalından gelen bilgiler, Turkcell’in Türkiye’deki veri merkezlerinde, KVKK ve ilgili mevzuata uygun şekilde şifrelenerek saklanıyor.
BiP nedir ve nasıl kullanılır?
BiP, Turkcell teknolojisini arkasına alarak Türk mühendisler tarafından, ülkemizde geliştirilen yerli ve millî bir anlık mesajlaşma uygulaması.
BiP operatör fark etmeksizin herkesin kullanımına açık, iOS ve Android cihazlara ücretsiz olarak indirilerek kullanılabiliyor.
Uygulama sayesinde, tüm operatörlerin kullanıcıları, internet paketlerinden harcamadan iletişim kurabiliyor. Turkcell, Türk Telekom ve Vodafone Pass aboneleri BiP’te GB harcamadan sesli ve görüntülü görüşme yapabiliyor, mesaj, video ve fotoğraf gönderebiliyor.
Uygulama şu anda aktif olarak 192 ülkede kullanılıyor ve “Anlık Çeviri Özelliği” ile 100’den fazla farklı dil çevirisini destekliyor.
BiP’te Okul Veli Asistanı (OVA) kanalının yanı sıra eğlenceden iş dünyasına, finanstan aktüel haberlere kadar birbirinden farklı konu ve ilgi alanına yönelik farklı kanallar da yer alıyor.
Öğretmenler sınıf sohbet gruplarını nasıl kurabilir?
Millî Eğitim Bakanlığı ve Turkcell iş birliğiyle BiP uygulaması üzerinden, sadece öğretmenler ve idari eğitim personelinin kullanımına açık olan Öğretmen Bilgi Servisi, özel ve güvenli bir iletişim kanalı.
Sınıf sohbet gruplarını oluşturmak için öğretmenler otomatik olarak eklendikleri Öğretmen Bilgi Servisi’ni kullanıyor.
Öğretmen Bilgi Servisi, Millî Eğitim Bakanlığı’nın sistemindeki doğrulanmış veli telefon numaraları ile sohbet gruplarını otomatik olarak kurabiliyor. Veliler ise Okul Veli Asistanı (OVA) kanalı ve SMS aracılığı ile kendilerine gelen davet üzerinden gruplara katılabiliyor.
Bu gruplarda sadece öğretmenler aktif olarak paylaşım yapabiliyor, Öğretmen Bilgi Sevisi aracılığı ile kendilerine açılan menüler sayesinde de grup yazışmalarını kolaylıkla yönetebiliyor.
BiP uygulaması aşağıdaki linkten ücretsiz olarak indirilebiliyor:
BiP uygulama linki
Medya Paket İçeriği: (3)
TÜMÜNÜ İNDİR
© 2026 Turkcell