Community Impact News Scholars USC The Hidden Chemistry of Human Survival November 4, 2025 1823 Views USC Viterbi Staff | October 29, 2025 Jeremy Alexander, Doug Peacock Scholar, finds innovation in overlooked spaces – from wastewater microbes to…

Community Impact
News
Scholars
USC
The Hidden Chemistry of Human Survival
November 4, 2025
1823 Views
USC Viterbi Staff | October 29, 2025
Jeremy Alexander, Doug Peacock Scholar, finds innovation in overlooked spaces – from wastewater microbes to aerospace materials – to protect life on Earth and beyond.
The smallest things often matter most.
In rice paddies near Sacramento, Jeremy Alexander waded knee-deep into murky water, collecting soil samples that most people would dismiss as ordinary mud.
But Alexander saw something else entirely: a hidden world of microorganisms that could revolutionize how we clean water and protect human health.
“I innovate in the spaces most overlook,” explains Alexander, a USC Viterbi School of Engineering
junior majoring in biomedical engineering
with a minor in marine biology. “These places hold hidden complexities, and discovery in these spaces can change how we live.”
Alexander’s work — spanning everything from microscopic bacteria to rocket fuel chemistry — exemplifies the kind of boundary-pushing research that the Doug Peacock Scholarship
was designed to support. The scholarship, established by TransDigm Group Inc.
in 2021, provides financial support to underrepresented students in STEM fields and has enabled more than 105 USC Viterbi students to pursue ambitious research projects. TransDigm, headquartered in Cleveland, Ohio, is a leading global designer, producer and supplier of highly engineered aircraft components.
For Alexander, the scholarship opened doors that might otherwise have remained closed. It connected him to TransDigm’s network, leading to a summer internship at TA Aerospace
, a TransDigm operating unit, where he discovered that “invisible chemistry decides visible safety.”

Photo Illustration: Jeremy Alexander’s work includes testing elastomer seals for jet engines this past summer at TA Aerospace, as well as researching PFAS “forever chemicals;” previously, he has analyzed microbial communities in rice paddies near Sacramento.
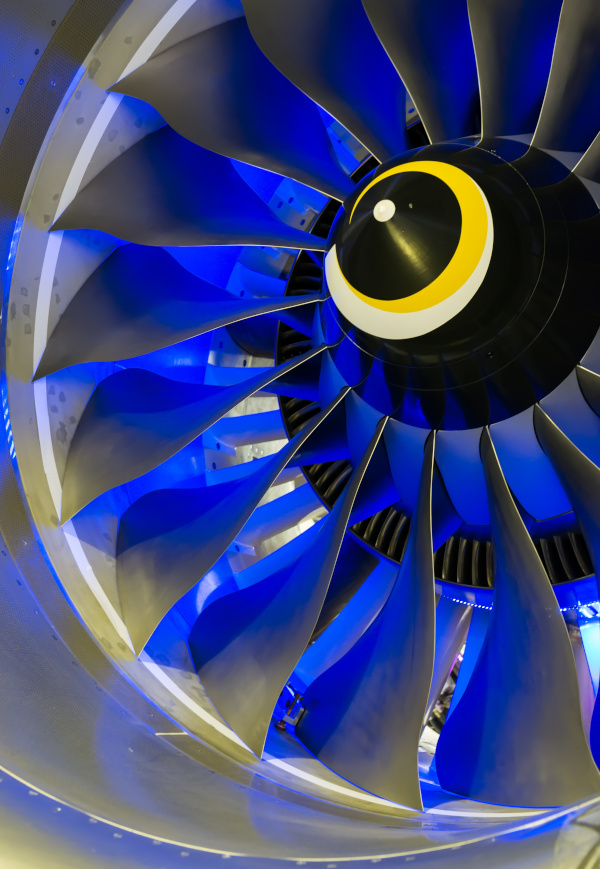
At TA Aerospace, Alexander tested elastomer seals — flexible, rubber-like materials that prevent fuel leaks in aircraft and spacecraft engines — analyzing how different types of fuel affected their performance. He exposed these specialized rubber seals to both sustainable aviation fuel and military-grade JP8 fuel, then tested whether they could still stretch without breaking, resist tearing and hold up under extreme temperatures and pressures. Using advanced chemical analysis techniques, he identified specific compounds in the fuel mixtures while also researching PFAS — the so-called “forever chemicals” that don’t break down in the environment and pose growing health risks.
“The most rewarding aspect,” Alexander reflected, “was knowing my work fed into a chain of protection that ultimately keeps people alive in the air, from passengers to astronauts.”
Said Michele Starrs
, TA Aerospace president: “By offering internships and hands-on experiences, we don’t just view USC students as future hires — we see them as collaborators in solving real engineering challenges. Connecting early helps students understand how different parts of the business operate, and it enables us to nurture talent that is already familiar with our culture, values and technical demands. Jeremy brought specific enthusiasm to the idea of environmental sustainability and helped kick off research into how our industry can begin to phase out PFAS, or ‘forever chemicals.’”
That connection between invisible processes and human survival threads through all of Alexander’s research. In Professor Adam Smith’s environmental engineering lab at USC
, he cultivates specialized microbes for nutrient removal in wastewater treatment. Working alongside Ph.D. student Raven Althouse, Alexander has analyzed more than 250 ion chromatography samples and maintained bioreactors at precise conditions to understand how microorganisms can transform nitrogen cycles.

Alexander earned second place in last spring’s Sonny Astani Department of Civil & Environmental Engineering research symposium.
Last May, his poster on membrane biofilm reactors earned second place in a research symposium for the Sonny Astani Department of Civil & Environmental Engineering. When asked to explain his research as a bedtime story, Alexander offers this simple version: “There are tiny bugs in the water, too small to see but strong enough to eat pollution. When we give them the right kind of home, they clean the water for us, turning something dirty into something safe for our health.”
The rice paddy samples Alexander collected last summer are still being analyzed for microbial communities, heavy metals and PFAS contamination. Rice paddies’ waterlogged, oxygen-poor soils create natural environments for organisms like Anammox and n-DAMO — microbes that link nitrogen and methane cycling in ways critical to both agriculture and climate.
PFAS compounds have become a recurring theme in Alexander’s work, appearing both in the high-performance aerospace materials he studied at TA Aerospace and in the environmental samples he analyzes at USC.
“I didn’t choose PFAS as a research focus; its ubiquity in both aerospace and the environment made it impossible to ignore,” he said. “The same chemistry that makes PFAS nearly indestructible for engineering also makes them nearly impossible to remove from the environment.”
Alexander’s research interests extend beyond the laboratory. As a certified scientific diver through USC’s Wrigley Institute
on Catalina Island, he has journeyed to the ocean floor, studying invertebrates. His most memorable dives were at night, descending into total darkness to recover lost objects while lobsters crawled over rocks and fish darted through kelp forests.
“That experience captured what I love about research in any setting — whether underwater, in soils, or in reactors,” Alexander says. “The most important discoveries often come when you step into places that feel unfamiliar and find novelty in what others might overlook.”

Alexander, a certified scientific diver, has studied invertebrates through USC’s Wrigley Institute on Catalina Island.
Looking toward the future, Alexander doesn’t dream of planting flags on Mars, but he does dream of “making sure the person who does can thrive there.” He envisions engineering microbial and natural systems that recycle air and water in closed habitats, developing novel polymers and coatings that resist radiation and volatile fuels.
“For me,” Alexander notes, “space is not a backdrop but a test: how can we protect human health when the environment turns hostile?”
Beyond his research pursuits, Alexander brings an eclectic curiosity to everything he does. He’s interested in toxicology and venoms, conserves ancient artifacts in USC’s archaeology lab, and has earned certifications in everything from pharmacy technology to bear identification from Idaho Fish and Game. He’s also learning guitar, practices early morning swims and admits to drinking two glasses of milk daily.
“One thing I’d say is that I’m a jolly person,” Alexander says with characteristic enthusiasm. “I laugh easily, I’m quick to joy, and I can find fun in just about anything.”
Without the Doug Peacock Scholarship, Alexander believes his curiosity would still be alive, “but my reach wouldn’t be as vast.” The scholarship provided not just financial support, but connections that transformed his academic trajectory — from aerospace internships to research opportunities that span from microscopic organisms to space exploration.
“Whether the system is a reactor, a spacecraft, or another planet, the goal is the same,” Alexander said. “To turn fragile conditions into places where people can survive and thrive.”
This post is adapted from the original article, “The Hidden Chemistry of Human Survival” published on
https://viterbischool.usc.edu/:
https://viterbischool.usc.edu/news/2025/10/the-hidden-chemistry-of-human-survival/
Share
Related posts

Sep 11, 2026
Clemson
, Community Impact
, News
, Scholars

Sep 11, 2026
Community Impact
, CSU
, News
, Scholars

Jun 17, 2026
Benedictine
, Community Impact
, News
, Scholars

Jun 24, 2025
Community Impact
, Drexel
, News
, Scholars

Jun 02, 2025
Community Impact
, Foster School of Business
, News
, Scholars
, Washington

TransDigm Group
1350 Euclid Avenue
Suite 1600
Cleveland, Ohio 44115
216-706-2960
Quick Links
Company
Notice at Collection
'%3e%3cg id='Final-Copy-2_2_' transform='translate(1275.000000, 200.000000)'%3e%3cpath class='st0' d='M7.4,12.8h6.8l3.1-11.6H7.4C4.2,1.2,1.6,3.8,1.6,7S4.2,12.8,7.4,12.8z'/%3e%3c/g%3e%3c/g%3e%3c/g%3e%3cg id='final---dec.11-2020'%3e%3cg id='_x30_208-our-toggle' transform='translate(-1275.000000, -200.000000)'%3e%3cg id='Final-Copy-2' transform='translate(1275.000000, 200.000000)'%3e%3cpath class='st1' d='M22.6,0H7.4c-3.9,0-7,3.1-7,7s3.1,7,7,7h15.2c3.9,0,7-3.1,7-7S26.4,0,22.6,0z M1.6,7c0-3.2,2.6-5.8,5.8-5.8 h9.9l-3.1,11.6H7.4C4.2,12.8,1.6,10.2,1.6,7z'/%3e%3cpath id='x' class='st2' d='M24.6,4c0.2,0.2,0.2,0.6,0,0.8l0,0L22.5,7l2.2,2.2c0.2,0.2,0.2,0.6,0,0.8c-0.2,0.2-0.6,0.2-0.8,0 l0,0l-2.2-2.2L19.5,10c-0.2,0.2-0.6,0.2-0.8,0c-0.2-0.2-0.2-0.6,0-0.8l0,0L20.8,7l-2.2-2.2c-0.2-0.2-0.2-0.6,0-0.8 c0.2-0.2,0.6-0.2,0.8,0l0,0l2.2,2.2L23.8,4C24,3.8,24.4,3.8,24.6,4z'/%3e%3cpath id='y' class='st3' d='M12.7,4.1c0.2,0.2,0.3,0.6,0.1,0.8l0,0L8.6,9.8C8.5,9.9,8.4,10,8.3,10c-0.2,0.1-0.5,0.1-0.7-0.1l0,0 L5.4,7.7c-0.2-0.2-0.2-0.6,0-0.8c0.2-0.2,0.6-0.2,0.8,0l0,0L8,8.6l3.8-4.5C12,3.9,12.4,3.9,12.7,4.1z'/%3e%3c/g%3e%3c/g%3e%3c/g%3e%3c/g%3e%3c/svg%3e)Your Privacy Choices
Search for: Search
Hit enter to search or ESC to close