1
INVESTOR CONTACT Chad Bennett [email protected]
MEDIA CONTACT Jennifer Donahue [email protected]
Teradata Reports Third Quarter 2026 Financial Results
• Cash flow from operations of $91 million and Adjusted Free Cash Flow of $96 million (3)
• Third quarter GAAP diluted EPS of $0.40 and non-GAAP diluted EPS of $0.70 (2)
• Reiterate full year outlook for Total ARR and Adjusted Free Cash Flow; narrowing the Total Revenue and Recurring Revenue outlook to the high-end of the range
SAN DIEGO – November 5, 2026 -- Teradata (NYSE: TDC) today announced its third quarter 2026 financial results.
“In Q3, Teradata marked another quarter of progress against the goals we set at the start of the year, driving total ARR growth, improving profitability and delivering strong free cash flow," said Steve McMillan, president and CEO, Teradata. "The increased pace of new product innovation and new AI service capabilities is driving positive interest from customers.”
Third Quarter 2026 Financial Highlights Compared to Third Quarter 2025
• Total ARR increased to $1.512 billion from $1.490 billion, an increase of 1% as reported and
2% in constant currency
(1)
• Public cloud ARR increased to $700 million from $633 million, an increase of 11% as reported and 11% in constant currency (1)
• Total revenue was $399 million versus $416 million, a decrease of 4% as reported and 4% in constant currency (1)
• Recurring revenue was $359 million versus $366 million, a decrease of 2% as reported and
2% in constant currency
(1)
• Recurring revenue was 90% of total revenue versus 88%
• GAAP gross margin was 59.6% versus 60.8%
• Non-GAAP gross margin was 60.7% versus 62.3%
(2)
• GAAP operating margin was 13.5% versus 14.7%
• Non-GAAP operating margin was 21.8% versus 23.6%
(2)
• GAAP diluted EPS was $0.40 versus $0.42 per share
2
• Non-GAAP diluted EPS was $0.70 versus $0.72 per share (2)
• Cash flow from operations was $91 million compared to $94 million • Free cash flow was $85 million compared to $88 million (3)
• Adjusted free cash flow was $96 million compared to $88 million (3)
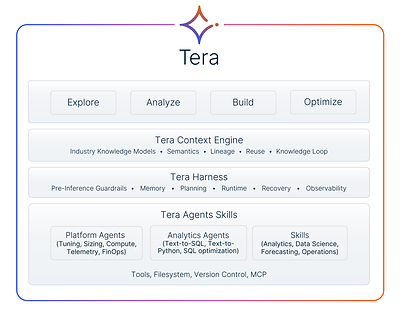
Q3 2026 Product and Innovation Highlights • Released Teradata Factory for general availability, an integrated GPU system combining analytics, AI, and governance that keeps data within an organization’s own walls. • Evolved Tera into an agentic coworker for enterprise data work, letting anyone analyze data, build AI applications, operate infrastructure, and automate workflows in natural language. • Announced Tera Context Engine, a vendor-neutral layer that connects databases, data platforms, pipelines, catalogs, models, and AI agents, giving AI governed business knowledge wherever data lives. • Launched Tera Harness, an execution layer that routes work to the right skills, tools, data, and models, improving AI accuracy, speed, and efficiency. • Made Teradata’s Data Analyst Agent available in AWS Marketplace and integrated Teradata Autonomous Knowledge Platform with Microsoft OneLake, so customers can run Teradata AI on OneLake data without moving or copying it. • Tera delivered 53% lower cost per reliably solved task than Snowflake Cortex Code, compared to Snowflake’s own published benchmark data on the data-eng-bench. This internal test used a public benchmark of data pipeline engineering created by Snowflake Labs and Bespoke Labs.
Outlook
For the full-year 2026, Teradata increases the following ranges:
• GAAP diluted EPS is now expected to be in the range of $4.63 to $4.67
• Non-GAAP diluted EPS is now expected to be in the range of $2. 86 to $2. 90 per share
(2)
For the full-year 2026, Teradata narrows to the high-end of the previous ranges:
• Recurring revenue in the range of 1% to 2% year-over-year
• Total revenue in the range of -1% to flat year-over-year
For the full-year 2026, Teradata reaffirms the following ranges:
• Total ARR growth of 2% to 4% year-over-year
• Cash flow from operations of $665 million to $685 million, which includes an after-tax net
benefit of $315 million related to a settlement with SAP
3
• Adjusted free cash flow of $330 million to $350 million (3)
For the fourth quarter of 2026: • Recurring revenue in the range of -2% to -4% year-over-year • Total revenue in the range of -4% to -6% year-over-year • GAAP diluted EPS is expected to be in the range of $0.26 to $0.30 per share • Non-GAAP diluted EPS is expected to be in the range of $0.58 to $0.62 per share (2)
Earnings Conference Call
The conference call will begin at 1:30 p.m. PT on November 5, 2026. Investors and participants
may attend the call by dialing (585) 542-9983 and entering access code 369709903. For
investors and participants outside the United States, see global dial-in numbers here, and use
access code 369709903.
The live webcast, as well as a replay, will be available on the Investor Relations page of the Teradata website at investor.teradata.com.
4
Supplemental Financial Information
Additional information regarding Teradata’s operating results is provided below as well as on Teradata’s website at investor.teradata.com.
- The impact of currency is determined by calculating the prior-period results using the current-year monthly average currency rates. See the foreign currency fluctuation schedule, which is used to determine revenue on a constant currency (“CC”) basis, on the Investor Relations page of the Company’s website at investor.teradata.com.
Revenue
(in millions)
For the Three Months ended September 30
2026
2025
% Change as Reported
% Change in CC Recurring revenue $359 $366 (2%) (2%) Perpetual software licenses, hardware and other 3 3 0% (25%) Consulting services 37 47 (21%) (19%) Total revenue $399
$416
(4%)
(4%)
Product Sales $362 $369 (2%) (2%) Consulting Services 37 47 (21%) (19%) Total revenue $399 $416 (4%) (4%)
Revenue
(in millions)
For the Nine Months ended September 30
2026
2025
% Change as Reported
% Change in CC Recurring revenue $1,122 $1,078 4% 3% Perpetual software licenses, hardware and other 12 16 (25%) (25%) Consulting services 119 148 (20%) (19%) Total revenue $1,253 $1,242
1%
0%
Product Sales $1,134 $1,094 4% 2% Consulting Services 119 148 (20%) (19%)
Total revenue $1,253 $1,242 1% 0%
As of September 30
2026 2025
% Change as Reported
% Change in CC Annual recurring revenue* $1,512 $1,490
1% 2%
Public cloud ARR** $700 $633 11%
11%
The impact of currency on ARR is determined by calculating the prior period ending ARR using the current period end
currency rates.
*Total Annual Recurring Revenue ("Total ARR") is defined as the annual contract value for all active and contractually binding term-based contracts at the end of the period, including cloud, recurring AI services, subscriptions, hardware rental, maintenance, and software upgrade rights. The Company believes this is a useful metric to investors as it demonstrates progress toward achieving our strategic objectives as outlined in the Form 10-K and Form 10-Q.
**Public cloud ARR is defined as the annual contract value for all active and contractually binding term-based contracts at the end of a period that are operated in a public cloud environment. The Company believes this is a useful metric to investors as it demonstrates progress toward achieving our strategic objectives as outlined in the Form 10-K and Form 10-Q.
5
- Teradata reports its results in accordance with GAAP. However, as described below, the Company believes that certain non-GAAP measures such as free cash flow, adjusted free cash flow, non-GAAP gross profit, non-GAAP operating income, non-GAAP net income, and non-GAAP diluted earnings per share, all of which exclude certain items, and which may be reported on a constant currency basis, are useful for investors. Our non-GAAP measures are not meant to be considered in isolation to, as substitutes for, or superior to, results determined in accordance with GAAP, and should be read only in conjunction with our condensed consolidated financial statements prepared in accordance with GAAP. Each of our non-GAAP measures do not have a uniform definition under GAAP and therefore, Teradata’s definition may differ from other companies’ definitions of these measures.
The following tables reconcile Teradata’s actual and projected results and EPS under GAAP to the Company’s actual and projected non-GAAP results and EPS for the periods presented, which exclude certain specified items. Our management internally uses supplemental non-GAAP financial measures, such as gross profit, operating income, net income, and EPS, excluding certain items, to understand, manage and evaluate our business and support operating decisions on a regular basis. The Company believes such non-GAAP financial measures (1) provide useful information to investors regarding the underlying business trends and performance of the Company’s ongoing operations, (2) are useful for period-over-period comparisons of such operations and results, that may be more easily compared to peer companies and allow investors a view of the Company’s operating results excluding stock-based compensation expense and special items, (3) provide useful information to management and investors regarding present and future business trends, and (4) provide consistency and comparability with past reports and projections of future results.
For the Three Months
For the Nine Months
(in millions, except per share data)
ended September 30
ended September 30
Gross Profit:
2026
2025
% Chg.
2026
2025 % Chg. GAAP Gross Profit
$238
$253
(6%)
$757
$731
4% % of Revenue
59.6%
60.8%
60.4%
58.9%
Excluding:
Stock-based compensation expense
5
4
13
13
Reorganization and other costs
(1)
2
3
5
Non-GAAP Gross Profit
$242
$259
(7%)
$773
$749
3% % of Revenue
60.7%
62.3%
61.7%
60.3%
Operating Income
GAAP Operating Income
$54
$61
(11%)
$66
$151
(56%) % of Revenue
13.5%
14.7%
5.3%
12.2%
Excluding:
Stock-based compensation expense
33
29
95
82
Reorganization and other costs - 8
14
23
SAP settlement costs
121
Non-GAAP Operating Income
$87
$98
(11%)
$296
$256
16% % of Revenue
21.8%
23.6%
23.6%
20.6%
Net Income
GAAP Net Income
$38
$40
(5%)
$419
$93
351% % of Revenue
9.5%
9.6%
33.4%
7.5%
Excluding:
Stock-based compensation expense
33
29
95
82
Reorganization and other costs 1 7
14
22
SAP settlement - -
(359)
Income tax adjustments (i)
(5)
(7)
49
(19)
Non-GAAP Net Income $67 $69 (3%)
$218
$178
22% % of Revenue
16.8%
16.6%
17.4%
14.3%
6
For the Three Months ended September 30
For the Nine Months ended September 30
2026 Outlook Earnings Per Share: 2026
2025 2026 2025 Q4 FY GAAP Earnings Per Share $0.40 $0.42 $4.36 $0.96
$0.26 - $0.30 $4.63 - $4.67
Excluding:
Stock-based compensation expense 0.34
0.30
0.99 0.85
0.31 1.30 Reorganization and other costs 0.01
0.07 0.14 0.23
0.08 0.21 SAP Settlement - - (3.73) -
- (3.73) Income tax adjustments (i) (0.05) (0.07) 0.51 (0.20)
(0.07) 0.45 Non-GAAP Diluted Earnings Per Share $0.70
$0.72 $2.27 $1.84
$0.58 - $0.62 $2.86 - $2.90
i. Represents the income tax effect of the pre-tax adjustments to reconcile GAAP to Non-GAAP income based on the applicable jurisdictional statutory tax rate of the underlying item, including the $69 million discrete income tax effect of the SAP settlement recorded in the first nine months of 2026. Including the income tax effect assists investors in understanding the tax provision associated with those adjustments and the effective tax rate related to the underlying business and performance of the Company’s ongoing operations. As a result of these adjustments, the Company’s GAAP effective tax rate and non-GAAP effective tax rate for the three months ended September 30, 2026, was 24.0% and 20.2%, respectively, and September 30, 2025, was 25.9% and 23.3%, respectively. For the nine months ended September 30, 2026, the Company’s GAAP effective tax rate and non- GAAP effective tax rate was 21.5% and 23.2%, respectively and September 30, 2025, was 25.6% and 22.3%, respectively.
- As described below, the Company believes that free cash flow and adjusted free cash flow are useful non-GAAP measures for investors. Free cash flow and adjusted free cash flow do not have a uniform definition under GAAP in the United States and therefore, Teradata's definitions may differ from other companies' definitions of this measure. Teradata defines free cash flow as cash provided by/used in operating activities, less total capital expenditures and adjusted free cash flow as free cash flow less the gross proceeds from the SAP settlement, plus the non-recurring legal and other expenses incurred in connection with the SAP litigation and resulting settlement, and taxes paid specific to the settlement agreement. Teradata’s management uses free cash flow and adjusted free cash flow to assess the financial performance of the Company and believes they are useful for investors because they relate the operating cash flow of the Company to the capital that is spent to continue and improve business operations. In particular, free cash flow indicates the amount of cash generated after capital expenditures which can be used for among other things, investments in the Company's existing businesses, strategic acquisitions, strengthening the Company’s balance sheet, repurchase of Company stock and repay the Company’s debt obligations and adjusted free cash flow adjusts the impact of the SAP settlement. Neither free cash flow or adjusted free cash flow represent the residual cash flow available for discretionary expenditures since there may be other non-discretionary expenditures that are not deducted from these measures. These non-GAAP measures should not be considered as a substitute for, or superior to, cash flows from operating activities under GAAP.
(in millions)
For the
Three Months
ended September 30
For the
Nine Months
ended September 30
Outlook
2026
2025
2026
2025
2026
Cash provided by operating activities (GAAP) $91
$94 $598 $145 $665 to $685 Less total capital expenditures (6)
(6) (18) (11) (~20) Free Cash Flow (non-GAAP measure) $85
$88 $580 $134 $645 to $665 Less SAP gross settlement proceeds - - (480) - (480) Plus legal and other expenses - - 121 - 121 Plus taxes specific to the settlement 11 - 33 - 44 Adjusted Free Cash Flow (non-GAAP Measure) $96 $88 $254 $134 $330 to $350
7
Note to Investors This release contains forward-looking statements within the meaning of Section 21E of the Securities and Exchange Act of 1934. Forward-looking statements generally relate to opinions, beliefs, and projections of expected future financial and operating performance, business trends, liquidity, and market conditions, among other things. These forward-looking statements are based upon current expectations and assumptions and often can be identified by words such as “expect,” “strive,” “looking ahead,” “outlook,” “guidance,” “forecast,” “anticipate,” “continue,” “plan,” “estimate,” “believe,” “focus,” “see,” “commit,” “should,” “project,” “will,” “would,” “likely,” “intend,” “potential,” or similar expressions. Forward-looking statements in this release include our 2026 fourth quarter and 2026 full year financial outlook and product innovation and demand. Forward-looking statements involve risks and uncertainties that could cause actual results to differ materially, including those relating to: our strategy and ongoing business transformation, significant execution risk for our cloud, hybrid, on-premises, Artificial Intelligence (“AI”) and Machine Learning (“ML”) offerings, operational disruptions and unforeseen circumstances, impact of unanticipated delays or acceleration in our sales cycles to make accurate estimates impacting quarterly operating results, financial guidance and forecasts, the global economic environment and business conditions in general, including inflation, tariffs, and/or recessionary conditions; impact of price increase on our net sales, profit margins and earnings, the ability of our suppliers to meet their commitments to us; the timing of purchases, migrations, or expansions by our current and potential customers, including our ability to retain customers; the rapidly changing and intensely competitive nature of the information technology industry, the data analytics business, and artificial intelligence capabilities; fluctuations in our operating, capital allocation, and cash flow results; our ability to execute and realize the anticipated benefits of our refreshed brand, business transformation program or restructuring, sales and operational execution initiatives, and cost saving initiatives, including restructuring actions; risks inherent in operating in foreign countries, export controls and trade compliance, including sanctions, tariffs, foreign currency fluctuations, and/or acts of war; risks associated with data privacy, IP-enforcement actions, cyberattacks and maintaining secure and effective products for our customers, as well as, internal information technology and control systems; the timely and successful development, production or acquisition, availability and/or market acceptance of new and existing products, product features and services, including for our artificial intelligence, cloud, on-prem and hybrid offerings, tax rates; turnover of our workforce and the ability to attract and retain skilled employees; protecting our intellectual property; availability and successful execution of new alliance and acquisition opportunities; subscription arrangements that may be cancelled or fail to be renewed; the impact on our business and financial reporting from changes in accounting rules; and other factors described from time to time in Teradata’s filings with the U.S. Securities and Exchange Commission, including its most recent annual report on Form 10-K, and subsequent quarterly reports on Forms 10-Q or current reports on Forms 8-K, as well as Teradata’s annual report to stockholders. Teradata does not undertake any obligation to publicly update or revise any forward-looking statements, whether as a result of new information, future events or otherwise, except as required by law.
About Teradata
Teradata empowers enterprises to turn intelligence into autonomous action, grounding AI agents in
deep business context and trusted data. As AI agents multiply, Teradata is the context foundation,
governance layer, and performance backbone that companies need now. The Teradata
Autonomous Knowledge Platform puts AI into production across cloud, on-premises, and hybrid
environments. See how at Teradata.com.
#
The Teradata logo is a trademark, and Teradata is a registered trademark of Teradata Corporation and/or its affiliates in the U.S. and worldwide.
Schedule A
TERADATA CORPORATION
CONDENSED CONSOLIDATED STATEMENTS OF INCOME
(in millions, except per share amounts - unaudited)
For the Period Ended September 30
Three MonthsNine Months
20262025% Chg20262025% Chg
Revenue
Recurring 359$ 366$
(2%)
1,122$
1,078$
4%
Perpetual software licenses, hardware and other3 3
0%12 16 (25%)
Consulting services37
47 (21%)119 148 (20%)
Total revenue399 416
(4%)
1,253
1,242
1%
Gross profit
Recurring239 250
759
735
% of Revenue66.6%68.3%67.6%68.2%
Perpetual software licenses, hardware and other(1)
3 2 4
% of Revenue(33.3%)100.0%16.7%25.0%
Consulting services- -
(4)
(8)
% of Revenue- % - (3.4%)(5.4%)
Total gross profit
238 253
757
731
% of Revenue
59.6%60.8%
60.4%58.9%
Selling, general and administrative expenses109 122
469
373
Research and development expenses75
70 222 207
Income from operations
54 61 66 151
% of Revenue13.5%14.7%5.3%12.2%
Other (expense) income, net(4) (7)
468 (26)
Income before income taxes
50
54 534 125
% of Revenue12.5%13.0%42.6%10.1%
Income tax expense
12 14
115 32
% Tax rate24.0%25.9%21.5%25.6%
Net income 38$ 40$
419$ 93$
% of Revenue9.5%9.6%33.4%7.5%
Net income per common share
Basic 0.41$
0.42$ 4.50$ 0.98$
Diluted0.40$
0.42$ 4.36$ 0.96$
Weighted average common shares outstanding
Basic92.6 94.2 93.2 94.9
Diluted95.5
95.5
96.2 96.5
Schedule B
TERADATA CORPORATION
CONDENSED CONSOLIDATED BALANCE SHEETS
(in millions - unaudited)
September 30,
December 31,September 30,
2026
20252025
Assets
Current assets
Cash and cash equivalents
432$ 493$
406$
Accounts receivable, net202 251 309
Inventories13 13 5
Other current assets84 80 91
Total current assets
731 837
811
Property and equipment, net183 198 203
Right of use assets - operating lease, net7 7 7
Goodwill397 399
399
Capitalized contract costs, net
38 42
35
Deferred income taxes164 209
212
Other assets83 87
94
Total assets
1,603$ 1,779$ 1,761$
Liabilities and stockholders' equity Current liabilities Current portion of long-term debt-$ 25$ 25$
Current portion of finance lease liability46 50
56
Current portion of operating lease liability2 2 3
Accounts payable74 96 100
Payroll and benefits liabilities116 120 96
Deferred revenue466 533 527
Other current liabilities73 88 99
Total current liabilities
777 914 906
Long-term debt- 431 437
Finance lease liability43 45 47
Operating lease liability5 4 5
Pension and other postemployment plan liabilities110 114 104
Long-term deferred revenue
11 11
12
Deferred tax liabilities12 12
10
Other liabilities32 18 21
Total liabilities
990 1,549 1,542
Stockholders' equity
Common stock1 1 1
Paid-in capital2,398 2,305 2,279
Accumulated deficit(1,636) (1,923) (1,923)
Accumulated other comprehensive loss(150) (153) (138)
Total stockholders' equity
613 230 219
Total liabilities and stockholders' equity1,603$ 1,779$ 1,761$
Schedule C
TERADATA CORPORATION
CONDENSED CONSOLIDATED STATEMENTS OF CASH FLOWS
(in millions - unaudited)
For the Period Ended September 30
Three MonthsNine Months
2026202520262025
Operating activities
Net income 38$ 40$ 419$ 93$
Adjustments to reconcile net income to net cash provided
by operating activities:
Depreciation and amortization
25 24 73 67
Stock-based compensation expense33
29
95 82
Deferred income taxes1
20
41 24
Loss on Blue Chip Swap- 1 1 1
Changes in assets and liabilities:
Receivables54
(16) 49
(75)
Inventories
(8) - - 13
Current payables and accrued expenses
39 (12) (8) (66)
Deferred revenue(95)
6 (67) 17
Other assets and liabilities4
2 (5)
(11)
Net cash provided by operating activities
91
94
598
145
Investing activities
Expenditures for property and equipment(5) (5) (16) (10)
Additions to capitalized software(1) (1) (2) (1)
Business acquisitions and other investing activities, including loss on Blue Chip Swap- - (1) (1)
Net cash used in investing activities(6)
(6) (19) (12)
Financing activities
Repurchases of common stock(57)
(30) (131) (102)
Repayments of long-term borrowings-
(7)
(456) (19)
Payments of finance leases(13) (18) (45) (51)
Other financing activities, net4
5 (3) 3
Net cash used in financing activities
(66)
(50) (635) (169)
Effect of exchange rate changes on cash and cash equivalents(1) (1) (5) 22
Increase (decrease) in cash, cash equivalents and restricted cash18
37 (61) (14)
Cash, cash equivalents and restricted cash at beginning of period415 370 494
421
Cash, cash equivalents and restricted cash at end of period433$ 407$ 433$ 407$
Supplemental cash flow disclosure:
Non-cash investing and financing activities:
Assets acquired by finance leases11$ 15$ 39$ 67$
Assets acquired by operating leases-$ -$
3$ 2$
Schedule D
TERADATA CORPORATION
CONDENSED CONSOLIDATED STATEMENTS OF OPERATIONS
(in millions - unaudited)
For the Three Months Ended September 30For the Nine Months Ended September 30
20262025
% Change
As Reported
% Change
Constant
Currency
(2)
20262025
% Change
As Reported
% Change
Constant
Currency
(2)
Segment Revenue
Product Sales362$
369$
(2%)
(2%)1,134$ 1,094$ 4%2%
Consulting Services
37 47 (21%)(19%)
119 148 (20%)(19%)
Total segment revenue399
416 (4%)
(4%)1,253 1,242 1%0%
Segment gross profit
Product Sales
240 255 769 747
% of Revenue66.3%69.1%67.8%68.3%
Consulting Services
2
4
4 2
% of Revenue5.4%8.5%3.4%1.4%
Total segment gross profit242 259 773
749
% of Revenue60.7%62.3%61.7%60.3%
Reconciling items
(1)
(4)
(6)
(16) (18)
Total gross profit238$ 253$
757$ 731$
% of Revenue59.6%60.8%60.4%58.9%
(1)
Reconciling items include stock-based compensation, amortization of acquisition-related
intangible assets and acquisition, integration and reorganization-related items.
(2)
The impact of currency is determined by calculating the prior period results using the current-year
monthly average currency rates.
 View original content:

 View original content:
 View original content:
 View original content:
 View original content:
 View original content:

 View original content to download multimedia:
 View original content:
 View original content:
 View original content:
 View original content:
 View original content:
 View original content:
 View original content: