September 17, 2026 Welcome to Building Brands People Love, a series rooted in bringing our mission to life and delving into our unwavering commitment to creating iconic, consumer-driven brands. From embracing innovation to fostering relationships…
September 17, 2026

Welcome to Building Brands People Love, a series rooted in bringing our mission to life and delving into our unwavering commitment to creating iconic, consumer-driven brands. From embracing innovation to fostering relationships with consumers, this series highlights how we craft brands that resonate across generations. Discover how we leverage insights, bold ideas, and a passion for authenticity to build a portfolio that continues to inspire consumer trust and loyalty. Ruffino
is a longstanding and timeless brand known for:
-
Nearly 150 years of bringing Tuscany to consumers around the world through wines rooted in Italian heritage and craftsmanship.
-
Seven estates across Tuscany's most renowned wine regions, showcasing the diversity of Chianti Classico, Montalcino, and Bolgheri.
-
An iconic portfolio anchored by its flagship Chianti Classicos, including Riserva Ducale and Riserva Ducale Oro, alongside acclaimed Icon Wines like Greppone Mazzi, Modus Primo, and Garzaia.
-
An ongoing pursuit of innovation, from helping establish Prosecco globally to expanding into new occasions with Alcohol Removed Sparkling Wine.
Ruffino Showcases Italy to the World Approaching its 150th anniversary, Ruffino shines as one of Italy's most recognizable wine brands due to its winemaking heritage and passion for excellence while evolving alongside consumers.
Founded in Tuscany in 1877 by cousins Ilario and Leopoldo Ruffino, the winery was built from a bold vision to craft the “ideal wine,” with a focus on timeless quality and an authentic profile that would earn recognition far beyond Italy's borders.
By pairing exceptional craftsmanship with access to key railway lines, Ruffino helped put Chianti on the world stage, becoming one of the first wineries to export the wine to North America and cementing its status as an Italian icon.
Over the decades, Ruffino expanded its reach, with its wines being enjoyed globally, reflecting the winery's commitment to introducing new generations to the rich legacy of Italian winemaking.
![Ruffino wine shared among guests during an outdoor vineyard dining experience.]](https://cdn.shopify.com/s/files/1/0614/2797/4201/files/23-32330.jpg?v=1789662525)
Ruffino’s individuality extends beyond the wines themselves. The brand brings Italian culture and lifestyle to consumers through collaborations and events that celebrate conviviality, connection, and culture, further reflecting the distinctive character that sets the brand apart.
“Ruffino resonates because we don't just sell wine; we invite consumers into an authentic Italian experience – whether through our wines, our hospitality, cultural collaborations, or immersive events,” said Annarita Cicciarelli, Marketing Director of Ruffino.
Tuscany’s Distinct Character in Every Bottle
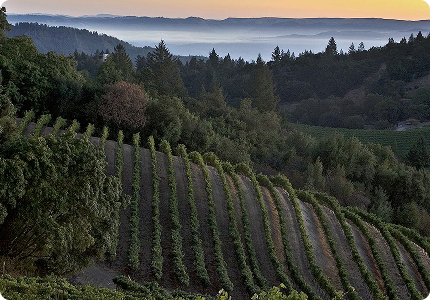
Ruffino’s vineyard-to-bottle approach begins with a rich understanding and appreciation of each estate's terroir. From careful vineyard management to precise grape selection and attentive winemaking, every step is meant to highlight the character of the fruit and the uniqueness of its respective region.
“Quality begins in the vineyard and continues through every stage of production,” said Olga Fusari, Senior Winemaker, Ruffino. “While Ruffino's portfolio encompasses different appellations, grape varieties, and wine styles, our philosophy remains the same: every wine must authentically express its origin while meeting the high standards associated with the Ruffino name.”
Today, Ruffino's seven estates span some of Tuscany's most renowned wine regions, including Chianti Classico, Montalcino, and Bolgheri. Together, they showcase the remarkable depth of the region while reinforcing the winery's commitment to excellence.
That breadth is supported by nearly 150 years of viticultural knowledge and a continued investment in vineyard acreage, cellar capacity, and facility enhancement. Today, Ruffino’s estates encompass around 600 hectares of vineyards, helping the brand preserve distinct regional expressions while supporting its long-term growth.
“Each Ruffino estate is much more than a vineyard; it is a unique expression of terroir, shaped by its own soils, climate, elevation, and viticultural identity,” says Fusari. “Together, our seven estates across Tuscany allow us to showcase the extraordinary diversity and richness of the region.”
From both a brand and winemaking perspective, Fusari says Ruffino's geographic diversity is one of its greatest strengths and reinforces Ruffino's position as one of Italy's leading ambassadors.
“Rather than telling a single story, we can share multiple expressions of Tuscany while maintaining a consistent commitment to quality, sustainability, and excellence,” said Fusari.
 Investing in the Future of Tuscany
Preserving the land that defines Tuscany's winemaking heritage is central to Ruffino's long-term vision.
“Ruffino views sustainability as a strategic business principle that ensures the winery can continue producing high-quality wines while protecting the resources on which its future depends,” says Riccardo Cugini, Senior Brand Manager for Ruffino.
Sustainability is embedded throughout Ruffino's operations, from vineyard management and water stewardship to packaging and much more.
Key initiatives include:
-
Precision viticulture and biodiversity conservation.
-
Waste reduction, recycling, and sustainable packaging practices.
-
Water stewardship: Three state-of-the-art water treatment plants enable wastewater to be safely returned to local waterways or repurposed for irrigation, while six rainwater collection basins help conserve resources across Ruffino's estates. These efforts are further supported by participation in the VIVA program, the Italian Ministry of the Environment and Energy Security's national standard for sustainable viticulture.
-
Industry-leading recognition: In 2026, the Ruffino team earned first place among 3,800 Italian agricultural businesses in AGRIcoltura100
, one of Italy's most comprehensive sustainability benchmarking initiatives. The recognition underscores Ruffino's commitment to environmental stewardship, innovation, social responsibility, and quality across its operations and supply chain.
 A Portfolio Built on Heritage and a Relentless Pursuit of Excellence
At the heart of Ruffino’s portfolio are flagship wines such as Riserva Ducale
and Riserva Ducale Oro
, labels that are synonymous with quality, consistency, and the enduring appeal of Chianti. For generations, these wines continue to introduce consumers around the world to the character and craftsmanship of Tuscany.
Beyond Chianti, Ruffino's collection of Icon Wines, such as Greppone Mazzi Brunello di Montalcino
, Modus Primo
, and Garzaia Bolgheri Superiore
, highlights some of Italy's most celebrated styles.
“Our portfolio reflects the extraordinary diversity of Italy itself. From our flagship wines to our Icon Super Tuscans, every wine has its own identity, rooted in its territory and appellation,” says Cicciarelli.
Ruffino continues to translate brand equity into marketplace success, with its wines achieving strong performance including:
![Ruffino wine bottles stored in a cellar rack.]](https://cdn.shopify.com/s/files/1/0614/2797/4201/files/Image13-p15.png?v=1789662854)
Together, these wines offer consumers a journey through Italy's rich winemaking heritage, balancing timeless classics with acclaimed regional expressions that continue to define Ruffino's legacy. That same commitment to honoring tradition while evolving with consumer tastes has been a hallmark of the brand for nearly 150 years. From the launch of Ruffino Chianti in 1877 to the introduction of Riserva Ducale in 1927 and Riserva Ducale Oro in 1947, Ruffino has consistently helped shape the evolution of premium Italian wine.
“Throughout our history, we have embraced innovation without compromising the integrity of our wines or the values on which the company was founded,” says Cicciarelli. “Today, we express this through what we call ‘Mastery with Iconic Italian Design.’”
That same mindset continues today as Ruffino adapts to evolving consumer preferences and additional drinking occasions. Ruffino played an early role in the growth of Prosecco and helped establish the sparkling category in North America and markets around the world. Today, Ruffino’s lineup of sparkling wines, led by Ruffino Prosecco
, remains an important part of the portfolio, helping Ruffino expand into new categories as it reaches new consumers.
And as consumer preferences continue to evolve, Ruffino has expanded its portfolio with innovations such as Ruffino Alcohol Removed Sparkling Wine. Cugini notes that these offerings enable the brand to show up in new drinking occasions while staying true to the craftsmanship and heritage that have long defined Ruffino.
Alongside Prosecco
, Prosecco Rosé
, and Moscato
, the new offerings allow Ruffino to engage with younger consumers who increasingly seek wines with a more approachable taste profile.
Regardless of the bottle of wine, Ruffino’s foundation remains unchanged: authentic Italian heritage, uncompromising quality, and a commitment to delivering meaningful experiences.

Establishing the Ultimate Italian Fine Wine House
As Ruffino approaches its 150th anniversary, the winery continues to connect consumers to the people, places, and traditions that makes Italian wine beloved around the world. From the diversity of its Tuscan estates to the extensive premium offerings and enduring spirit of innovation, Ruffino remains guided by its original ambition to create the “ideal wine.”
With a respect for tradition and a vision for the future, Ruffino is cultivating the future of Italian winemaking for generations to come.
“Our role is evolving from being simply a producer of great wines to becoming a curator of Italian wine culture and lifestyle,” says Cicciarelli. “Consumers increasingly seek brands with purpose, heritage, and meaningful experiences – and Ruffino is uniquely positioned to offer all three—through our wines, our estates, our hospitality, and the stories behind each label.”
Looking ahead, the brand’s ambition is clear: establish Ruffino as The Ultimate Italian Fine Wine House, celebrating the richness of Italy's wine regions while continuing to innovate in how consumers discover, experience, and engage with this iconic brand.
Source:
1Dollar Sales Trend, Circana L52W ending 09-06-2026
Share this:
Copy URL
Arrow
Back
Next
Arrow
Arrow
Back
Next
Arrow



CONSTELLATION BRANDS REMINDS YOU TO PLEASE DRINK RESPONSIBLY.
Copyright © 2026 Constellation Brands, Inc. | All Rights Reserved
ACCESSIBILITY
Accessibility Toggle
CONSTELLATION BRANDS REMINDS YOU TO PLEASE DRINK RESPONSIBLY.
Copyright © 2026 Constellation Brands, Inc. | All Rights Reserved
Constellation Brands (NYSE: STZ), a U.S.-based company, is a leading international producer and marketer of beer, wine, and spirits with operations in the U.S., Mexico, New Zealand, and Italy. Every day, people reach for our high-end, iconic imported beer brands such as those in the Corona brand family like the flagship Corona Extra, Modelo Especial and the flavorful lineup of Modelo Cheladas, Pacifico, and Victoria; our fine wine and craft spirits brands, including The Prisoner Wine Company, Robert Mondavi Winery, Casa Noble Tequila, and High West Whiskey; and our premium wine brands such as Kim Crawford. Constellation Brands, Inc. owns the brand license for Corona and Modelo in the U.S. to import, market, and sell, exclusively and perpetually.
- Choosing a selection results in a full page refresh.