Stoneridge, Inc. is a global supplier of electronics systems and technologies for the on- and off-highway transportation sectors. Founded in 1965, the company operates in two reportable segments: Electronics and Stoneridge Brazil. The Electronics segment designs and manufactures advanced driver information solutions, vision systems, connectivity and compliance solutions, and control modules, including the MirrorEye camera monitor system. The Stoneridge Brazil segment provides vehicle tracking devices, monitoring services, driver information systems, telematics solutions, and multimedia devices primarily for the South American market. The company supplies commercial vehicle, automotive, and off-highway original equipment manufacturers and Tier 1 suppliers in North America, Europe, and South America. Stoneridge acquired Orlaco Products BV in 2017 to develop its vision systems and acquired full ownership of PST Eletrônica S.A. in 2017. In January 2026, the company sold its Control Devices segment, which previously manufactured actuators, sensors, switches, and connectors.

Summarised from the company's own disclosures, fiscal year ended Mar 2026

Industry Auto Parts Homepage stoneridge.com
Sector Consumer Cyclical IR page stoneridge.com/investors
Tags
vehicle electronics, driver assistance systems, vision systems, telematics, vehicle tracking, commercial vehicles, off-highway vehicles, automotive aftermarket, safety systems, connectivity solutions, MirrorEye, Orlaco, PST Eletrônica, Stoneridge Brazil, Stoneridge Electronics, Stoneridge Pollak, Hi-Stat, Berifors, Motometer, Bolton Conductive Systems, TVI Europe, Joseph Pollak Corporation, Kelsey-Hayes, Minda Group
Press page stoneridge.com/press-releases

Metrics

Valuation  
Market cap $ 189.778M
Market cap (USD) $ 189.778M
P/E -1.80
PEG —
P/BV 1.53
P/S 0.27
P/OCF 13.68
P/FCF -86.42
Dividend yield —
Turnover / mcap —
Returns  
ROE -48.4%
ROI -28.5%
ROIC -8.0%
Profit margin -11.9%
Growth  
Revenue growing No
Profits growing No
Revenue up 3y No
Revenue up 5y No
Earnings growth 3y (net profit CAGR) —
Quality  
Profitable No
Margin expanding No
Buying back stock No
Diluting (TTM) Yes
Debt/Equity 100.6%
Podcast bulls (TTM) Sign up
Podcast bears (TTM) Sign up
Podcast sentiment (TTM) Sign up
Podcast sentiment % (TTM) Sign up
News sentiment (TTM) 20
Quality score -70.6%
Insiders  
Buys, 1w Sign up
Buys, 1m Sign up
Buys, 1y Sign up
Sells, 1w Sign up
Sells, 1m Sign up
Sells, 1y Sign up

Sign up to see this company's insider trades

Figure FY 2025 FY 2024 FY 2023 FY 2022 FY 2021 FY 2020 FY 2019 FY 2018 FY 2017 FY 2016 FY 2015 FY 2014 FY 2013 FY 2012 FY 2011 FY 2010 FY 2009 FY 2008 FY 2007 FY 2006 FY 2005 FY 2004 FY 2003 FY 2002 FY 2001 FY 2000
Revenue 861.263M 908.295M 975.818M 899.923M 770.462M 648.006M 834.289M 866.199M 824.444M 695.977M 644.812M 660.579M 947.83M 938.513M 765.373M 635.226M 475.152M 752.698M 727.12M 708.699M 671.584M 681.795M 606.665M 636.507M 584.468M 667.192M
Net profit -102.835M -16.524M -5.183M -14.056M 3.406M -7.95M 60.291M 53.848M 45.179M 77.461M 22.774M -47.108M 15.131M 5.361M 49.357M 11.53M -32.405M -97.527M 16.671M 14.513M 933K -92.503M 21.379M -48.778M 2.946M 32.709M
Free cash flow 12.172M 23.445M -33.552M -20.426M -59.197M 981K -11.319M 51.745M 46.738M 40.801M 26.07M -4.939M 18.34M 49.193M -25.369M -4.723M 1.826M 17.883M 15.384M 20.645M -9.873M 24.359M 45.972M 80.969M 38.683M 23.682M

Figure FY 2025 FY 2024 FY 2023 FY 2022 FY 2021 FY 2020 FY 2019 FY 2018 FY 2017 FY 2016 FY 2015 FY 2014 FY 2013 FY 2012 FY 2011 FY 2010 FY 2009 FY 2008 FY 2007 FY 2006 FY 2005 FY 2004 FY 2003 FY 2002 FY 2001 FY 2000
Share price 5.79 6.27 19.57 21.56 19.74 30.23 29.32 24.65 22.86 17.69 14.8 12.86 12.75 5.12 8.42 15.79 9.01 3.64 12.53 7.05 — — — — — —
Price performance 12m -0.08 -0.68 -0.09 0.09 -0.35 0.03 0.19 0.08 0.29 0.2 0.15 0.01 1.49 -0.39 -0.47 0.75 1.48 -0.71 0.78 — — — — — — —

Filed figures

Figure Dec 2016 Dec 2017 Dec 2018 Dec 2019 Dec 2020 Dec 2021 Dec 2022 Dec 2023 Dec 2024 Dec 2025
Balance sheet detail
Trade receivables (USD) 113M 142M 139M 139M 137M 150M 158M 167M 138M 131M
↳ YoY growth +19.3% +25.8% -2.4% -0.4% -1.3% +10.0% +5.2% +5.3% -17.3% -4.6%
↳ 5y CAGR -7.0% +0.1% +0.8% +5.7% +7.6% +5.8% +2.1% +3.7% -0.1% -0.8%
Borrowings, current (USD) 8.63M 4.19M 1.53M 2.67M 7.67M 5.25M 1.45M 2.11M 0.00 —
Borrowings, non-current (USD) 8.06M 3.85M 983,000 454,000 — 0.00 0.00 0.00 0.00 —
Lease liabilities (USD) — — — 22.5M 19.7M 19.1M 14.5M 11.6M 10.5M 13.1M
Cash and deposits (USD) 50.4M 66M 81.1M 69.4M 73.9M 85.5M 54.8M 40.8M 71.8M 66.3M
Intangible assets (USD) 39.3M 75.2M 62M 58.1M 55.4M 49.9M 45.5M 47.3M 39.7M 38M
Right-of-use assets (USD) — — — 22M 18.9M 18.3M 13.8M 10.8M 10.1M 12.5M
Net debt (borrowings + leases - cash) (USD) -33.7M -58M -78.6M -43.8M -46.5M -61.2M -38.8M -27.2M -61.4M —
Cash flow detail
Operating cash flow (USD) 65.3M 78.9M 80.8M 24.5M 28.6M -36.2M 6.81M 4.95M 47.7M 34M
Purchases of property, plant and equipment (USD) -24.5M -32.2M -29M -35.8M -27.7M -22.9M -27.2M -38.5M -24.3M -21.9M
Change in receivables (cash effect) (USD) -18.7M -15.2M -3.58M -1.35M 4.16M -17M -13.2M -5.85M 20.2M 17.3M
Change in inventories (cash effect) (USD) 4.52M -2.13M -10M -15.7M 4M -51.3M -20.1M -31.6M 26.9M 30.8M
Share buybacks (cash effect) (USD) — — — -50M -5M 0.00 0.00 — — —
Interest paid (cash effect) (USD) -5.79M -5.75M -5M -4.4M -5.62M -6.06M -7.29M -13M -15.5M -14.2M
Income taxes paid (cash effect) (USD) -3.39M -7.09M -13.2M -12.2M 254,000 -11.3M -6.18M -10.3M -9.26M -10.3M
Share-based compensation (USD) 6.13M 7.27M 5.63M 6.19M 5.89M 5.96M 5.94M 3.32M 4.09M 4.8M
Operating cash flow before change in receivables (USD) 84M 94.1M 84.3M 25.9M 24.5M -19.2M 20M 10.8M 27.6M 16.7M
Free cash flow (OCF - PPE - intangibles) (USD) 40.8M 46.7M 51.7M -11.3M 981,000 -59.2M -20.4M -33.6M 23.4M 12.2M
Income detail
Research and development expense (USD) 40.2M 48.9M 51.1M 52.2M 49.4M 66.2M 65.3M 71.1M 72.2M 62.5M
↳ 5y CAGR +2.7% +1.8% +2.4% +4.6% +4.9% +10.5% +6.0% +6.8% +6.7% +4.8%
Total comprehensive income (USD) 79.4M 60.5M 37.7M 54.6M -6.11M -3.98M -20.2M 5.17M -45.7M -69.9M
Comprehensive income to owners (USD) 79.4M 60.5M 37.7M 54.6M -6.11M -3.98M -20.2M 5.17M -45.7M -69.9M
Reported Mar 2, 2017 Mar 7, 2018 Feb 28, 2019 Feb 27, 2020 Feb 24, 2021 Mar 2, 2023 Mar 2, 2023 Mar 1, 2024 Mar 3, 2025 Mar 16, 2026

Sign up to see institutional holdings

Sign Up

Podcast Mentions

Sign up to see podcast mentions and sentiment

Sign Up

Presentation Bull 3 Bear 4 Results

Exhibit 99.2

Q3 2026 Results November 5, 2026

stoneridge.com

stoneridge.com © 2026

Q3 2026 Results

Non-GAAP Financial Measures This presentation contains information about the Company’s financial results that is not presented in accordance with accounting principles generally accepted in the United States (“GAAP”). Such non-GAAP financial measures are reconciled to their closest GAAP financial measures at the end of this presentation. The provision of these non-GAAP financial measures for 2026 and 2025 is not intended to indicate that Stoneridge is explicitly or implicitly providing projections on those non-GAAP financial measures, and actual results for such measures are likely to vary from those presented. The reconciliations include all information reasonably available to the Company at the date of this presentation and the adjustments that management can reasonably predict. Management believes the non-GAAP financial measures used in this presentation are useful to both management and investors in their analysis of the Company’s financial position and results of operations. In particular, management believes that adjusted revenue, core revenue, adjusted gross profit and margin, adjusted SG&A, adjusted operating income (loss) and margin, adjusted income (loss) before tax, adjusted tax expense (benefit), adjusted net income (loss) from continuing operations, adjusted net income (loss), adjusted loss per share (“adjusted EPS”), earnings before interest, taxes, depreciation and amortization (“EBITDA”), adjusted EBITDA and margin, and net debt are useful measures in assessing the Company’s financial performance by excluding certain items that are not indicative of the Company’s core operating performance or that may obscure trends useful in evaluating the Company’s continuing operating activities. Management also believes that these measures are useful to both management and investors in their analysis of the Company’s results of operations and provide improved comparability between fiscal periods. Adjusted revenue, adjusted gross profit and margin, adjusted operating income (loss) and margin, adjusted income (loss) before tax, adjusted tax expense (benefit), adjusted net income (loss) from continuing operations, adjusted net income (loss), adjusted loss per share (“adjusted EPS”), earnings before interest, taxes, depreciation and amortization (“EBITDA”), adjusted EBITDA and margin, and net debt should not be considered in isolation or as a substitute for revenue, gross profit, operating income (loss), income (loss) before tax, tax expense (benefit), net income (loss), debt, cash and cash equivalents, cash provided by operating activities or other income statement or cash flow statement data prepared in accordance with GAAP. stoneridge.com

stoneridge.com © 2026

Q3 2025

Q3 2025

Q3 2026

Q3 2026

Recast

Adjusted /

Reported

Adjusted /

GAAP*

Non-GAAP

$138.6 million

$155.8 million

$180.0 million

Gross Profit Margin

$32.1 million 23.1%

$32.8 million 23.7%

$11.5 million 7.4%

$35.7 million 19.9%

Operating Income Margin

$(1.4) million (1.0)%

$0.3 million 0.2%

$(23.8) million (15.3)%

$0.8 million 0.4%

Income (Loss) from Continuing Operations

$(8.9) million (6.4)%

$(7.6) million (5.5)%

$(22.9) million (14.7)%

$1.6 million 0.9%

Net Income (Loss) % of sales

$(9.4) million (6.8)%

$(8.1) million (5.8)%

$(22.9) million (14.7)%

$1.6 million 0.9%

EBITDA Margin

$5.2 million 3.7%

$7.3 million 4.1%

Sales

Non-GAAP

Note(*) - As a result of the sale of its Control Devices business segment on January 30, 2026, the Company has applied the provisions of Discontinued Operations accounting guidance and has retrospectively presented the financial results of the Control Devices segment as discontinued operations in the accompanying presentation for all periods presented.

2

Q3 2026 Results

Forward-Looking Statements Statements in this presentation contain “forward-looking statements” under the Private Securities Litigation Reform Act of 1995. These statements appear in a number of places in this presentation and may include statements regarding the intent, belief or current expectations of the Company, with respect to, among other things, our (i) future product and facility expansion, (ii) strategic focus following the sale of the Control Devices segment, (iii) acquisition strategy, (iv) investments and new product development, (v) growth opportunities related to awarded business, and (vi) operational expectations. Forward-looking statements may be identified by the words “will,” “may,” “should,” “could,” “would,” “designed to,” “believes,” “plans,” “projects,” “intends,” “expects,” “estimates,” “anticipates,” “continue,” and similar words and expressions. The forward-looking statements are subject to risks and uncertainties that could cause actual events or results to differ materially from those expressed in or implied by these statements. Important factors that could cause actual results to differ materially from those in the forward-looking statements include, among other factors, the ability of our suppliers to supply us with parts and components at competitive prices on a timely basis, including the impact of potential tariffs and trade considerations on their operations and output; fluctuations in the cost and availability of key materials and components (including semiconductors, printed circuit boards, resin, aluminum, steel and copper) and our ability to offset cost increases through negotiated price increases with or reimbursements from our customers or other cost reduction actions, as necessary; global economic trends, competition and geopolitical risks, including impacts from ongoing or potential global conflicts and any related sanctions and other measures, or an escalation of sanctions, tariffs or other trade tensions between the U.S. and other countries; tariffs specifically in countries where we have significant direct or indirect manufacturing or supply chain exposure and our ability to either mitigate the impact of tariffs or pass any incremental costs to our customers; our ability to achieve cost reductions that offset or exceed customer-mandated selling price reductions; the reduced purchases, loss, financial distress or bankruptcy of a major customer or supplier; the costs and timing of business realignment, facility closures or similar actions; a significant change in commercial, automotive, off-highway or agricultural vehicle production; competitive market conditions and resulting effects on sales and pricing; foreign currency fluctuations and our ability to manage those impacts; customer acceptance of new products; our ability to successfully launch/produce products for awarded business; adverse changes in laws, government regulations or market conditions, affecting our products, our suppliers, or our customers’ products; our ability to protect intellectual property and successfully defend against assertions made against us; liabilities arising from warranty claims, product recall or field actions, product liability and legal proceedings to which we are or may become a party, or the impact of product recall or field actions on our customers; labor disruptions at our facilities or at any significant customers or suppliers; business disruptions due to natural disasters or other disasters outside of our control; the amount of our indebtedness and the restrictive covenants contained in the agreements governing its indebtedness, including our revolving credit facility; capital availability or costs, including changes in interest rates; refinancing risk and access to capital markets and liquidity; the failure to achieve successful integration of any acquired company or business; risks related to a failure of our information technology systems and networks, and risks associated with current and emerging technology threats and damage from computer viruses, unauthorized access, cyberattack and other similar disruptions, the occurrence or non-occurrence of circumstances beyond Stoneridge’s control; our ability to comply with the financial covenants in, and to refinance or replace, our Credit Facility before its July 1, 2027 maturity; and the items described in Part I, Item 1A (“Risk Factors”) and other uncertainties or risks disclosed in Stoneridge’s periodic and current reports, including the Form 10-Ks and Form 10-Qs, filed with the Securities and Exchange Commission. The forward-looking statements contained herein represent our estimates only as of the date of this presentation and should not be relied upon as representing our estimates as of any subsequent date. While we may elect to update these forward-looking statements at some point in the future, except as required by law, we specifically disclaim any obligation to do so, whether to reflect actual results, changes in assumptions, changes in other factors affecting such forward-looking statements or otherwise. Rounding Disclosure: There may be slight immaterial differences between figures in our public filings and this presentation, due to the presentation of values in millions rather than thousands.

stoneridge.com

stoneridge.com © 2026

3

Q3 2026 Results

Q3 2026

Achievements Continued sales growth and commercial momentum in 3Q

• • • •

On an adjusted basis, outperformed weighted-average OEM end markets by ~8% Record quarterly revenue for Stoneridge Brazil of $21.5 million Record quarterly MirrorEye revenue of >$37 million (+48% YoY) Secured significant increase in orders for existing vision system in the OEM market

▪ Cumulative incremental sales of ~$180 million expected through 2028

Q3 2026 Results

Adjusted Revenue

Adjusted Gross Margin

$180M

19.9%

29.9% growth vs. Q3 2025

382 bps decrease vs. Q3 2025

Adjusted EBITDA

Cash from Operations

$7.3M

$4M

40%+ improvement vs. Q3 2025

$3.6M YoY Improvement

Disciplined execution amid volatile macro & geopolitical backdrop

• SG&A (% of adjusted revenue) improved 317 basis points vs. Q3 2025 • On track to deliver at least $5M in operating cost reductions in 2026 • Generated $4M in cash from operations despite working capital investment Raising 2026 adjusted revenue guidance; Adjusted EBITDA now expected at bottom end of range

• Inflationary cost pressure, unfavorable currency impact and actions to resolve legacy matters in Q2/Q3 offset stronger topline performance stoneridge.com

stoneridge.com © 2026

Note: Q3 2025 results were recast in accordance with Discontinued Operations guidance as a result of the sale of Control Devices *Based Market Data Q4 2026 MHCV IHS (Class 7&8) and 2025 SRI end market weightings excluding Control Devices segment

Includes $0.5m of non-operating FX expense

4

Q3 2026

COMMERCIAL VEHICLE FORECAST* (Thousands of Units)

Results

EUROPE 45.5% OF 2025 SALES**

Commercial Vehicle Market Update Production Forecast Update • Our weighted-average OEM end markets are forecasted to grow by 5.0% in 2026 and 2.9% in 2027 based on current IHS forecasts • This compares to the prior forecast indicating growth of 3.8% in 2026 and 5.3% in 2027 • Initial 2026 guidance assumed flat global industry volume – revised adjusted revenue guidance now assumes a low- to mid-single digit percentage improvement as well as favorable SRI-specific factors (outperformance in Brazil and Electronics commercial momentum)

468

6.8%

(4.5)% 447

2024

455

3.4%

462

2025

2026

Prior Forecast

Current Forecast

496

494

2027

NORTH AMERICA 22.7% OF 2025 SALES** 376

(22.9)%

12.2%

(4.2)%

327

325

322

312

290

2024

2025

2026

2027

Prior Forecast

Current Forecast

SOUTH AMERICA 10.3% OF 2025 SALES** 129

(14.3)% 111

(4.2)% 106

0.9% 107

107

103

2024

stoneridge.com

stoneridge.com © 2026

2025

2026

Prior Forecast

Current Forecast

SOURCE: Current Forecast Q4 2026 MHCV IHS, Previous Forecast Q3 2026 MHCV IHS *Includes Class 7-8 **Weightings exclude Control Devices segment revenue in 2025

2027

5

Q3 2026 Results

New Growth Drivers Significant additional orders in the OEM market • Volume increase with ramp-up beginning in 2027 for existing vision systems to the OEM market • $180M total incremental revenue expected through 2028

Extending MirrorEye into Autonomous Trucks • MirrorEye in use on Kodiak AI’s newly deployed autonomous trucks • Exploring ways to integrate more Stoneridge technology and develop solutions that improve how vehicle data is processed • Stoneridge’s FMCSA exemption lets Kodiak AI design future platforms without conventional mirrors stoneridge.com

stoneridge.com © 2026

6

Financial Update

stoneridge.com

stoneridge.com © 2026

Q3 2026 Results

Financial Summary

Solid Q3 progress marked by revenue growth and overhead cost improvements Adjusted Sales

Adjusted Gross Margin

Adjusted Operating Margin

+29.9%

-382 bps

+20 bps

$180.0

$35.7

$32.8

$0.3

23.7% Q3 2025

•

Q3 2026

Q3 2025

+34 bps*

$7.3

$0.8

19.9%

$138.6

Adjusted EBITDA Margin

$5.2

0.4%

4.2% 4.1%

3.7% 3.7%

0.2% Q3 2025

Q3 2026

Higher sales in the North American and European commercial vehicle markets

•

Favorable volume impact

•

Incremental warranty cost

•

Higher Brazilian OEM sales

•

Higher materials expense

•

Mexico manufacturing agreement contributed $6.3 million

•

Unfavorable sales mix at Stoneridge Brazil

Q3 2026

•

Continued progress on overhead cost control efforts

•

SG&A cost improvement of 317 bps

•

D&D cost improvement of 84 bps

Q3 2025

•

Q3 2026

Adjusted EBITDA margin improved by 34 bps

stoneridge.com

stoneridge.com © 2026

8

Q3 2026 Results

Electronics Performance Robust Q3 revenue growth offset by costs related to legacy warranty and inventory matters

$’s in USD Millions

Q3 2025 vs Q3 2026

$158.6

Sales

$121.5

Q3 2026 Financial Results •

•

stoneridge.com © 2026

Q3 2025

Q3 sales growth of 30.5% vs. Q3 2025 •

Higher sales in NA and Europe commercial vehicles markets

•

Organic sales growth of 26.4%

•

Unfavorable FX translation impact of ~$1.4 million

Adjusted operating income decreased by 217 basis points vs. Q3 2025 •

stoneridge.com

  • 30.5% Q3 2026

$6.7

Adjusted Operating Income

5.6%

$5.4 3.4%

  • 217 bps

Q3 2025

Q3 2026

Fixed cost leverage on sales growth and realized cost savings more than offset by combination of incremental warranty costs, strategic inventory-related actions and higher material expenses

9

Q3 2026 Results

Stoneridge Brazil Performance Sales momentum continued in Q3; primarily offset by adverse mix Local OEM business grew 56% vs. Q3 2025

$’s in USD Millions

Q3 2025 vs Q3 2026

$21.5

Sales

$17.1

Q3 2026 Financial Results •

•

  • 25.3%

Q3 sales growth of $4.3 million, or 25.3% vs. Q3 2025 •

Organic sales growth of 19.3%

•

Favorable FX translation impact of ~$1 million

Adjusted operating income declined by 411 basis points vs. Q3 2025 •

Improved cost leverage on higher revenue more than offset by unfavorable sales mix and overhead investments

Adjusted Operating Income

Q3 2025

Q3 2026

$2.7

$2.5

15.7%

11.5%

  • 411 bps

Q3 2025

stoneridge.com

stoneridge.com © 2026

Q3 2026

10

Q3 2026 Results

Capital Structure Update

Inventory Turns 4.7 3.6

Cash from operations improved versus Q3 2025; debt reduced by $7 million sequentially

28.5% Increase Q3 2025

Q3 2026

Q3 2026 Performance •

Q3 net debt of $80.2 million •

•

Successfully balancing working capital efficiency and growth investment •

Generated cash from operations of $4 million

•

Inventory turns improved to 4.7x (vs. 3.6x in Q325) despite strategic working capital investment

Capital Structure •

stoneridge.com

stoneridge.com © 2026

$’s in USD Millions

Total Cash

$49.3

Net Debt

$63.4 $41.6M Improvement

$121.8 $80.2

Anticipated working capital investment to continue throughout 2026 •

•

Net Debt

$41.6 million improvement vs. Q3 2025

Remain in compliance with all current debt covenant ratios

Q3 2025

Q3 2026

Debt refinancing process progressing

11

Q3 2026 Results

2026 Full-Year Guidance Revising full-year 2026 outlook Prior

Updated

•

Increasing full year adjusted revenue outlook • Market outpacing original expectations for 2026

Adj. Revenue

$645M - $670M

$690M - $700M

• Continued success in Brazil OEM business • Ongoing product momentum in Electronics

Adj. Gross Margin Adj. Operating Margin Adj. EBITDA | Margin

21.5% - 22.0%

20.5% - 21.0%

0.0% - 0.5%

(0.5)% - 0.0%

•

Adj. EBITDA now expected at bottom end of range due to actions taken to resolve certain legacy matters in Q2/Q3, and anticipated inflationary pressure and unfavorable currency in Q4 • On track to deliver at least $5 million in structural cost savings • Actions taken to resolve legacy matters (warranty, inventory) were not embedded in initial guidance

$20M - $25M

$20M - $25M

3.1% - 3.7%

2.9% - 3.6%

• Focused on addressing material cost inflation for the remainder of the year

The Company has not provided a reconciliation of its full-year 2026 guidance for adjusted revenue, adjusted gross margin, adjusted operating margin, and adjusted EBITDA (or adjusted EBITDA margin) to the most directly comparable GAAP financial measures because the Company is unable to provide such reconciliations without unreasonable effort. This is due to the inherent difficulty of forecasting with the required precision the timing and amount of various items that have not yet occurred, are out of the Company's control, or cannot be reasonably predicted. For the same reasons, the Company is unable to address the probable significance of the unavailable reconciling information, which could be material to future results calculated in accordance with GAAP. The Company's actual results calculated in accordance with GAAP may vary materially from these non-GAAP financial measures presented herein. stoneridge.com

stoneridge.com © 2026

12

Q3 2026 Results

Q3 Summary Progressing on our key strategic priorities to drive long-term shareholder value Superior Customer Value Proposition Focused Advanced Technology • Significant additional orders for existing vision systems in the OEM market • Expansion of MirrorEye technology into autonomous trucks

Excellence in Execution • Relentless focus on end-to-end quality management • Overhead cost reduction • Improved operating cash flow and net debt reduction

Strong Performance Culture Driven by Passion • Talent aligned with core technology strategy • Reinforced creativity and accountability

Drive Long-Term Shareholder Value – Q3 Progress

Market Outperformance Margin Expansion

~8% Market Outperformance*

~34 bps Adj. EBITDA Margin Expansion vs. Q3 2025

~$42M Cash Generation

Net Debt Reduction vs. Q3 2025

$3.6M YoY Cash from Operations Improvement

stoneridge.com

stoneridge.com © 2026

*Based on Market Data Q4 2026 MHCV IHS (Class 7&8) and 2025 SRI end market weightings excluding Control Devices segment

13

Appendix Materials

stoneridge.com

stoneridge.com © 2026

Appendix

Balance Sheets

stoneridge.com

stoneridge.com © 2026

15

Appendix

Income Statement

stoneridge.com

stoneridge.com © 2026

16

Appendix

Segment Reporting

(A)

stoneridge.com

stoneridge.com © 2026

Unallocated Corporate expenses include, among other items, accounting/finance, human resources, information technology and legal costs as well as share-based compensation.

17

Appendix

Segment Reporting

stoneridge.com

stoneridge.com © 2026

(A)

Unallocated Corporate expenses include, among other items, accounting/finance, human resources, information technology and legal costs as well as share-based compensation.

(B)

These amounts represent depreciation and amortization on a property, plant and equipment and certain intangible assets.

(C)

Assets located at Corporate consist primarily of cash, intercompany loan receivables, fixed assets for the corporate headquarter building, leased assets, information technology assets, equity investments and investments in subsidiaries.

18

Reconciliations to US GAAP

stoneridge.com

stoneridge.com © 2026

US GAAP Reconciliations

US GAAP Reconciliations This document contains information about Stoneridge's financial results which is not presented in accordance with accounting principles generally accepted in the United States ("GAAP"). Such non-GAAP financial measures are reconciled to their closest GAAP financial measures in the appendix of this document. The provision of these non-GAAP financial measures is not intended to indicate that Stoneridge is explicitly or implicitly providing projections on those nonGAAP financial measures, and actual results for such measures are likely to vary from those presented. The reconciliations include all information reasonably available to the Company at the date of this document and the adjustments that management can reasonably predict.

stoneridge.com

stoneridge.com © 2026

20

US GAAP Reconciliations

US GAAP Reconciliations Reconciliation of Adjusted Net Sales (USD in millions)

Q3 2025

Q3 2026

Net Sales

$

138.6

Add: Pre-Tax PM Soot Arbitration Judgment

$

—

Adjusted Net Sales

$

138.6

$

155.8

24.2 $

180.0

Results for the third quarter of 2026 were adversely affected by a pre-tax charge of $24.2 million, recorded as a reduction to net sales, related to an adverse ruling received on November 2, 2026 in the previously disclosed arbitration proceeding brought by a former customer of our Control Devices business regarding legacy PM sensor product warranty claims. The Company exited the PM sensor product line in 2019 and divested its Control Devices business in the first quarter of 2026. The arbitration panel awarded the former customer €22.5 million (approximately $25.5 million), including interest and costs. Because the ruling provided additional evidence about conditions that existed at September 30, 2026, the charge was recognized in our third quarter results. The Company disagrees with the ruling and continues to believe the claims lack merit, and it is evaluating its options with respect to the award. However, there can be no assurance that the Company will be successful in appealing the decision and may ultimately be obligated to satisfy the award without modification. Provided that an appeal is not successful, the Company expects to pay the award from cash on hand, including cash held outside the United States, and intends to hold discussions with the former customer regarding the timing of payments.

stoneridge.com

stoneridge.com © 2026

21

US GAAP Reconciliations

US GAAP Reconciliations Reconciliation of Adjusted Gross Profit (USD in millions)

stoneridge.com

stoneridge.com © 2026

Q3 2025

Q3 2026

Gross Profit

$

32.1

$

11.5

Add: Pre-Tax Business Realignment Costs

$

0.7

Add: Pre-Tax PM Soot Arbitration Judgment

$

—

$

24.2

Adjusted Gross Profit

$

32.8

$

35.7

—

22

US GAAP Reconciliations

US GAAP Reconciliations Reconciliation of Adjusted Operating Loss (USD in millions) Operating Loss

Q3 2025 $

© 2026

$

(23.8)

1.8

—

Add: Pre-Tax Environmental Remediation Costs

—

0.3

Adjusted Operating Loss

stoneridge.com

(1.4)

Add: Pre-Tax Business Realignment Costs Add: Pre-Tax PM Soot Arbitration Judgment

stoneridge.com

Q3 2026

— $

0.3

24.2 $

0.8

23

US GAAP Reconciliations

US GAAP Reconciliations Reconciliation of Adjusted Loss from Continuing Operations (USD in millions) Loss From Continuing Operations

Q3 2025 $

© 2026

$

(22.9)

1.3

—

Add: After-Tax Environmental Remediation Costs

—

0.3

—

24.2

(7.6) $

1.6

Adjusted Loss From Continuing Operations

stoneridge.com

(8.9)

Add: After-Tax Business Realignment Costs Add: After-Tax PM Soot Arbitration Judgment

stoneridge.com

Q3 2026

$

24

US GAAP Reconciliations

US GAAP Reconciliations Reconciliation of Adjusted Net Loss (USD in millions) Net Loss

Q3 2025 $

© 2026

$

(22.9)

1.3

—

Add: After-Tax Environmental Remediation Costs

—

0.3

—

24.2

(8.1) $

1.6

Adjusted Net Loss

stoneridge.com

(9.4)

Add: After-Tax Business Realignment Costs Add: After-Tax PM Soot Arbitration Judgment

stoneridge.com

Q3 2026

$

25

US GAAP Reconciliations

US GAAP Reconciliations Reconciliation of Q3 2026 Adjusted Tax Rate (USD in millions)

Q3 2026

Loss Before Tax

$

(25.6)

Add: Pre-Tax Environmental Remediation Costs

$

0.3

Add: Pre-Tax PM Soot Arbitration Judgment

$

24.2

Adjusted Loss Before Tax

$

(1.0)

Income Tax Expense

(2.7)

Add: Tax Impact from Pre-Tax Adjustments Adjusted Income Tax Expense on Adjusted Loss Before Tax

stoneridge.com

stoneridge.com © 2026

Tax Rate

10.50 %

— $

(2.7)

256.18 %

26

US GAAP Reconciliations

US GAAP Reconciliations Reconciliation of Q3 2026 Adjusted Net Income and EPS (USD in millions, except EPS) Net Loss

Q3 2026 $

Add: After-Tax Environmental Remediation Costs

stoneridge.com

stoneridge.com © 2026

Q3 2026 EPS $

0.3

Add: After-Tax PM Soot Arbitration Judgment Adjusted Net Loss

(22.9)

0.01

24.2 $

1.6

(0.81)

0.85 $

0.06

27

US GAAP Reconciliations

US GAAP Reconciliations Reconciliation of Adjusted EBITDA (USD in millions) Loss Before Income Taxes from Continuing Operations

© 2026

(6.9)

$

(25.6)

3.8

2.9

Depreciation and amortization

6.5

5.5

$

3.4

$

(17.2)

Add: Pre-Tax Business Realignment Costs

1.8

—

Add: Pre-Tax Environmental Remediation Costs

—

0.3

Add: Pre-Tax PM Soot Arbitration Judgment

—

24.2

Adjusted EBITDA

stoneridge.com

$

Q3 2026

Interest expense, net EBITDA

stoneridge.com

Q3 2025

$

5.2

$

7.3

28

US GAAP Reconciliations

US GAAP Reconciliations Reconciliation of Electronics Adjusted Operating Income (USD in millions)

Q3 2025

Electronics Operating Income

$

Add: Pre-Tax Business Realignment Costs Electronics Adjusted Operating Income

$

Q3 2026

5.9 $

5.4

0.9

—

6.7 $

5.4

Reconciliation of Stoneridge Brazil Adjusted Operating Income (USD in millions)

stoneridge.com

stoneridge.com © 2026

Q3 2025

Q3 2026

Stoneridge Brazil Operating Income

$

2.7

$

2.5

Stoneridge Brazil Adjusted Operating Income

$

2.7

$

2.5

29

US GAAP Reconciliations

US GAAP Reconciliations Reconciliation of Net Debt (USD in millions) Total Debt

Q3 2025 $

Cash and Cash Equivalents Net Debt

stoneridge.com

stoneridge.com © 2026

171.1

Q3 2026 $

49.3 $

121.8

143.7

63.4 $

80.2

30

stoneridge.com

stoneridge.com © 2026

Stoneridge

Stoneridge

@StoneridgeInc

@StoneridgeInc

StoneridgeGlobal

31
Stoneridge Reports Third Quarter 2026 Results Bull 3 Bear 4 Results

Nov 4, 2026 | News Releases

Print/Save as PDF

Continued Sales Momentum and Cost Discipline Highlight 3Q Progress

NOVI, Mich., Nov. 4, 2026 /PRNewswire/ — Stoneridge, Inc. (NYSE: SRI) today announced financial results for the third quarter ended September 30, 2026.

Stoneridge, Inc. logo (PRNewsFoto/Stoneridge, Inc.)

2026 Third Quarter Highlights:

Continued sales growth and commercial momentum:

  • Reported Q3 sales growth of 12.4% YoY to $155.8 million, which reflects a $24.2 million reduction to net sales for the PM sensor arbitration award described below. On an adjusted basis, revenue improved 29.9% to $180.0 million;
  • Record quarterly revenue for MirrorEye (>$37 million) and Stoneridge Brazil ($21.5 million);
  • Stoneridge Electronics secures significant additional orders for existing vision systems in the OEM market which are expected to generate approximately $180 million in cumulative incremental sales through 2028.

Disciplined execution yields improved adjusted financial results:

  • SG&A as a percentage of adjusted revenue improved 317 basis points YoY to 13.1%; on track to deliver over $5 million in cost savings in 2026;
  • Net loss from continuing operations of $22.9 million, or $0.81 per diluted share, versus a net loss of $8.9 million, or $0.32 per diluted share, in the prior year. Adjusted net income from continuing operations was $1.6 million, or $0.06 per diluted share, versus an adjusted net loss of $7.6 million, or $0.27 per diluted share in the third quarter of 2025;
  • Adjusted EBITDA of $7.3 million, representing 41.7% growth versus the third quarter of 2025

Revising full-year guidance:

  • Adjusted sales in the range of $690 million to $700 million (versus the prior range of $645 million to $670 million) on improved market demand, continued product momentum and year-to-date outperformance at Stoneridge Brazil
  • Adjusted EBITDA now anticipated at the bottom end of the prior $20 million to $25 million range driven by higher transitory costs, inflationary pressures and unfavorable currency impacts

“We delivered another quarter of strong execution, with adjusted sales growth of nearly 30% and adjusted EBITDA growth of more than 40% year over year, despite increasing inflationary pressures and supply chain disruption,” said Natalia Noblet, president and chief executive officer. “During the third quarter, we also resolved several legacy customer warranty matters and completed a review of obsolete inventory across our Electronics Division. Finally, the approximate $180 million of additional vision systems business further validates our technology and strengthens our position in the OEM market. We are encouraged by our progress, and our strengthened leadership team remains intensely focused on execution, mitigating inflationary headwinds and delivering results as global vehicle production volumes recover from the cyclical trough.”

Results for the third quarter of 2026 were adversely affected by a pre-tax charge of $24.2 million, recorded as a reduction to net sales, related to an adverse ruling received on November 2, 2026 in the previously disclosed arbitration proceeding brought by a former customer of our Control Devices business regarding legacy PM sensor product warranty claims. The Company exited the PM sensor product line in 2019 and divested its Control Devices business in the first quarter of 2026. The arbitration panel awarded the former customer €22.5 million (approximately $25.5 million), including interest and costs. Because the ruling provided additional evidence about conditions that existed at September 30, 2026, the charge was recognized in third quarter results. The Company disagrees with the ruling and continues to believe the claims lack merit, and it is evaluating its options with respect to the award. However, there can be no assurance that the Company will be successful in appealing the decision and may ultimately be obligated to satisfy the award without modification. Provided that an appeal is not successful, the Company expects to pay the award from cash on hand, including cash held outside the United States, and intends to hold discussions with the former customer regarding the timing of payments.

Due to the material impact this charge had on reported third quarter results, the Company is also furnishing non-GAAP consolidated and segment-level financial measures, which it believes are useful in assessing the Company’s core operating performance. The exhibits attached hereto provide reconciliation details on normalizing adjustments of non-GAAP financial measures used in this press release.

Third Quarter GAAP and Non-GAAP Results & Commentary

(in millions, except percentages and per share data) GAAP Results Non-GAAP Results
Three Months Ended September 30, 2026 Three Months Ended September 30, 2026
$ % $ %
2026 2025 Change Change 2026 2025 Change Change
Net Sales $ 155.8 $ 138.6 $ 17.2 9.5 % $ 180.0 $ 138.6 $ 41.4 29.9 %
Gross Profit 11.5 32.1 (20.6) (57.5) % 35.7 32.8 2.9 8.9 %
Gross Margin % 7.4 % 23.1 % (1,575) bps 19.9 % 23.7 % (382) bps
Income (loss) from Operations (23.8) (1.4) (22.4) (2916.8) % 0.8 0.3 0.4 140.4 %
Income (loss) before taxes from continuing operations (25.6) (6.9) (18.7) (1779.8) % (1.0) (5.2) 4.1 79.7 %
(Benefit) provision for income taxes from continuing operations (2.7) 2.0 (4.7) (173.3) % (2.7) 2.5 (5.1) (209.6) %
Net Income (loss) from continuing operations (22.9) (8.9) (14.0) (855.3) % 1.6 (7.6) 9.3 121.5 %
Net Income (loss) per diluted common share from continuing operations (0.81) (0.32) (0.49) (845.1) % 0.06 (0.27) 0.33 121.1 %
Weighted-average common shares outstanding 28.4 27.9 0.5 1.9 % 28.4 27.9 0.5 1.9 %
Adjusted consolidated EBITDA $ 7.3 $ 5.2 2.2 41.7 %
Adjusted consolidated EBITDA % 4.1 % 3.7 % 34 bps

Consolidated net sales from continuing operations was $155.8 million, an increase of 9.5% YoY, including a $24.2 million reduction to net sales for the PM sensor arbitration award. Adjusted consolidated net sales from continuing operations totaled $180.0 million, an increase of 29.9%. On a core basis, excluding a modest currency translation headwind and Mexico Manufacturing Agreement revenue of $6.3 million related to the sale of the Control Devices business, revenue improved 25.5% YoY. The North American and European commercial vehicle markets and Stoneridge Brazil were the primary contributors to growth in the third quarter.

Gross margin decreased 1,575 basis points to 7.4% from 23.1% in the third quarter of 2025. This includes the reduction to net sales for the PM sensor arbitration award. On an adjusted basis, gross margin of 19.9% declined 382 basis points from 23.7% in the year ago period as cost leverage on higher sales and benefits from targeted expense control initiatives were more than offset by a combination of higher material costs, the resolution of various legacy warranty obligations, strategic inventory-related actions and adverse sales mix in the Stoneridge Brazil business. SG&A as a percentage of adjusted sales declined 317 basis points versus the year ago period to 13.1%, driven by successful overhead and corporate expense reduction efforts.

Consolidated net loss from continuing operations totaled $22.9 million, or $0.81 per diluted share, compared to a net loss of $8.9 million, or $0.32 per diluted share, for the quarter ended September 30, 2025. On an adjusted basis, consolidated net income from continuing operations totaled $1.6 million, or $0.06 per diluted share, compared to an adjusted net loss from continuing operations of $7.6 million, or $0.27 per diluted share, for the prior year quarter.

Adjusted EBITDA totaled $7.3 million, or 4.1% of adjusted sales, compared to $5.2 million, or 3.7% of sales, in the year ago period.

Third Quarter GAAP and Non-GAAP Segment Results & Commentary

(in millions, except percentages and per share data) GAAP Revenue Non-GAAP Revenue
Three Months Ended September 30, 2026 Three Months Ended September 30, 2026
Constant
% % Currency
2026 2025 Change 2026 2025 Change vs. 2025
Electronics $ 158.6 $ 121.5 30.5 % $ 158.6 $ 121.5 30.5 % 31.6 %
Stoneridge Brazil 21.5 17.1 25.3 % 21.5 17.1 25.3 % 19.3 %
Arbitration Award Reduction to Net Sales (24.2) – – –
Consolidated Net Sales 155.8 138.6 12.4 % 180.0 138.6 29.9 % 30.1 %
(in millions, except percentages and per share data)
Operating Income
Three Months Ended September 30, 2026
GAAP Results Non-GAAP Results
% %
2026 2025 Change 2026 2025 Change
Electronics $ 5.4 $ 5.9 (7.6) % $ 5.4 $ 6.7 (20.5) %
% of segment sales 3.4 % 3.7 % (32) bps 3.4 % 5.6 % (217) bps
Stoneridge Brazil 2.5 2.7 (7.6) % 2.5 2.7 (7.6) %
% of segment sales 11.5 % 12.5 % (95) bps 11.5 % 15.7 % (411) bps
Corporate (31.6) (10.0) (237.5) % (7.1) (9.1) 22.3 %
Consolidated Operating Income $ (23.8) $ (1.4) (7011.7) % $ 0.8 $ 0.3 140.4 %
% of consolidated net sales (15.3) % (0.8) % (1,447) bps 0.4 % 0.2 % 20 bps

Electronics third quarter sales of $158.6 million increased by $37.1 million, or 30.5%, relative to the third quarter of 2025. Excluding an unfavorable foreign currency translation impact of $1.4 million and Mexico Manufacturing Agreement revenue related to the sale of the Control Devices business, sales improved 26.4% YoY. Revenue growth versus the third quarter of 2025 was primarily driven by increased volume in the North American and European commercial vehicle markets. Third quarter adjusted operating margin decreased by 217 basis points YoY to 3.4% as the benefits of a higher revenue base and implemented cost initiatives were more than offset by the cumulative impacts of higher material costs, costs to address various legacy warranty obligations, and strategic inventory-related actions.

Stoneridge Brazil third quarter sales of $21.5 million increased by $4.3 million, or 25.3%. Excluding a favorable foreign currency translation impact of $1.0 million, sales improved by 19.3%. Higher OEM sales were the primary driver of growth during the quarter. Third quarter adjusted operating income of $2.5 million, or 11.5% of sales, decreased 411 basis points compared to the third quarter of 2025 as adverse sales mix and higher overhead costs more than offset increased sales volume.

Cash and Debt Balances

As of September 30, 2026, cash and cash equivalents totaled $63.4 million with total debt of $143.7 million, resulting in net debt of $80.2 million. The $47.6 million decrease in net debt compared to December 31, 2025 reflects the deployment of proceeds from the sale of the Control Devices business in January and tighter control of working capital during the year. The Company’s outstanding borrowings under its Credit Facility are classified as a current liability and the Credit Facility matures on July 1, 2027. The company expects to refinance the Credit Facility, and is currently engaged in a global refinancing process.

2026 Outlook & Management Commentary

Based on year-to-date results and current expectations for the fourth quarter, the Company is revising its 2026 guidance ranges. “During the third quarter we made tangible progress realigning our cost structure, which should provide a durable foundation for profitable growth over the long term,” said Noblet. “Given strengthening demand across the European and North American commercial vehicle markets, which is anticipated to carry into 2027, year-to-date outperformance in our Brazilian business, and the demonstrated success of our innovative safety and efficiency enhancing technologies, we now expect 2026 adjusted revenue to exceed our prior expectations. That said, given the proactive measures we have undertaken to resolve several legacy warranty and inventory-related matters that were not envisioned in our original guidance and uncertainty created by ongoing inflationary cost pressures, in particular for semiconductors, and unfavorable currency movements, we now anticipate that full year adjusted EBITDA will come in at the bottom end of our prior expectations.”

2026 FULL YEAR GUIDANCE
(in millions, except percentages and per share data)
Previous Updated
Adjusted Revenue ($M) $645 – $670 $690 – $700
Adjusted Gross Margin 21.5 % – 22.0 % 20.5 % – 21.0 %
Adjusted Operating Margin 0.0 % – 0.5 % (0.5) % – 0.0 %
Adjusted EBITDA ($M) $20 – $25 $20 – $25
% 3.1 % – 3.7 % 2.9 % – 3.6 %

The Company has not provided a reconciliation of its full-year 2026 guidance for adjusted revenue, adjusted gross margin, adjusted operating margin, and adjusted EBITDA (or adjusted EBITDA margin) to the most directly comparable GAAP financial measures because the Company is unable to provide such reconciliations without unreasonable effort. This is due to the inherent difficulty of forecasting with the required precision the timing and amount of various items that have not yet occurred, are out of the Company’s control, or cannot be reasonably predicted. For the same reasons, the Company is unable to address the probable significance of the unavailable reconciling information, which could be material to future results calculated in accordance with GAAP. The Company’s actual results calculated in accordance with GAAP may vary materially from these non-GAAP financial measures presented herein.

**Conference Call on the Web
**A live webcast of Stoneridge’s 2026 third quarter results conference call can be accessed at 8:00 a.m. Eastern Time on Thursday, November 5, 2026, at www.stoneridge.com . A webcast replay will be available following the conclusion of the live conference call.

**About Stoneridge, Inc.
**Stoneridge, Inc., headquartered in Novi, Michigan, is a global supplier of safe and efficient electronic systems and technologies. Our systems and products power vehicle intelligence, while enabling safety and security for on- and off-highway transportation sectors around the world. Additional information about Stoneridge can be found at www.stoneridge.com .

**Forward-Looking Statements
**Statements in this press release contain “forward-looking statements” under the Private Securities Litigation Reform Act of 1995. These statements appear in a number of places in this press release and may include statements regarding the intent, belief or current expectations of the Company, with respect to, among other things, our (i) future product and facility expansion, (ii) strategic focus following the sale of the Control Devices segment, (iii) acquisition strategy, (iv) investments and new product development, (v) growth opportunities related to awarded business, (vi) operational expectations (vii) 2026 guidance, (viii) the arbitration award, and (ix) the refinancing of the Credit Facility. Forward-looking statements may be identified by the words “will,” “may,” “should,” “could,” “would,” “designed to,” “believes,” “plans,” “projects,” “intends,” “expects,” “estimates,” “anticipates,” “continue,” and similar words and expressions. The forward-looking statements are subject to risks and uncertainties that could cause actual events or results to differ materially from those expressed in or implied by these statements. Important factors that could cause actual results to differ materially from those in the forward-looking statements include, among other factors:

  • the ability of our suppliers to supply us with parts and components at competitive prices on a timely basis, including the impact of potential tariffs and trade considerations on their operations and output;
  • fluctuations in the cost and availability of key materials and components (including semiconductors, printed circuit boards, resin, aluminum, steel and copper) and our ability to offset cost increases through negotiated price increases with or reimbursements from our customers or other cost reduction actions, as necessary;
  • global economic trends, competition and geopolitical risks, including impacts from ongoing or potential global conflicts and any related sanctions and other measures, or an escalation of sanctions, tariffs or other trade tensions between the U.S. and other countries;
  • tariffs specifically in countries where we have significant direct or indirect manufacturing or supply chain exposure and our ability to either mitigate the impact of tariffs or pass any incremental costs to our customers;
  • our ability to achieve cost reductions that offset or exceed customer-mandated selling price reductions;
  • the reduced purchases, loss, financial distress or bankruptcy of a major customer or supplier;
  • the costs and timing of business realignment, facility closures or similar actions;
  • a significant change in commercial, automotive, off-highway or agricultural vehicle production;
  • competitive market conditions and resulting effects on sales and pricing;
  • foreign currency fluctuations and our ability to manage those impacts;
  • customer acceptance of new products;
  • our ability to successfully launch/produce products for awarded business;
  • adverse changes in laws, government regulations or market conditions affecting our products, our suppliers, or our customers’ products;
  • our ability to protect our intellectual property and successfully defend against assertions made against us;
  • liabilities arising from warranty claims, product recall or field actions, product liability and legal proceedings to which we are or may become a party, or the impact of product recall or field actions on our customers;
  • labor disruptions at our facilities, or at any of our significant customers or suppliers;
  • business disruptions due to natural disasters or other disasters outside of our control;
  • the amount of our indebtedness and the restrictive covenants contained in the agreements governing our indebtedness, including our revolving credit facility;
  • capital availability or costs, including changes in interest rates;
  • refinancing risk and access to capital markets and liquidity;
  • the failure to achieve the successful integration of any acquired company or business;
  • risks related to a failure of our information technology systems and networks, and risks associated with current and emerging technology threats and damage from computer viruses, unauthorized access, cyber-attack and other similar disruptions;
  • our ability to comply with the financial covenants in, and to refinance or replace, our Credit Facility before its July 1, 2027 maturity; and
  • the items described in Part I, Item 1A (“Risk Factors”) in the Company’s most recent Form 10-K.

The forward-looking statements contained herein represent our estimates only as of the date of this press release and should not be relied upon as representing our estimates as of any subsequent date. While we may elect to update these forward-looking statements at some point in the future, except as required by law, we specifically disclaim any obligation to do so, whether to reflect actual results, changes in assumptions, changes in other factors affecting such forward-looking statements or otherwise.

Use of Non-GAAP Financial Information

This press release contains information about the Company’s financial results that is not presented in accordance with accounting principles generally accepted in the United States (“GAAP”). Such non-GAAP financial measures are reconciled to their closest GAAP financial measures at the end of this press release. The provision of these non-GAAP financial measures for 2026 and 2025 is not intended to indicate that Stoneridge is explicitly or implicitly providing projections on those non-GAAP financial measures, and actual results for such measures are likely to vary from those presented. The reconciliations include all information reasonably available to the Company at the date of this press release and the adjustments that management can reasonably estimate.

In evaluating its business, the Company considers and uses net debt as a supplemental measure of its liquidity and the other non-GAAP financial measures as supplemental measures of its operating performance. Management believes the non-GAAP financial measures used in this press release are useful to both management and investors in their analysis of the Company’s financial position and results of operations. In particular, management believes that core revenue, adjusted revenue, adjusted gross profit and margin, adjusted SG&A, adjusted operating income (loss) and margin, adjusted income (loss) before tax, adjusted income tax expense (benefit), adjusted net income (loss) from continuing operations, adjusted net income (loss), adjusted EPS, EBITDA, adjusted EBITDA, and net debt are useful measures in assessing the Company’s financial performance by excluding certain items that are not indicative of the Company’s core operating performance or that may obscure trends useful in evaluating the Company’s continuing operating activities. Management also believes that these measures are useful to both management and investors in their analysis of the Company’s results of operations and provide improved comparability between fiscal periods.

Adjusted revenue, adjusted gross profit and margin, adjusted operating income (loss) and margin, adjusted income (loss) before tax, adjusted income tax expense (benefit), adjusted net income (loss) from continuing operations, adjusted net income (loss), adjusted EPS, EBITDA, adjusted EBITDA, and net debt should not be considered in isolation or as a substitute for revenue, gross profit, operating income (loss), income (loss) before tax, income tax expense (benefit), loss from continuing operations, net income (loss), EPS, debt, cash and cash equivalents, cash provided by operating activities or other income statement or cash flow statement data prepared in accordance with GAAP. Because not all companies calculate non-GAAP financial measures in the same manner, the non-GAAP financial measures presented in this press release may not be comparable to similarly titled measures used by other companies, and the Company’s use of these measures may vary from that of other companies in its industry.

CONDENSED CONSOLIDATED BALANCE SHEETS

(in thousands) September 30, 2026 December 31, 2025
(unaudited)
ASSETS
Current assets:
Cash and cash equivalents $ 63,446 $ 53,057
Accounts receivable, less reserves of $527 and $325, respectively 140,013 89,019
Inventories, net 123,676 106,422
Prepaid expenses and other current assets 23,301 26,956
Current assets of discontinued operations – 86,342
Total current assets 350,436 361,796
Long-term assets:
Property, plant and equipment, net 59,933 62,659
Intangible assets, net 30,852 37,632
Goodwill 36,208 37,590
Operating lease right-of-use asset 7,529 9,570
Investments and other long-term assets, net 25,206 22,167
Long-term assets of discontinued operations – 19,702
Total long-term assets 159,728 189,320
Total assets $ 510,164 $ 551,116
LIABILITIES AND SHAREHOLDERS’ EQUITY
Revolving credit facility $ 143,691 $ –
Accounts payable 117,985 62,398
Accrued expenses and other current liabilities 102,387 65,132
Current liabilities of discontinued operations – 29,955
Total current liabilities 364,063 157,485
Long-term liabilities:
Revolving credit facility – 180,942
Deferred income taxes 4,301 9,972
Operating lease long-term liability 5,055 6,601
Other long-term liabilities 12,454 11,604
Long-term liabilities of discontinued operations – 4,733
Total long-term liabilities 21,810 213,852
Preferred Shares, without par value, 5,000 shares authorized, none issued – –
Common Shares, without par value, 60,000 shares authorized, 28,966 and 28,966 shares issued and 28,538 and 28,018 shares outstanding at September 30, 2026 and December 31, 2025, respectively, with no stated value – –
Additional paid-in capital 205,248 219,186
Common Shares held in treasury, 428 and 948 shares at September 30, 2026 and December 31, 2025, respectively, at cost (9,348) (27,457)
Retained earnings 21,044 77,150
Accumulated other comprehensive loss (92,653) (89,100)
Total shareholders’ equity 124,291 179,779
Total liabilities and shareholders’ equity $ 510,164 $ 551,116

CONDENSED CONSOLIDATED STATEMENTS OF OPERATIONS

Three months ended September 30, Nine months ended September 30,
(in thousands, except per share data) 2026 2025 2026 2025
Net sales $ 155,802 $ 138,638 $ 498,033 $ 445,236
Costs and expenses:
Cost of goods sold 144,297 106,571 414,739 341,570
Selling, general and administrative 23,868 22,978 82,458 74,547
Design and development 11,423 10,524 34,788 39,057
Operating loss (23,786) (1,435) (33,952) (9,938)
Interest expense, net 2,868 3,806 8,957 10,280
Equity in (earnings) loss of investee (914) 220 (905) (124)
Other (income) expense, net (138) 1,463 (317) 2,860
Loss before income taxes from continuing operations (25,602) (6,924) (41,687) (22,954)
(Benefit) provision for income taxes from continuing operations (2,689) 1,970 1,280 5,087
Loss from continuing operations (22,913) (8,894) (42,967) (28,041)
Discontinued operations:
Loss (income) from discontinued operations, net of tax – 477 3,322 (2,115)
Loss on disposal, net of tax – – 9,817 –
Total loss (income) from discontinued operations – 477 13,139 (2,115)
Net loss $ (22,913) $ (9,371) $ (56,106) $ (25,926)
Loss per share from continuing operations:
Basic $ (0.81) $ (0.32) $ (1.52) $ (1.01)
Diluted $ (0.81) $ (0.32) $ (1.52) $ (1.01)
Income (loss) per share from discontinued operations:
Basic $ – $ (0.02) $ (0.47) $ 0.08
Diluted $ – $ (0.02) $ (0.47) $ 0.08
Loss per share from Stoneridge Inc.:
Basic $ (0.81) $ (0.34) $ (1.99) $ (0.93)
Diluted $ (0.81) $ (0.34) $ (1.99) $ (0.93)
Weighted-average shares outstanding:
Basic 28,387 27,859 28,176 27,776
Diluted 28,387 27,859 28,176 27,776

Regulation G Non-GAAP Financial Measure Reconciliations

Exhibit 1 – Reconciliation of Adjusted Net Sales

(USD in millions) Q3 2025 Q3 2026
Net Sales $ 138.6 $ 155.8
Add: Pre-Tax PM Soot Arbitration Judgment $ – 24.2
Adjusted Net Sales $ 138.6 $ 180.0

Exhibit 2 – Reconciliation of Adjusted Gross Profit

(USD in millions) 0 0
Gross Profit $ 32.1 $ 11.5
Add: Pre-Tax Business Realignment Costs $ 0.7 –
Add: Pre-Tax PM Soot Arbitration Judgment $ – $ 24.2
Adjusted Gross Profit $ 32.8 $ 35.7

Exhibit 3 – Reconciliation of Adjusted Operating Loss

(USD in millions) 0 0
Operating Loss $ (1.4) $ (23.8)
Add: Pre-Tax Business Realignment Costs 1.8 –
Add: Pre-Tax Environmental Remediation Costs – 0.3
Add: Pre-Tax PM Soot Arbitration Judgment – 24.2
Adjusted Operating Loss $ 0.3 $ 0.8

Exhibit 4 – Reconciliation of Adjusted Loss from Continuing Operations

(USD in millions) Q3 2025 Q3 2026
Loss From Continuing Operations $ (8.9) $ (22.9)
Add: After-Tax Business Realignment Costs 1.3 –
Add: After-Tax Environmental Remediation Costs – 0.3
Add: After-Tax PM Soot Arbitration Judgment – 24.2
Adjusted Loss From Continuing Operations $ (7.6) $ 1.6

Exhibit 5 – Reconciliation of Adjusted Net Loss

(USD in millions) Q3 2025 Q3 2026
Net Loss $ (9.4) $ (22.9)
Add: After-Tax Business Realignment Costs 1.3 –
Add: After-Tax Environmental Remediation Costs – 0.3
Add: After-Tax PM Soot Arbitration Judgment – 24.2
Adjusted Net Loss $ (8.1) $ 1.6

Exhibit 6 – Reconciliation of Q3 Adjusted Tax Rate

(USD in millions) Q3 2026 Tax Rate
Loss Before Tax $ (25.6)
Add: Pre-Tax Environmental Remediation Costs $ 0.3
Add: Pre-Tax PM Soot Arbitration Judgment $ 24.2
Adjusted Loss Before Tax $ (1.0)
Income Tax Expense (2.7) 10.50 %
Add: Tax Impact from Pre-Tax Adjustments –
Adjusted Income Tax Expense on Adjusted Loss Before Tax $ (2.7) 256.18 %

E****xhibit 7 – Reconciliation of Q3 Adjusted Net Loss and EPS

(USD in millions, except EPS) Q3 2026 Q3 2026 EPS
Net Loss $ (22.9) $ (22,913,310.05)
Add: After-Tax Environmental Remediation Costs 0.3
Add: After-Tax PM Soot Arbitration Judgment 24.2
Adjusted Net Loss $ 1.6 $ 1,638,844.45

Exhibit 8 – Reconciliation of Adjusted EBITDA

(USD in millions) 0 0
Loss Before Income Taxes from Continuing Operations $ (6.9) $ (25.6)
Interest expense, net 3.8 2.9
Depreciation and amortization 6.5 5.5
EBITDA $ 3.4 $ (17.2)
Add: Pre-Tax Business Realignment Costs 1.8 –
Add: Pre-Tax Environmental Remediation Costs – 0.3
Add: Pre-Tax PM Soot Arbitration Judgment – 24.2
Adjusted EBITDA $ 5.2 $ 7.3

Exhibit 9 – Segment Adjusted Operating Income

Reconciliation of Electronics Adjusted Operating Income
(USD in millions) 0 0
Electronics Operating Income $ 5.9 $ 5.4
Add: Pre-Tax Business Realignment Costs 0.9 –
Electronics Adjusted Operating Income $ 6.7 $ 5.4
Reconciliation of Stoneridge Brazil Adjusted Operating Income
(USD in millions) 0 0
Stoneridge Brazil Operating Income $ 2.7 $ 2.5
Stoneridge Brazil Adjusted Operating Income $ 2.7 $ 2.5

Exhibit 10 – Reconciliation of Net Debt

(USD in millions) Q3 2025 Q3 2026
Total Debt $ 171.1 $ 143.7
Cash and Cash Equivalents 49.3 63.4
Net Debt $ 121.8 $ 80.2

Cision View original content to download multimedia:https://www.prnewswire.com/news-releases/stoneridge-reports-third-quarter-2026-results-302929928.html

SOURCE Stoneridge, Inc.

Recent News

Stoneridge and Kodiak AI Announce Collaboration to Advance Autonomous Commercial Vehicles

Stoneridge and Kodiak AI Announce Collaboration to Advance Autonomous Commercial Vehicles


Oct 28, 2026

Stoneridge MirrorEye® Camera Monitor System (CMS) now in use on Kodiak Driver-equipped trucksCompanies to explore integrating additional Stoneridge technology into Kodiak autonomous driving solutionMirrorEye gives Kodiak flexibility in SensorPod designNOVI,...

Stoneridge and Kodiak AI Announce Collaboration to Advance Autonomous Commercial Vehicles

Stoneridge, Inc. Schedules Third Quarter 2026 Financial Results and Earnings Conference Call


Oct 19, 2026

NOVI, Mich., Oct. 19, 2026 /PRNewswire/ -- Stoneridge, Inc. (NYSE: SRI) will release third quarter financial results after the market close on Wednesday, November 4, 2026. The company will hold a conference call the following day, Thursday, November 5, at 8:00am ET,...

Stoneridge and Kodiak AI Announce Collaboration to Advance Autonomous Commercial Vehicles

Stoneridge Appoints Uwe Brandenburg as Global Vice President, Engineering & Innovation


Sep 23, 2026

NOVI, Mich., Sept. 23, 2026 /PRNewswire/ -- Stoneridge, Inc. (NYSE: SRI), a global leader of safe, intelligent and efficient electronic technologies for the commercial vehicle and off-highway equipment markets, today announced the appointment of Uwe Brandenburg as...

View All

About Us

Locations

Leadership

Careers

Contact Us

Sustainability

All Products

MirrorEye® CMS

Investors Home

SEC Filings

Presentations & Events

Annual Reports

Stock Information

Corporate Governance

Board of Directors

Investor Resources

Suppliers

Supplier Portal

Newsroom

Press Releases

In the News

Media Kit

© 2025 Stoneridge  |  Privacy  |  Terms & Conditions of Sale |  TiC – Machine Readable Files | Stoneridge Integrity Helpline

Manage Consent

To provide the best experiences, we use technologies like cookies to store and/or access device information. Consenting to these technologies will allow us to process data such as browsing behavior or unique IDs on this site. Not consenting or withdrawing consent, may adversely affect certain features and functions.

Functional Functional Always active

The technical storage or access is strictly necessary for the legitimate purpose of enabling the use of a specific service explicitly requested by the subscriber or user, or for the sole purpose of carrying out the transmission of a communication over an electronic communications network.

Preferences Preferences

The technical storage or access is necessary for the legitimate purpose of storing preferences that are not requested by the subscriber or user.

Statistics Statistics

The technical storage or access that is used exclusively for statistical purposes. The technical storage or access that is used exclusively for anonymous statistical purposes. Without a subpoena, voluntary compliance on the part of your Internet Service Provider, or additional records from a third party, information stored or retrieved for this purpose alone cannot usually be used to identify you.

Marketing Marketing

The technical storage or access is required to create user profiles to send advertising, or to track the user on a website or across several websites for similar marketing purposes.

Accept Deny View preferences Save preferences View preferences

Manage consent

Oct 28, 2026 | News Releases

Print/Save as PDF

  • Stoneridge MirrorEye® Camera Monitor System (CMS) now in use on Kodiak Driver-equipped trucks
  • Companies to explore integrating additional Stoneridge technology into Kodiak autonomous driving solution
  • MirrorEye gives Kodiak flexibility in SensorPod design

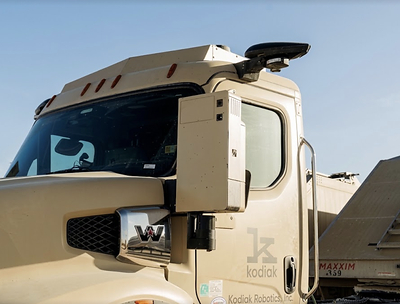
NOVI, Mich., Oct. 28, 2026 /PRNewswire/ — Stoneridge, Inc. (NYSE: SRI), a global supplier of safe and efficient electronic systems and technologies, today announced its collaboration with Kodiak AI, Inc. (Nasdaq: KDK), a leading provider of Physical AI-powered autonomous driving technology. The collaboration begins with Stoneridge’s MirrorEye Camera Monitor System (CMS), which is incorporated in newly deployed trucks equipped with the Kodiak Driver, Kodiak’s AI-powered autonomous driving system. The two companies plan to explore integrating additional Stoneridge technology into Kodiak Driver-equipped trucks.

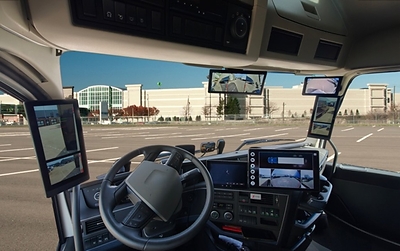
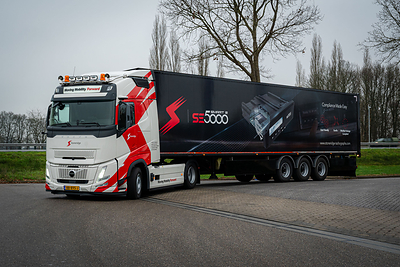
Kodiak Driver-powered truck equipped with MirrorEye

Kodiak’s proprietary SensorPods replace conventional side mirrors on the truck cab, providing enhanced visibility. These SensorPods have, until now, included conventional rear-vision mirrors as required by U.S. regulations for commercial trucks. Stoneridge’s CMS was the first to receive an exemption from the Federal Motor Carrier Safety Administration (FMCSA) that authorizes motor carriers to operate MirrorEye-equipped trucks without conventional rear-vision mirrors. FMCSA renewed the exemption in 2024 for five years. Because MirrorEye’s cameras sit in a compact wing above the cab door, the exemption gives Kodiak the ability to design future SensorPods without traditional mirrors, making them smaller, lighter, easier to replace and more aerodynamic.

As part of the collaboration, Stoneridge and Kodiak will explore how to further integrate Stoneridge technologies into Kodiak’s autonomous vehicle platform and develop solutions that improve how vehicle data is processed.

“MirrorEye was developed to make commercial vehicles safer by providing drivers and operators a much better view and situational awareness while also delivering meaningful aerodynamic and efficiency benefits,” said Natalia Noblet, President and CEO of Stoneridge. “On Kodiak’s trucks, it becomes part of an autonomous system, and over the next several years we will work with Kodiak to explore ways our cameras and other technology can support that system more directly. We are excited to partner with Kodiak to advance autonomous trucking and to bring Stoneridge technology to that work.”

“Our collaboration with Stoneridge involving its MirrorEye technology represents an important component of Kodiak’s preparations for the safe deployment of driverless technology at scale,” said Jamie Hoffacker, Senior Vice President of Hardware, Kodiak. “We’re excited to explore new ways to deepen our integration and derive further efficiencies and safety benefits from working together.”

MirrorEye replaces traditional mirrors with exterior digital cameras and in-cab high-definition displays. Stoneridge has produced more than 200,000 MirrorEye systems globally since 2020, and the system is offered through six global OEM programs and through retrofit installations with more than 40 fleet partners in North America.

**About Stoneridge, Inc.
**Stoneridge, Inc., headquartered in Novi, Michigan, is a global supplier of safe and efficient electronic systems and technologies. Our systems and products power vehicle intelligence, while enabling safety and security for on- and off-highway transportation sectors around the world. Additional information about Stoneridge can be found at www.stoneridge.com .

Forward-Looking Statements
Statements in this press release that are not historical facts, including statements about the collaboration with Kodiak, the potential integration of additional Stoneridge technologies into Kodiak’s platform, future deployments of MirrorEye, and anticipated benefits of the collaboration, are forward-looking statements under the Private Securities Litigation Reform Act of 1995. These statements are subject to risks and uncertainties that could cause actual results to differ materially, including the parties’ ability to successfully develop and integrate additional technologies, customer and market acceptance of autonomous trucking, regulatory developments (including FMCSA requirements and exemptions), competitive conditions, and the other risks described in Part I, Item 1A (“Risk Factors”) of Stoneridge’s most recent Annual Report on Form 10-K and subsequent filings with the SEC. Forward-looking statements speak only as of the date of this release, and, except as required by law, Stoneridge undertakes no obligation to update them.

Stoneridge, Inc. logo (PRNewsFoto/Stoneridge, Inc.)

Cision View original content to download multimedia:https://www.prnewswire.com/news-releases/stoneridge-and-kodiak-ai-announce-collaboration-to-advance-autonomous-commercial-vehicles-302922481.html

SOURCE Stoneridge, Inc.

Recent News

Stoneridge, Inc. Schedules Third Quarter 2026 Financial Results and Earnings Conference Call

Stoneridge, Inc. Schedules Third Quarter 2026 Financial Results and Earnings Conference Call


Oct 19, 2026

NOVI, Mich., Oct. 19, 2026 /PRNewswire/ -- Stoneridge, Inc. (NYSE: SRI) will release third quarter financial results after the market close on Wednesday, November 4, 2026. The company will hold a conference call the following day, Thursday, November 5, at 8:00am ET,...

Stoneridge, Inc. Schedules Third Quarter 2026 Financial Results and Earnings Conference Call

Stoneridge Appoints Uwe Brandenburg as Global Vice President, Engineering & Innovation


Sep 23, 2026

NOVI, Mich., Sept. 23, 2026 /PRNewswire/ -- Stoneridge, Inc. (NYSE: SRI), a global leader of safe, intelligent and efficient electronic technologies for the commercial vehicle and off-highway equipment markets, today announced the appointment of Uwe Brandenburg as...

Stoneridge, Inc. Schedules Third Quarter 2026 Financial Results and Earnings Conference Call

Stoneridge Simplifies Vehicle Complexity with New EVO ECU Platform for Commercial Vehicles, Buses and Off-Highway


Sep 14, 2026

EVO ECU world debut at IAA Transportation showcases centralized architecture for ADAS, diagnostics and future software-enabled functions EVO ECU platform enables new MirrorEye® safety and security functions Stoneridge Innovation Truck and Simulator demonstrates full...

View All

About Us

Locations

Leadership

Careers

Contact Us

Sustainability

All Products

MirrorEye® CMS

Investors Home

SEC Filings

Presentations & Events

Annual Reports

Stock Information

Corporate Governance

Board of Directors

Investor Resources

Suppliers

Supplier Portal

Newsroom

Press Releases

In the News

Media Kit

© 2025 Stoneridge  |  Privacy  |  Terms & Conditions of Sale |  TiC – Machine Readable Files | Stoneridge Integrity Helpline

Manage Consent

To provide the best experiences, we use technologies like cookies to store and/or access device information. Consenting to these technologies will allow us to process data such as browsing behavior or unique IDs on this site. Not consenting or withdrawing consent, may adversely affect certain features and functions.

Functional Functional Always active

The technical storage or access is strictly necessary for the legitimate purpose of enabling the use of a specific service explicitly requested by the subscriber or user, or for the sole purpose of carrying out the transmission of a communication over an electronic communications network.

Preferences Preferences

The technical storage or access is necessary for the legitimate purpose of storing preferences that are not requested by the subscriber or user.

Statistics Statistics

The technical storage or access that is used exclusively for statistical purposes. The technical storage or access that is used exclusively for anonymous statistical purposes. Without a subpoena, voluntary compliance on the part of your Internet Service Provider, or additional records from a third party, information stored or retrieved for this purpose alone cannot usually be used to identify you.

Marketing Marketing

The technical storage or access is required to create user profiles to send advertising, or to track the user on a website or across several websites for similar marketing purposes.

Accept Deny View preferences Save preferences View preferences

Manage consent

Prompts

Stoneridge, Inc. (ticker SRI), listed in United States.

ETFs Holding Stoneridge, Inc.

ETF Weight in ETF Shares Market value As of
FSCC 0.35% 185,376 $ 1.283M Aug 31, 2026
AVUV 0.02% 1,083,353 $ 5.406M Nov 16, 2026
BSVO 0.02% 77,060 $ 390K Nov 18, 2026
AVSC 0.01% 43,097 $ 215.054K Nov 16, 2026
DFSV 0.00% 196,635 $ 1.001M Nov 12, 2026
DFAS 0.00% 183,518 $ 934.107K Nov 12, 2026
DFSU 0.00% 6,300 $ 32.067K Nov 12, 2026
DXUV 0.00% 9,949 $ 50.64K Nov 12, 2026
DFAC 0.00% 67,521 $ 343.682K Nov 12, 2026
DFAU 0.00% 7,100 $ 36.139K Nov 12, 2026
DCOR 0.00% 11,592 $ 59.003K Nov 12, 2026
DFUS 0.00% 4,093 $ 20.833K Nov 12, 2026
AVUS 0.00% 17,256 $ 86.107K Nov 16, 2026