Jan 20, 2026 KNOXVILLE, TN – January 20, 2026 – SmartFinancial, Inc. (“SmartFinancial” or the “Company”; NYSE: SMBK), today announced net income of $13.7 million, or $0.81 per diluted common share, for the fourth quarter of 2025, compared to net…
Jan 20, 2026
KNOXVILLE, TN – January 20, 2026 – SmartFinancial, Inc. (“SmartFinancial” or the “Company”; NYSE: SMBK), today announced net income of $13.7 million, or $0.81 per diluted common share, for the fourth quarter of 2025, compared to net income of $9.6 million, or $0.57 per diluted common share, for the fourth quarter of 2024, and compared to prior quarter net income of $13.7 million, or $0.81 per diluted common share. Operating earnings1, which excludes non-recurring income and expenses, net of tax adjustments, totaled $13.7 million, or $0.81 per diluted common share, in the fourth quarter of 2025, compared to $9.6 million, or $0.57 per diluted common share, in the fourth quarter of 2024, and compared to $14.5 million, or $0.86 per diluted common share, in the third quarter of 2025.
Highlights for the Fourth Quarter of 2025
-
Operating earnings of $13.7 million, or $0.81 per diluted common share
-
Net organic loan and lease growth of $141 million with 13% annualized quarter-over-quarter increase
-
Deposit growth of $102 million or 8% annualized quarter-over-quarter
-
Net interest margin, fully tax equivalent basis (“FTE”) expanded to 3.38%, reflecting lower deposit and funding costs
-
Quarter over quarter tangible book value per common share1 growth of 13%
-
Seventh consecutive quarter of positive operating leverage
-
Columbus, GA expansion with two additional commercial bankers
-
Multi-year core contract renegotiation process completed
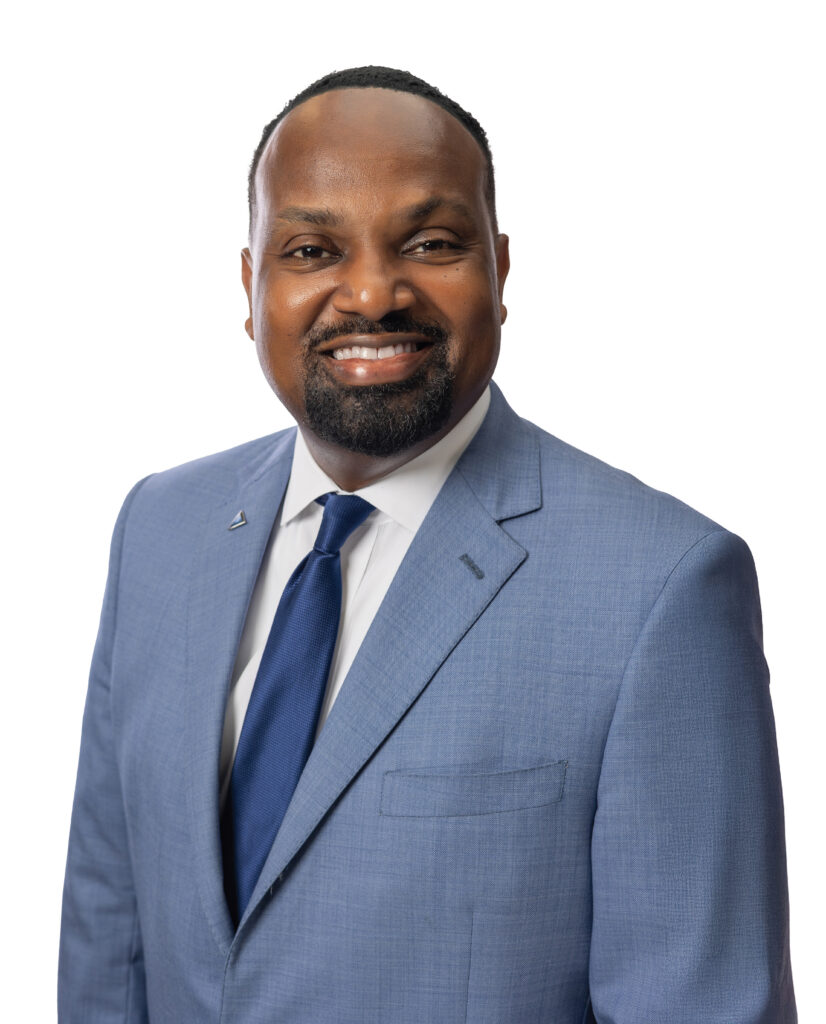
Billy Carroll, President & CEO, stated: “2025 marked a year of tremendous momentum build and overall improvement for our company. We generated approximately 11% positive operating leverage in 2025 capped off by our seventh consecutive quarter of positive operating leverage in Q4. The year was highlighted by approximately 12% organic loan growth, 14% organic deposit growth excluding brokered deposits and tangible book value per common share1 rose 17%. Overall, a fantastic year for our company paving the way for an even brighter 2026. I want to thank all of our Associates whose tireless work and dedication make SmartBank a great place to work and do business. They are the driving force behind our success.”
SmartFinancial’s Chairman, Miller Welborn, concluded: “2025 was an exceptional year marked by growth, profitability, and continued improvement. The Board is extremely pleased with the Company’s ongoing financial progress, which is particularly impressive considering the range of strategic initiatives completed during the year. Operational excellence and a solid foundation remain essential for sustained success, and our Associates consistently demonstrate commitment in every area. We appreciate your contributions in making SmartBank an outstanding organization and valued partner for our stakeholders.”
Net Interest Income and Net Interest Margin
Net interest income was $45.1 million for the fourth quarter of 2025, compared to $42.4 million for the prior quarter. Average earning assets totaled $5.34 billion, an increase of $112.3 million from the prior quarter. The balances of average earnings assets increased quarter-over-quarter, primarily from an increase in average loans and leases of $124.0 million and average securities of $32.7 million, offset by a decrease in average interest-earning cash of $44.3 million. Average interest-bearing liabilities increased by $18.6 million from the prior quarter, primarily attributable to an increase in average interest-bearing deposits of $6.0 million and average subordinated debt of $13.9 million, offset by a decrease in borrowings of $1.3 million.
The tax equivalent net interest margin was 3.38% for the fourth quarter of 2025, up from 3.25% for the prior quarter. This increase is primarily related to declines in deposit costs, outpacing a modest decrease in asset yields. The yield on loans and leases, excluding loan fees, FTE was 6.00% for the fourth quarter of 2025, compared to 6.05% for the prior quarter.
The cost of total deposits for the fourth quarter of 2025 was 2.26%, compared to 2.44% in the prior quarter. The cost of interest-bearing liabilities was 2.90% for the fourth quarter of 2025, compared to 3.07% in the prior quarter. The cost of average interest-bearing deposits was 2.79% for the fourth quarter of 2025, compared to 2.98% for the prior quarter, a decrease of 19 basis points.
The following table presents selected interest rates and yields for the periods indicated:
| | | | | | | | |
| --- | --- | --- | --- | --- | --- | --- | --- |
| | | | | | | | |
| | | Three Months Ended | | | | | |
| | | Dec | | Sep | | Increase | |
| Selected Interest Rates and Yields | | 2025 | | 2025 | | (Decrease) | |
| Yield on loans and leases, excluding loan fees, FTE | | 6.00 | % | 6.05 | % | (0.05) | % |
| Yield on loans and leases, FTE | | 6.08 | % | 6.14 | % | (0.06) | % |
| Yield on earning assets, FTE | | 5.65 | % | 5.68 | % | (0.03) | % |
| Cost of interest-bearing deposits | | 2.79 | % | 2.98 | % | (0.19) | % |
| Cost of total deposits | | 2.26 | % | 2.44 | % | (0.18) | % |
| Cost of interest-bearing liabilities | | 2.90 | % | 3.07 | % | (0.17) | % |
| Net interest margin, FTE | | 3.38 | % | 3.25 | % | 0.13 | % |
Provision for Credit Losses on Loans and Leases and Credit Quality
At December 31, 2025, the allowance for credit losses was $40.9 million. The allowance for credit losses to total loans and leases was 0.94% as of December 31, 2025, and 0.93% as of September 30, 2025.
The following table presents detailed information related to the provision for credit losses for the periods indicated (dollars in thousands):
| | | | | | | | | | | | |
| --- | --- | --- | --- | --- | --- | --- | --- | --- | --- | --- | --- |
| | | | | | | | | | | | |
| | | | Three Months Ended | | | | | | | | |
| | | | | Dec | | | Sep | | | Increase | |
| | Provision for Credit Losses on Loans and Leases Rollforward | | | 2025 | | | 2025 | | | (Decrease) | |
| | Beginning balance | | $ | 39,074 | | $ | 39,776 | | $ | (702) | |
| | Charge-offs | | | (1,993) | | | (1,145) | | | (848) | |
| | Recoveries | | | 101 | | | 92 | | | 9 | |
| | Net charge-offs | | | (1,892) | | | (1,053) | | | (839) | |
| | Provision for credit losses (1) | | | 3,724 | | | 351 | | | 3,373 | |
| | Ending balance | | $ | 40,906 | | $ | 39,074 | | $ | 1,832 | |
| | | | | | | | | | | | |
| | Allowance for credit losses to total loans and leases, gross | | | 0.94 | % | | 0.93 | % | | 0.01 | % |
- The current quarter-ended and prior quarter-ended excludes an unfunded commitments provision of $408 thousand and a release of $124 thousand, respectively. At December 31, 2025, and September 30, 2025, the unfunded commitment liability totaled $3.6 million and $3.2 million, respectively.
Nonperforming loans and leases as a percentage of total loans and leases was 0.22% as of December 31, 2025, and 0.24% as of September 30, 2025. Total nonperforming assets (which include nonaccrual loans and leases, loans and leases past due 90 days or more and still accruing, other real estate owned and other repossessed assets) as a percentage of total assets was 0.22% as of December 31, 2025, and September 30, 2025.
The following table presents detailed information related to credit quality for the periods indicated (dollars in thousands):
| | | | | | | | | | | | |
| --- | --- | --- | --- | --- | --- | --- | --- | --- | --- | --- | --- |
| | | | | | | | | | | | |
| | | | Three Months Ended | | | | | | | | |
| | | | | Dec | | | Sep | | | Increase | |
| | Credit Quality | | | 2025 | | | 2025 | | | (Decrease) | |
| | Nonaccrual loans and leases | | $ | 9,442 | | $ | 9,970 | | $ | (528) | |
| | Loans and leases past due 90 days or more and still accruing | | | – | | | 129 | | | (129) | |
| | Total nonperforming loans and leases | | | 9,442 | | | 10,099 | | | (657) | |
| | Other real estate owned | | | – | | | – | | | – | |
| | Other repossessed assets | | | 3,248 | | | 2,444 | | | 804 | |
| | Total nonperforming assets | | $ | 12,690 | | $ | 12,543 | | $ | 147 | |
| | | | | | | | | | | | |
| | Nonperforming loans and leases to total loans and leases, gross | | | 0.22 | % | | 0.24 | % | | (0.02) | % |
| | Nonperforming assets to total assets | | | 0.22 | % | | 0.22 | % | | – | % |
Noninterest Income
Noninterest income decreased $418 thousand to $8.2 million for the fourth quarter of 2025, compared to $8.6 million for the prior quarter. The fourth quarter decrease was attributable to the reduction of insurance commissions and the gain on sale of SBK Insurance (“SBKI”) in the prior quarter. Additionally, in the prior quarter, there was a pre-tax loss of $3.9 million on the sale of $85 million of available-for-sale securities. These changes were offset by higher capital markets’ income included in other noninterest income.
The following table presents detailed information related to noninterest income for the periods indicated (dollars in thousands):
| | | | | | | | | | |
| --- | --- | --- | --- | --- | --- | --- | --- | --- | --- |
| | | | | | | | | | |
| | | Three Months Ended | | | | | | | |
| | | | Dec | | | Sep | | | Increase |
| Noninterest Income | | | 2025 | | | 2025 | | | (Decrease) |
| Service charges on deposit accounts | | $ | 1,828 | | $ | 1,831 | | $ | (3) |
| Loss on sale of securities, net | | | – | | | (3,715) | | | 3,715 |
| Mortgage banking income | | | 837 | | | 709 | | | 128 |
| Investment services | | | 1,683 | | | 1,690 | | | (7) |
| Insurance commissions | | | – | | | 1,049 | | | (1,049) |
| Interchange and debit card transaction fees | | | 1,375 | | | 1,338 | | | 37 |
| Gain on sale of SBKI | | | – | | | 3,955 | | | (3,955) |
| Other | | | 2,496 | | | 1,780 | | | 716 |
| Total noninterest income | | $ | 8,219 | | $ | 8,637 | | $ | (418) |
Noninterest Expense
Noninterest expense decreased $1.4 million to $32.5 million for the fourth quarter of 2025, compared to $33.9 million for the prior quarter. The fourth quarter’s decrease was primarily attributable to a decrease in restructuring expenses associated with the sale of SBKI.
The following table presents detailed information related to noninterest expense for the periods indicated (dollars in thousands):
| | | | | | | | | | |
| --- | --- | --- | --- | --- | --- | --- | --- | --- | --- |
| | | | | | | | | | |
| | | Three Months Ended | | | | | | | |
| | | | Dec | | | Sep | | | Increase |
| Noninterest Expense | | | 2025 | | | 2025 | | | (Decrease) |
| Salaries and employee benefits | | $ | 19,917 | | $ | 19,544 | | $ | 373 |
| Occupancy and equipment | | | 3,388 | | | 3,468 | | | (80) |
| FDIC insurance | | | 1,025 | | | 1,025 | | | – |
| Other real estate and loan related expenses | | | 858 | | | 969 | | | (111) |
| Advertising and marketing | | | 393 | | | 454 | | | (61) |
| Data processing and technology | | | 2,413 | | | 2,594 | | | (181) |
| Professional services | | | 1,132 | | | 1,123 | | | 9 |
| Amortization of intangibles | | | 479 | | | 536 | | | (57) |
| Restructuring expenses | | | 16 | | | 1,310 | | | (1,294) |
| Other | | | 2,850 | | | 2,846 | | | 4 |
| Total noninterest expense | | $ | 32,471 | | $ | 33,869 | | $ | (1,398) |
Income Tax Expense
Income tax expense was $3.0 million for the fourth quarter of 2025, a decrease of $278 thousand, compared to $3.3 million for the prior quarter.
Balance Sheet Trends
Total assets at December 31, 2025, were $5.86 billion compared to $5.28 billion at December 31, 2024. The $584.9 million increase is primarily attributable to increases in loans and leases of $457.2 million, cash and cash equivalents of $76.8 million, securities of $53.0 million, loans held for sale of $4.9 million, bank owned life insurance of $3.6 million and other investments of $1.7 million, offset by a decrease in goodwill and other intangibles of $9.4 million, primarily associated with the sale of SBKI, and a decrease in premises and equipment of $2.7 million.
Total liabilities were $5.31 billion at December 31, 2025, compared to $4.78 billion at December 31, 2024, an increase of $523.9 million. Total deposits increased $466.3 million, which was driven primarily by increases in money market deposits of $234.1 million, other time deposits of $185.9 million, interest-bearing demand deposits of $109.0 million and noninterest demand deposits of $97.4 million, offset by a decline in brokered deposits of $160.0 million. In addition, subordinated debt increased $59.0 million as a result of issuing $100.0 million in new subordinated debt and retiring the existing $40.0 million of subordinated debt.
Shareholders’ equity at December 31, 2025, totaled $552.5 million, an increase of $61.0 million, from December 31, 2024. The increase in shareholders’ equity was primarily driven by net income of $50.3 million for the twelve months ending December 31, 2025, and a reduction of $14.4 million in accumulated other comprehensive loss, offset by dividends paid of $5.4 million. Tangible book value per common share was $26.85 at December 31, 2025, compared to $22.85 at December 31, 2024. Tangible common equity1 as a percentage of tangible assets1 was 7.93% at December 31, 2025, compared with 7.48% at December 31, 2024.
The following table presents selected balance sheet information for the periods indicated (dollars in thousands):
| | | | | | | | | | | |
| --- | --- | --- | --- | --- | --- | --- | --- | --- | --- | --- |
| | | | | | | | | | | |
| | | Dec | | | Dec | | | Increase | | |
| Selected Balance Sheet Information | | 2025 | | | 2024 | | | (Decrease) | | |
| Total assets | | $ | 5,860,810 | | $ | 5,275,904 | | $ | 584,906 | |
| Total liabilities | | | 5,308,318 | | | 4,784,443 | | | 523,875 | |
| Total equity | | | 552,492 | | | 491,461 | | | 61,031 | |
| Securities | | | 662,003 | | | 608,987 | | | 53,016 | |
| Loans and leases | | | 4,363,582 | | | 3,906,340 | | | 457,242 | |
| Deposits | | | 5,152,789 | | | 4,686,483 | | | 466,306 | |
| Borrowings | | | 3,009 | | | 8,135 | | | (5,126) | |
Conference Call Information
SmartFinancial issued this earnings release for the fourth quarter of 2025 on Tuesday, January 20, 2026, and will host a conference call on Wednesday, January 21, 2026, at 10:00 a.m. ET. To access this interactive teleconference, dial (833) 470-1428 or (646) 844-6383 and enter the access code, 680807. A replay of the conference call will be available through March 21, 2026, by dialing (866) 813-9403 or (929) 458-6194 and enter the access code, 497919. Conference call materials will be published on the Company’s webpage located at http://www.smartfinancialinc.com/CorporateProfile
, at 9:00 a.m. ET prior to the conference call.



 **PANAMA CITY and PANAMA CITY BEACH, Fla. – SmartBank has expanded its presence in the Florida Panhandle with the addition of two experienced local banking leaders. Austin Klanjac has joined as president of its Panama City market and Jason Morehouse as president of the Panama City Beach market. Klanjac will permanently base from SmartBank’s Panama City financial center, while Morehouse will initially operate from the same location as the bank continues to grow its presence along the Gulf Coast.

 Huntsville, Ala. – SmartBank has expanded its North Alabama team with the addition of Cara Welsh as vice president, relationship manager in the Huntsville and Madison market. Welsh brings 15 years of banking experience to the role, where she will focus on cultivating long-term client partnerships and supporting the bank’s ongoing regional growth.



 FAIRHOPE, Ala. – SmartBank Investment Services, a division of SmartBank, is pleased to announce that Amanda Montz, Senior Vice President and Raymond James Financial Services (RJFS) Financial Advisor, has earned the CERTIFIED FINANCIAL PLANNER® (CFP®) certification.
 FRANKLIN, Tenn. – SmartBank is pleased to announce the addition of Chip Higgins to its Franklin team as Senior Vice President, Relationship Manager. With more than 42 years of banking experience and a strong understanding of the local market, Higgins will play a key role in strengthening client relationships and supporting SmartBank’s continued growth across the greater Nashville area.
 FAIRHOPE, Ala. – SmartBank is pleased to announce the addition of Stephen Schlautman as Senior Vice President and Corporate Relationship Manager in the Fairhope market. With more than 20 years of banking experience, Schlautman will play a vital role in strengthening already highperforming teams and advancing a continued commitment to client success within the market.
 MONTGOMERY, Ala. – SmartBank is pleased to welcome Chase Hardy to its Montgomery team as a Senior Vice President, Corporate Relationship Manager. With a career spanning 16 years of banking experience and a deep understanding of the local market, Hardy will play a key role in strengthening client partnerships and supporting the bank’s continued growth in the region.
 MONTGOMERY, Ala. – SmartBank is pleased to announce Jay Baker has been promoted to Market President for Montgomery County, Alabama.