SIF
Fiscal year ends September Quarters are offset from the calendar — Q1 is Oct–Dec

SIFCO Industries, Inc. is a manufacturer of forgings, sub-assemblies, and machined components primarily for the Aerospace, Energy, and Defense markets. Incorporated in 1916, the company operates in a single business segment, providing envelope and precision forgings, rough and finished machined components, and sub-assemblies made from steel, high-temperature alloys, nickel alloys, titanium, and aluminum. Its products include OEM and aftermarket components for aircraft and industrial gas turbine engines, steam turbine blades, structural airframe components, aircraft landing gear components, wheels, brakes, and critical rotating components for helicopters. SIFCO serves original equipment manufacturers, Tier 1 and Tier 2 suppliers, and aftermarket service providers, with key customers including Boeing and Airbus, as well as the U.S. military for programs such as the H-60 Black Hawk, C-130, F-18, and F-35. The company also supplies components to the commercial space and semiconductor manufacturing industries. Operations are conducted from facilities in Cleveland, Ohio, and Orange, California, which are certified to AS 9100D and ISO 9001:2015 standards. In October 2024, the company sold its European operations, including its subsidiary CBlade S.p.A., to refocus on its core aerospace forging business.

Summarised from the company's own disclosures, fiscal year ended Dec 2025

Industry Aerospace & Defense Homepage sifco.com
Sector Industrials IR page sifco.com/investor-relations
Tags
forgings, aerospace components, defense components, energy components, titanium alloys, nickel alloys, machined components, heat-treating, aircraft landing gear, gas turbine blades, CBlade S.p.A., SIFCO Irish Holdings Ltd.
Press page —

Metrics

Valuation  
Market cap $ 141.591M
Market cap (USD) $ 141.591M
P/E 35.38
PEG —
P/BV 3.41
P/S 1.42
P/OCF 34.60
P/FCF 41.84
Dividend yield —
Turnover / mcap —
Returns  
ROE -2.2%
ROI -1.5%
ROIC 0.28%
Profit margin -0.86%
Growth  
Revenue growing No
Profits growing Yes
Revenue up 3y No
Revenue up 5y No
Earnings growth 3y (net profit CAGR) —
Quality  
Profitable No
Margin expanding Yes
Buying back stock No
Diluting (TTM) Yes
Debt/Equity —
Podcast bulls (TTM) Sign up
Podcast bears (TTM) Sign up
Podcast sentiment (TTM) Sign up
Podcast sentiment % (TTM) Sign up
News sentiment (TTM) 15
Quality score -41.2%
Insiders  
Buys, 1w Sign up
Buys, 1m Sign up
Buys, 1y Sign up
Sells, 1w Sign up
Sells, 1m Sign up
Sells, 1y Sign up

Sign up to see this company's insider trades

Figure FY 2025 FY 2024 FY 2023 FY 2022 FY 2021 FY 2020 FY 2019 FY 2018 FY 2017 FY 2016 FY 2015 FY 2014 FY 2013 FY 2012 FY 2011 FY 2010 FY 2009 FY 2008 FY 2007 FY 2006 FY 2005 FY 2004 FY 2003 FY 2002 FY 2001 FY 2000
Revenue 84.815M 79.633M 87.022M 83.902M 99.591M 113.573M 112.454M 111.212M 121.458M 119.121M 109.301M 119.654M 116.001M 125.106M 107.357M 83.27M 93.888M 101.391M 87.255M 86.989M 80.968M 87.393M 79.939M — 105.633M 106.138M
Net profit -729K -5.383M -8.692M -9.64M -743K 9.191M -7.506M -7.17M -14.209M -11.335M -2.872M 5.023M 10.234M 6.548M 7.449M 5.362M 8.035M 5.83M 6.728M 960K -196K -5.946M -5.347M -12.986M 2.974M 2.422M
Free cash flow -357K -4.637M -3.817M -2.901M -1.087M -8.577M -3.718M -1.536M 9.656M 9.932M -10.083M 1.166M 4.381M 6.246M 6.927M 3.131M 10.018M 7.785M -1.994M -3.163M -6.904M 90K -1.411M -2.454M 4.979M 7.759M

Figure FY 2025 FY 2024 FY 2023 FY 2022 FY 2021 FY 2020 FY 2019 FY 2018 FY 2017 FY 2016 FY 2015 FY 2014 FY 2013 FY 2012 FY 2011 FY 2010 FY 2009 FY 2008 FY 2007 FY 2006 FY 2005 FY 2004 FY 2003 FY 2002 FY 2001 FY 2000
Share price 7.04 4.65 3.67 3.07 8.6 3.68 2.71 5.05 5.7 9.92 11.28 30.1 18.4 — 16.77 11.26 6 — — 4.2 — — — — — —
Price performance 12m 0.51 0.27 0.19 -0.64 1.34 0.36 -0.46 -0.11 -0.43 -0.12 -0.63 0.64 — — 0.49 0.88 — — — — — — — — — —

Filed figures

Figure Sep 2016 Sep 2017 Sep 2018 Sep 2019 Sep 2020 Sep 2021 Sep 2022 Sep 2023 Sep 2024 Sep 2025
Balance sheet detail
Trade receivables (USD) 25.2M 25.9M 28M 23.2M 23.2M 19.9M 16.5M 20.2M 17.3M 16.1M
↳ YoY growth -30.2% +2.9% +8.1% -17.3% +0.3% -14.3% -17.1% +22.3% -14.5% -6.8%
↳ 5y CAGR +3.9% +2.1% +2.4% -2.2% -8.4% -4.6% -8.6% -6.3% -5.7% -7.1%
Borrowings, current (USD) 31M 26.1M 27.2M 21.3M 20M 18.5M 15.5M 20.1M 44.1M 7.97M
Borrowings, non-current (USD) 7.62M 5.15M 2.33M 2.05M 4.61M 2.67M 3.51M 2.46M 0.00 51,000
Lease liabilities (USD) — — — 18.1M 17.3M 16.2M 15.8M 15M 13.9M 13.3M
Cash and deposits (USD) 471,000 1.4M 1.25M 341,000 427,000 346,000 1.17M 368,000 1.71M 491,000
Intangible assets (USD) 11.1M 6.81M 5.08M 3.32M 1.89M 874,000 477,000 278,000 — —
Right-of-use assets (USD) — — — 18.1M 17M 15.9M 15.2M 14.4M 13.3M 12.5M
Net debt (borrowings + leases - cash) (USD) 38.2M 29.9M 28.3M 23M 41.5M 37.1M 33.6M 37.2M 56.3M 20.8M
Cash flow detail
Operating cash flow (USD) 12.3M 12M 1.3M 5.73M 449,000 3.89M 298,000 -1.36M -2.65M 127,000
Purchases of property, plant and equipment (USD) -2.35M -2.34M -2.83M -9.45M -9.03M -4.98M -3.2M -2.45M -1.99M -484,000
Change in receivables (cash effect) (USD) 10.9M -294,000 -2.16M 4.51M 251,000 3.24M 2.63M -3.3M -1.63M 1.17M
Change in inventories (cash effect) (USD) -314,000 8.09M 1.48M 1.03M -4.65M 2.04M 443,000 1.87M -2.97M -1.38M
Change in payables (cash effect) (USD) 424,000 -2.32M 2.71M 2.05M -7.06M -4.44M 808,000 2.58M 1.46M -6.05M
Dividends paid (cash effect) (USD) 0.00 — — — — — — — — —
Share buybacks (cash effect) (USD) — — 0.00 -62,000 0.00 — — — — —
Interest paid (cash effect) (USD) -1.42M -1.56M -1.42M -952,000 -692,000 -397,000 -585,000 -1.32M -1.47M -1.87M
Income taxes paid (cash effect) (USD) -2.9M -1.34M 99,000 -123,000 -52,000 -62,000 -19,000 -16,000 -19,000 -16,000
Operating cash flow before change in receivables (USD) 1.39M 12.3M 3.46M 1.22M 198,000 648,000 -2.34M 1.94M -1.01M -1.04M
Free cash flow (OCF - PPE - intangibles) (USD) 9.93M 9.66M -1.54M -3.72M -8.58M -1.09M -2.9M -3.82M -4.64M -357,000
Income detail
Research and development expense (USD) 0.00 0.00 0.00 0.00 — — — — 0.00 0.00
Total comprehensive income (USD) -12.2M -10.6M -6.55M -12.2M 9.03M 3.65M -9.25M -6.66M -4.11M 6.32M
Comprehensive income to owners (USD) -12.2M -10.6M -6.55M -12.2M 9.03M 3.65M -9.25M -6.66M -4.11M 6.32M
Provision for credit losses (USD) 359,000 77,000 415,000 39,000 80,000 -91,000 -3,000 143,000 90,000 102,000
Credit cost ratio (credit losses / average receivables) (%) 1.2% 0.3% 1.5% 0.2% 0.3% 0.4% 0.0% 0.8% 0.5% 0.6%
Reported Dec 6, 2016 Dec 20, 2017 Dec 16, 2019 Feb 18, 2020 Dec 23, 2020 Dec 10, 2021 Dec 23, 2022 Jan 2, 2024 Dec 22, 2025 Dec 22, 2025

Sign up to see institutional holdings

Sign Up

Podcast Mentions

Sign up to see podcast mentions and sentiment

Sign Up

  1. Home

  2. Investor Relations

  3. News

  4. SIFCO Industries, Inc. (“SIFCO”) Announces Third Quarter and First Nine Months of Fiscal 2026 Financial Results

Next

SIFCO Industries, Inc. (“SIFCO”) Announces Third Quarter and First Nine Months of Fiscal 2026 Financial Results

Cleveland — SIFCO Industries, Inc. (NYSE American: SIF) today announced financial results for its third quarter and first nine months of fiscal 2026, which ended June 30, 2026.

Third Quarter Results

  • Net sales in the third quarter of fiscal 2026 increased 3% to $26.1 million, compared with $22.1 million for the same period in fiscal 2025.
  • Net loss from continuing operations for the third quarter of fiscal 2026 was nominal, or $(0.01) per diluted share, compared with $3.3 million, or $0.54 per diluted share, in the third quarter of fiscal 2025. Results from discontinued operations for the third quarter of fiscal 2026 was $0.0 million, or $0.00 per diluted share, compared with net income from discontinued operations of $0.1 million, or $0.02 per diluted share, in the third quarter of fiscal 2025. Included within the third quarter results is a $3.2 million impact to LIFO expense resulting from higher inventory costs and increased purchases.
  • EBITDA was $1.3 million in the third quarter of fiscal 2026, compared with $5.3 million in the third quarter of fiscal 2025. Prior year third quarter 2025 EBITDA included a net benefit of $2.7 million related to the Employee Retention Credit (“ERC”).
  • Adjusted EBITDA in the third quarter of fiscal 2026 was $4.8 million, compared with Adjusted EBITDA of $4.4 million in the third quarter of fiscal 2025. Prior year third quarter 2025 Adjusted EBITDA included a net benefit of $2.2 million related to the ERC.

First Nine Months Results

  • Net sales in the first nine months of fiscal 2026 increased 5% to $76.6 million, compared with $62.0 million for the same period in fiscal 2025.
  • Net income from continuing operations for the first nine months of fiscal 2026 was $4.4 million, or $0.71 per diluted share, compared with net loss of $0.4 million, or $(0.07) per diluted share, in the first nine months of fiscal 2025. There was no results from discontinued operations for the first nine months of fiscal 2026, compared with net income from discontinued operations of $0.1 million, or $0.02 per diluted share, in the first nine months of fiscal 2025.
  • EBITDA was $8.6 million in the first nine months of fiscal 2026, compared with $4.9 million in the first nine months of fiscal 2025.
  • Adjusted EBITDA in the first nine months of fiscal 2026 was $13.5 million, compared with Adjusted EBITDA of $4.0 million in the first nine months of fiscal 2025.

Other Highlights

“Our employees are proud of their contribution to the Company’s third quarter results. Their commitment to delivering high-quality products remains a key strength of our business. While availability of skilled production labor continues to present challenges, we have recently seen greater success in recruiting and retaining personnel. Our production teams remain focused on process improvements designed to increase throughput and productivity without compromising quality. We remain committed to our strategic focus on operational excellence. Customer demand remains strong, and our backlog provides continued visibility to future activity. We are focused on converting demand into profitable growth while continuing to improve operational performance,” said CEO, George Scherff.

Use of Non-GAAP Financial Measures

The Company uses certain non-GAAP measures in this release. EBITDA and Adjusted EBITDA are non-GAAP financial measures and are intended to serve as supplements to results provided in accordance with accounting principles generally accepted in the United States. SIFCO Industries, Inc. believes that such information provides an additional measurement and consistent historical comparison of the Company’s performance. A reconciliation of the non-GAAP financial measures to the most directly comparable GAAP measures is available set forth in the financial statements that accompany this release.

Forward-Looking Language

Certain statements contained in this press release are “forward-looking statements” within the meaning of the Private Securities Litigation Reform Act of 1995, such as statements relating to financial results and plans for future business development activities, and are thus prospective. Such forward-looking statements are subject to risks, uncertainties and other factors, which could cause actual results to differ materially from future results expressed or implied by such forward-looking statements.  Potential risks and uncertainties include, but are not limited to, economic conditions, competition and other uncertainties the Company, its customers, and the industry in which they operate have experienced and continue to experience, detailed from time to time in the Company’s Securities and Exchange Commission filings. For a discussion of such risk factors and uncertainties, see Item 1A, “Risk Factors” in the Company’s Annual Report on Form 10-K for the year ended September 30, 2025 and other reports filed by the Company with the Securities & Exchange Commission.

The Company’s Form 10-K for the year ended September 30, 2025 and other reports filed with the Securities & Exchange Commission can be accessed through the Company’s website: www.sifco.com, or on the Securities and Exchange Commission’s website: www.sec.gov.

SIFCO Industries, Inc. is engaged in the production of forgings and machined components primarily for the aerospace and energy markets. The processes and services include forging, heat-treating, coating, and machining.

Non-GAAP Financial Measures

Presented below is certain financial information based on the Company’s EBITDA and Adjusted EBITDA. References to “EBITDA” mean earnings (losses) from continuing operations before interest, taxes, depreciation and amortization, and references to “Adjusted EBITDA” mean EBITDA plus, as applicable for each relevant period, certain adjustments as set forth in the reconciliations of net income to EBITDA and Adjusted EBITDA.

Neither EBITDA nor Adjusted EBITDA is a measurement of financial performance under generally accepted accounting principles in the United States of America (“GAAP”). The Company presents EBITDA and Adjusted EBITDA because management believes that they are useful indicators for evaluating operating performance, including the Company’s ability to incur and service debt and it uses EBITDA to evaluate prospective acquisitions. Although the Company uses EBITDA and Adjusted EBITDA for the reasons noted above, the use of these non-GAAP financial measures as analytical tools has limitations. Therefore, reviewers of the Company’s financial information should not consider them in isolation, or as a substitute for analysis of the Company’s results of operations as reported in accordance with GAAP. Some of these limitations include:

  • Neither EBITDA nor Adjusted EBITDA reflects the interest expense or the cash requirements necessary to service interest payments on indebtedness;
  • Although depreciation and amortization are non-cash charges, the assets being depreciated and amortized will often have to be replaced in the future, and neither EBITDA nor Adjusted EBITDA reflects any cash requirements for such replacements;
  • The omission of the amortization expense associated with the Company’s intangible assets further limits the usefulness of EBITDA and Adjusted EBITDA; and
  • Neither EBITDA nor Adjusted EBITDA includes the payment of taxes, which is a necessary element of operations.

Because of these limitations, EBITDA and Adjusted EBITDA should not be considered as measures of discretionary cash available to the Company to invest in the growth of its businesses. Management compensates for these limitations by not viewing EBITDA or Adjusted EBITDA in isolation and specifically by using other GAAP measures, such as net income (loss), net sales, and operating income (loss), to measure operating performance. Neither EBITDA nor Adjusted EBITDA is a measurement of financial performance under GAAP, and neither should be considered as an alternative to net income (loss) or cash flow from operations determined in accordance with GAAP. The Company’s calculation of EBITDA and Adjusted EBITDA may not be comparable to the calculation of similarly titled measures reported by other companies.

The following table sets forth a reconciliation of net income (loss) to EBITDA and Adjusted EBITDA:

  • Represents the gain or loss from changes in the exchange rates between the functional currency and the foreign currency in which the transaction is denominated.
  • Represents miscellaneous non-operating income or expense, such as pension costs and other income from ERC in the prior period.
  • Represents the difference between the proceeds from the sale of operating equipment and the carrying value shown on the Company’s books.
  • Represents the equity-based compensation expense recognized by the Company under the 2016 Plan due to granting of awards, awards not vesting and/or forfeitures and executive severance.
  • Represents credits related to transaction-related legal fees incurred primarily in connection with the unsuccessful attempt in which the Company was the acquisition target.
  • Represents the change in the reserve for inventories for which cost is determined using the last-in, first-out (“LIFO”) method.
  • Represents non-recurring consulting and advisory expenses.

Reference to the above activities can be found in the consolidated financial statements included in Item 8 of the Company’s Annual Report on Form 10-K.

______________________________________________________________
  1. Home

  2. Investor Relations

  3. News

  4. SIFCO Industries, Inc. (“SIFCO”) Announces Second Quarter and First Half of Fiscal 2026 Financial Results

Previous Next

SIFCO Industries, Inc. (“SIFCO”) Announces Second Quarter and First Half of Fiscal 2026 Financial Results

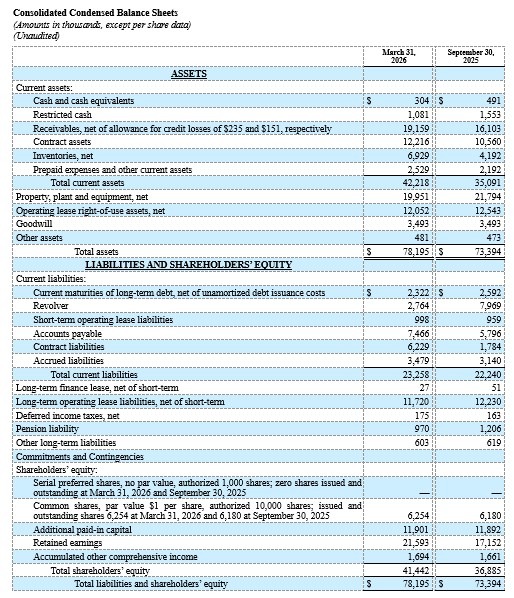
Cleveland — SIFCO Industries, Inc. (NYSE American: SIF) today announced financial results for its second quarter and first half of fiscal 2026, which ended March 31, 2026.

Second Quarter Results

  • Net sales in the second quarter of fiscal 2026 increased 39.0% to $26.4 million, compared with $19.0 million for the same period in fiscal 2025.

  • Net income from continuing operations for the second quarter of fiscal 2026 was $2.7 million, or $0.43 per diluted share, compared with net loss of $1.3 million, or $(0.22) per diluted share, in the second quarter of fiscal 2025. Results from discontinued operations for the second quarter of fiscal 2026 was $0.0 million, or $0.00 per diluted share, compared with net loss from discontinued operations of $0.1 million, or $(0.01) per diluted share, in the second quarter of fiscal 2025.

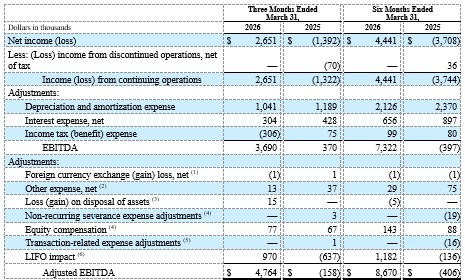
  • EBITDA was $3.7 million in the second quarter of fiscal 2026, compared with $0.4 million in the second quarter of fiscal 2025.

  • Adjusted EBITDA in the second quarter of fiscal 2026 was $4.8 million, compared with Adjusted EBITDA of $(0.2) million in the second quarter of fiscal 2025.

First half Results

  • Net sales in the first six months of fiscal 2026 increased 26.3% to $50.4 million, compared with $39.9 million for the same period in fiscal 2025.

  • Net income from continuing operations for the first six months of fiscal 2026 was $4.4 million, or $0.72 per diluted share, compared with net loss of $3.7 million, or $(0.62) per diluted share, in the first six months of fiscal 2025. There was no results from discontinued operations for the first six months of fiscal 2026, compared with nominal net income from discontinued operations, or $0.01 per diluted share, in the first six months of fiscal 2025.

  • EBITDA was $7.3 million in the first six months of fiscal 2026, compared with $(0.4) million in the first six months of fiscal 2025.

  • Adjusted EBITDA in the first six months of fiscal 2026 was $8.7 million, compared with Adjusted EBITDA of $(0.4) million in the first six months of fiscal 2025.

Other Highlights

“Management’s continued focus on engineering, quality, and continuous improvement is driving meaningful gains in efficiency, cost control, and throughput. While labor availability for skilled roles remains a constraint, recent hiring, training, and retention initiatives are improving workforce stability and supporting operational progress. Despite ongoing global uncertainty, demand for our products remains strong, driving growth in SIFCO’s backlog.”

Use of Non-GAAP Financial Measures

The Company uses certain non-GAAP measures in this release. EBITDA and Adjusted EBITDA are non-GAAP financial measures and are intended to serve as supplements to results provided in accordance with accounting principles generally accepted in the United States. SIFCO Industries, Inc. believes that such information provides an additional measurement and consistent historical comparison of the Company’s performance. A reconciliation of the non-GAAP financial measures to the most directly comparable GAAP measures is available in this news release.

Forward-Looking Language

Certain statements contained in this press release are “forward-looking statements” within the meaning of the Private Securities Litigation Reform Act of 1995, such as statements relating to financial results and plans for future business development activities, and are thus prospective. Such forward-looking statements are subject to risks, uncertainties and other factors, which could cause actual results to differ materially from future results expressed or implied by such forward-looking statements.  Potential risks and uncertainties include, but are not limited to, economic conditions, competition and other uncertainties the Company, its customers, and the industry in which they operate have experienced and continue to experience, detailed from time to time in the Company’s Securities and Exchange Commission filings. For a discussion of such risk factors and uncertainties, see Item 1A, “Risk Factors” in the Company’s Annual Report on Form 10-K for the year ended September 30, 2025 and other reports filed by the Company with the Securities & Exchange Commission.

The Company’s Form 10-K for the year ended September 30, 2025 and other reports filed with the Securities & Exchange Commission can be accessed through the Company’s website: www.sifco.com, or on the Securities and Exchange Commission’s website: www.sec.gov.

SIFCO Industries, Inc. is engaged in the production of forgings and machined components primarily for the aerospace and energy markets. The processes and services include forging, heat-treating, coating, and machining.

Non-GAAP Financial Measures

Presented below is certain financial information based on the Company’s EBITDA and Adjusted EBITDA. References to “EBITDA” mean earnings (losses) from continuing operations before interest, taxes, depreciation and amortization, and references to “Adjusted EBITDA” mean EBITDA plus, as applicable for each relevant period, certain adjustments as set forth in the reconciliations of net income to EBITDA and Adjusted EBITDA.

Neither EBITDA nor Adjusted EBITDA is a measurement of financial performance under generally accepted accounting principles in the United States of America (“GAAP”). The Company presents EBITDA and Adjusted EBITDA because management believes that they are useful indicators for evaluating operating performance, including the Company’s ability to incur and service debt and it uses EBITDA to evaluate prospective acquisitions. Although the Company uses EBITDA and Adjusted EBITDA for the reasons noted above, the use of these non-GAAP financial measures as analytical tools has limitations. Therefore, reviewers of the Company’s financial information should not consider them in isolation, or as a substitute for analysis of the Company’s results of operations as reported in accordance with GAAP. Some of these limitations include:

  • Neither EBITDA nor Adjusted EBITDA reflects the interest expense or the cash requirements necessary to service interest payments on indebtedness;
  • Although depreciation and amortization are non-cash charges, the assets being depreciated and amortized will often have to be replaced in the future, and neither EBITDA nor Adjusted EBITDA reflects any cash requirements for such replacements;
  • The omission of the amortization expense associated with the Company’s intangible assets further limits the usefulness of EBITDA and Adjusted EBITDA; and
  • Neither EBITDA nor Adjusted EBITDA includes the payment of taxes, which is a necessary element of operations.

Because of these limitations, EBITDA and Adjusted EBITDA should not be considered as measures of discretionary cash available to the Company to invest in the growth of its businesses. Management compensates for these limitations by not viewing EBITDA or Adjusted EBITDA in isolation and specifically by using other GAAP measures, such as net income (loss), net sales, and operating income (loss), to measure operating performance. Neither EBITDA nor Adjusted EBITDA is a measurement of financial performance under GAAP, and neither should be considered as an alternative to net income (loss) or cash flow from operations determined in accordance with GAAP. The Company’s calculation of EBITDA and Adjusted EBITDA may not be comparable to the calculation of similarly titled measures reported by other companies.

The following table sets forth a reconciliation of net income (loss) to EBITDA and Adjusted EBITDA:

  1. Represents the gain or loss from changes in the exchange rates between the functional currency and the foreign currency in which the transaction is denominated.
  2. Represents miscellaneous non-operating income or expense, such as pension costs, transaction related expense adjustments, and severance.
  3. Represents the difference between the proceeds from the sale of operating equipment and the carrying value shown on the Company’s books.
  4. Represents the equity-based compensation expense recognized by the Company under the 2016 Plan due to granting of awards, awards not vesting and/or forfeitures and executive severance.
  5. Represents credits related to transaction-related legal fees incurred primarily in connection with the unsuccessful attempt in which the Company was the acquisition target.
  6. Represents the change in the reserve for inventories for which cost is determined using the last-in, first-out (“LIFO”) method.

Reference to the above activities can be found in the consolidated financial statements included in Item 8 of the Company’s Annual Report on Form 10-K.

_________________________________________________________________
  1. Home

  2. Investor Relations

  3. News

  4. SIFCO Industries, Inc. (“SIFCO”) Announces First Quarter Fiscal 2026 Financial Results

Previous Next

SIFCO Industries, Inc. (“SIFCO”) Announces First Quarter Fiscal 2026 Financial Results

Cleveland — SIFCO Industries, Inc. (NYSE American: SIF) today announced financial results for its first quarter of fiscal 2026, which ended December 31, 2025.

First Quarter Results

  • Net sales in the first quarter of fiscal 2026 increased 8% to $24.0 million, compared with $20.9 million for the same period in fiscal 2025.
  • Net income from continuing operations for the first quarter of fiscal 2026 was $1.8 million, or $0.29 per diluted share, compared with net loss of $2.4 million, or $(0.40) per diluted share, in the first quarter of fiscal 2025. Results from discontinued operations for the first quarter of fiscal 2026 was $0.0 million, or $0.00 per diluted share, compared with net income from discontinued operations of $0.1 million, or $0.02 per diluted share, in the first quarter of fiscal 2025.
  • EBITDA was $3.6 million in the first quarter of fiscal 2026, compared with $(0.8) million in the first quarter of fiscal 2025.
  • Adjusted EBITDA in the first quarter of fiscal 2026 was $3.9 million, compared with Adjusted EBITDA of $(0.2) million in the first quarter of fiscal 2025.

Other Highlights

“SIFCO reported favorable results for the first quarter ending December 31, 2025. SIFCO provides engineered, high-quality forgings primarily for the commercial and military aerospace industries. Management indicated that increased production throughput and lower fixed costs were the main drivers of improved financial performance for the quarter. Strong demand continues for SIFCO’s products and the order backlog remains stable in both commercial and defense end markets.”

Use of Non-GAAP Financial Measures

The Company uses certain non-GAAP measures in this release. EBITDA and Adjusted EBITDA are non-GAAP financial measures and are intended to serve as supplements to results provided in accordance with accounting principles generally accepted in the United States. SIFCO Industries, Inc. believes that such information provides an additional measurement and consistent historical comparison of the Company’s performance. A reconciliation of the non-GAAP financial measures to the most directly comparable GAAP measures is available in this news release.

Forward-Looking Language

Certain statements contained in this press release are “forward-looking statements” within the meaning of the Private Securities Litigation Reform Act of 1995, such as statements relating to financial results and plans for future business development activities, and are thus prospective. Such forward-looking statements are subject to risks, uncertainties and other factors, which could cause actual results to differ materially from future results expressed or implied by such forward-looking statements.  Potential risks and uncertainties include, but are not limited to, economic conditions, concerns with or threats of, or the consequences of, pandemics, contagious diseases or health epidemics, competition and other uncertainties the Company, its customers, and the industry in which they operate have experienced and continue to experience, detailed from time to time in the Company’s Securities and Exchange Commission filings. For a discussion of such risk factors and uncertainties, see Item 1A, “Risk Factors” in the Company’s Annual Report on Form 10-K for the year ended September 30, 2025 and other reports filed by the Company with the Securities & Exchange Commission.

The Company’s Form 10-K for the year ended September 30, 2025 and other reports filed with the Securities & Exchange Commission can be accessed through the Company’s website: www.sifco.com, or on the Securities and Exchange Commission’s website: www.sec.gov.

SIFCO Industries, Inc. is engaged in the production of forgings and machined components primarily for the aerospace and energy markets. The processes and services include forging, heat-treating, coating, and machining.

Non-GAAP Financial Measures

Presented below is certain financial information based on the Company’s EBITDA and Adjusted EBITDA. References to “EBITDA” mean earnings (losses) from continuing operations before interest, taxes, depreciation and amortization, and references to “Adjusted EBITDA” mean EBITDA plus, as applicable for each relevant period, certain adjustments as set forth in the reconciliations of net income to EBITDA and Adjusted EBITDA.

Neither EBITDA nor Adjusted EBITDA is a measurement of financial performance under generally accepted accounting principles in the United States of America (“GAAP”). The Company presents EBITDA and Adjusted EBITDA because management believes that they are useful indicators for evaluating operating performance, including the Company’s ability to incur and service debt and it uses EBITDA to evaluate prospective acquisitions. Although the Company uses EBITDA and Adjusted EBITDA for the reasons noted above, the use of these non-GAAP financial measures as analytical tools has limitations. Therefore, reviewers of the Company’s financial information should not consider them in isolation, or as a substitute for analysis of the Company’s results of operations as reported in accordance with GAAP. Some of these limitations include:

  • Neither EBITDA nor Adjusted EBITDA reflects the interest expense or the cash requirements necessary to service interest payments on indebtedness;
  • Although depreciation and amortization are non-cash charges, the assets being depreciated and amortized will often have to be replaced in the future, and neither EBITDA nor Adjusted EBITDA reflects any cash requirements for such replacements;
  • The omission of the amortization expense associated with the Company’s intangible assets further limits the usefulness of EBITDA and Adjusted EBITDA; and
  • Neither EBITDA nor Adjusted EBITDA includes the payment of taxes, which is a necessary element of operations.

Because of these limitations, EBITDA and Adjusted EBITDA should not be considered as measures of discretionary cash available to the Company to invest in the growth of its businesses. Management compensates for these limitations by not viewing EBITDA or Adjusted EBITDA in isolation and specifically by using other GAAP measures, such as net income (loss), net sales, and operating income (loss), to measure operating performance. Neither EBITDA nor Adjusted EBITDA is a measurement of financial performance under GAAP, and neither should be considered as an alternative to net loss or cash flow from operations determined in accordance with GAAP. The Company’s calculation of EBITDA and Adjusted EBITDA may not be comparable to the calculation of similarly titled measures reported by other companies.

The following table sets forth a reconciliation of net income (loss) to EBITDA and Adjusted EBITDA:

(1)  Represents the gain or loss from changes in the exchange rates between the functional currency and the foreign currency in which the transaction is denominated.

(2)  Represents miscellaneous non-operating income or expense, such as pension costs.

(3)  Represents the difference between the proceeds from the sale of operating equipment and the carrying value shown on the Company’s books.

(4)  Represents the equity-based compensation expense recognized by the Company under the 2016 Plan due to granting of awards, awards not vesting and/or forfeitures and executive severance.

(5)  Represents credits related to transaction-related legal fees incurred primarily in connection with the unsuccessful attempt in which the Company was the acquisition target.

(6)  Represents the change in the reserve for inventories for which cost is determined using the last-in, first-out (“LIFO”) method.

Reference to the above activities can be found in the consolidated financial statements included in Item 8 of the Company’s Annual Report on Form 10-K.

____________________________________________________________________________

Prompts

SIFCO Industries, Inc. (ticker SIF), listed in United States.

ETFs Holding SIFCO Industries, Inc.

ETF Weight in ETF Shares Market value As of
DFSV 0.00% 49,091 $ 825.22K Nov 12, 2026
DXUV 0.00% 4,888 $ 82.167K Nov 12, 2026
DFAS 0.00% 20,327 $ 341.697K Nov 12, 2026
DFUV 0.00% 4,527 $ 76.099K Nov 12, 2026
DFAT 0.00% 3,474 $ 58.398K Nov 12, 2026
DFAC 0.00% 7,554 $ 126.983K Nov 12, 2026
DCOR 0.00% 3,799 $ 63.861K Nov 12, 2026
DFSU 0.00% 4 $ 67.24 Nov 12, 2026
AVSC 0.00% 6,327 $ 93.26K Nov 16, 2026
BSVO 0.00% 7,246 $ 100K Nov 18, 2026