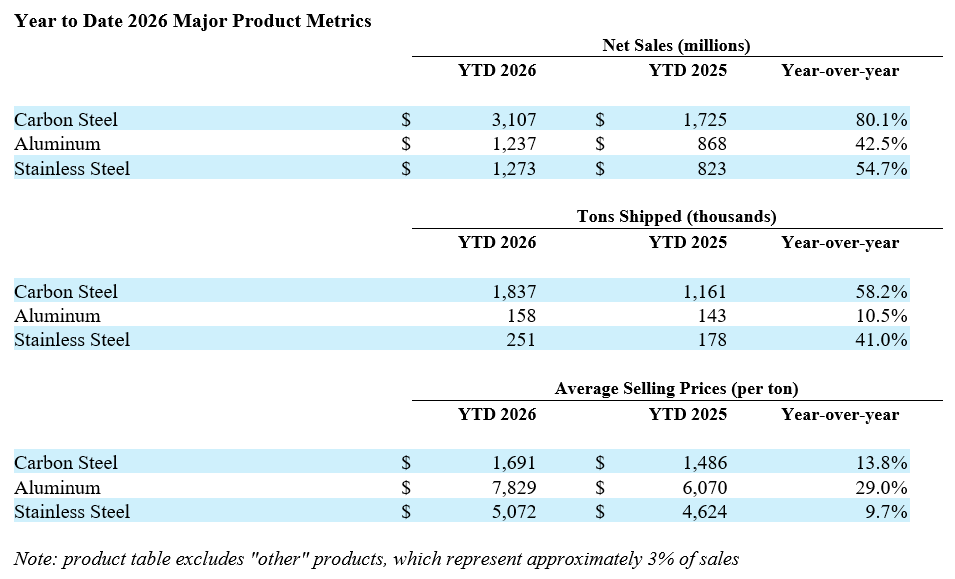
Ryerson Holding Corporation is a value-added processor and distributor of industrial metals operating across North America and China. The company serves customers in the United States through Joseph T. Ryerson & Son, Inc., in Canada through Ryerson Canada, Inc., in Mexico through Ryerson Metals de Mexico, S. de R.L. de C.V., and in China through Ryerson China Limited. Ryerson distributes stainless steel, aluminum, carbon steel, alloy steels, nickel, and red metals in various shapes and forms. It provides value-added processing and fabrication services, with a significant portion of products processed to meet specific customer requirements. The company serves a diverse customer base ranging from local fabricators and machine shops to international original equipment manufacturers across sectors such as commercial transportation, machinery, consumer products, and renewable energy. Ryerson operates a network of service centers and utilizes a fleet of tractors and trailers for delivery. The company has completed strategic acquisitions, including Production Metals, LLC, BLP Holdings, LLC, Norlen Incorporated, TSA Processing, and Hudson Tool Steel Corporation. In 2026, Ryerson completed the merger with Olympic Steel, Inc., expanding its product offerings in carbon and coated sheet, plate, and coil products as well as pipe, tube, and fittings.

Summarised from the company's own disclosures, fiscal year ended Feb 2026

Industry Industrial Distribution Homepage ir.ryerson.com
Sector Industrials IR page ir.ryerson.com
Tags
metals service centers, stainless steel, aluminum, carbon steel, alloy steels, nickel, red metals, value-added processing, fabrication services, industrial metals distribution, Joseph T. Ryerson & Son Inc., Ryerson Canada Inc., Ryerson Metals de Mexico S. de R.L. de C.V., Ryerson China Limited, Olympic Steel Inc., Production Metals LLC, BLP Holdings LLC, Norlen Incorporated, TSA Processing, Hudson Tool Steel Corporation
Press page —

Metrics

Valuation  
Market cap $ 1.637B
Market cap (USD) $ 1.637B
P/E -186.24
PEG —
P/BV 1.25
P/S 0.24
P/OCF -25.86
P/FCF -12.23
Dividend yield 2.4%
Turnover / mcap —
Returns  
ROE -7.2%
ROI -7.5%
ROIC -3.1%
Profit margin -1.2%
Growth  
Revenue growing No
Profits growing No
Revenue up 3y No
Revenue up 5y No
Earnings growth 3y (net profit CAGR) —
Quality  
Profitable No
Margin expanding No
Buying back stock No
Diluting (TTM) Yes
Debt/Equity —
Podcast bulls (TTM) Sign up
Podcast bears (TTM) Sign up
Podcast sentiment (TTM) Sign up
Podcast sentiment % (TTM) Sign up
News sentiment (TTM) 23
Quality score -50.0%
Insiders  
Buys, 1w Sign up
Buys, 1m Sign up
Buys, 1y Sign up
Sells, 1w Sign up
Sells, 1m Sign up
Sells, 1y Sign up

Sign up to see this company's insider trades

Figure FY 2025 FY 2024 FY 2023 FY 2022 FY 2021 FY 2020 FY 2019 FY 2018 FY 2017 FY 2016 FY 2015 FY 2014 FY 2013 FY 2011 FY 2010 FY 2009
Revenue 4.571B 4.599B 5.109B 6.324B 5.675B 3.467B 4.502B 4.408B 3.365B 2.86B 3.167B 3.622B 3.46B 4.73B 3.896B 3.066B
Net profit -56.4M -8.6M 145.7M 391M 294.3M -65.8M 82.4M 106M 17.1M 18.7M -500K -25.7M 127.3M -8.1M -104M -190.7M
Free cash flow 35.5M 105.3M 243.2M 396.1M -24.3M 251.9M 147.3M 19M -27.2M 2.4M 236.8M -94.9M 27.9M 7.5M -225.7M 262.1M

Figure FY 2025 FY 2024 FY 2023 FY 2022 FY 2021 FY 2020 FY 2019 FY 2018 FY 2017 FY 2016 FY 2015 FY 2014 FY 2013 FY 2011 FY 2010 FY 2009
Share price 25.16 18.51 34.68 30.26 26.05 13.64 11.83 6.34 10.4 13.35 4.67 9.93 — — — —
Price performance 12m 0.36 -0.47 0.15 0.16 0.91 0.15 0.87 -0.39 -0.22 1.86 -0.53 — — — — —

Filed figures

Figure Dec 2016 Dec 2017 Dec 2018 Dec 2019 Dec 2020 Dec 2021 Dec 2022 Dec 2023 Dec 2024 Dec 2025
Balance sheet detail
Trade receivables (USD) 326M 376M 521M 425M 379M 631M 514M 468M 426M 461M
↳ YoY growth +6.6% +15.4% +38.5% -18.4% -10.9% +66.5% -18.5% -9.1% -9.0% +8.3%
↳ 5y CAGR -8.7% +6.4% +1.2% +4.4% +14.1% +6.5% -2.1% +0.0% +4.0%
Borrowings, current (USD) 19.2M 21.3M 27.3M 49.2M 13.8M 28.8M 5.8M 8.2M 700,000 1.9M
Borrowings, non-current (USD) 944M 1.02B 1.13B 933M 726M 611M — — — —
Lease liabilities (USD) — — — 165M 137M 238M 259M 385M 383M 369M
Cash and deposits (USD) 80.7M 77.4M 23.2M 11M 61.4M 51.2M 39.2M 54.3M 27.7M 26.9M
Intangible assets (USD) 40.8M 46.9M 58.1M 50.6M 43.2M 42.2M 50.9M 73.7M 68.3M 58.2M
Right-of-use assets (USD) — — — 128M 108M 211M 241M 349M 345M 324M
Net debt (borrowings + leases - cash) (USD) 883M 968M 1.13B 1.14B 816M 826M 226M 339M 356M 344M
Cash flow detail
Operating cash flow (USD) 25.4M -2.1M 57.4M 193M 278M 35M 501M 365M 205M 87M
Purchases of property, plant and equipment (USD) -23M -25.1M -38.4M -45.8M -26M -59.3M -105M -122M -99.6M -51.5M
Change in receivables (cash effect) (USD) -22.5M -44M -64.8M 92.5M 46.7M -253M 127M 67.9M 40M -35M
Change in inventories (cash effect) (USD) -6.5M -42.9M -21.4M 65.9M 139M -228M 39.9M 28.8M 120M 39.5M
Change in payables (cash effect) (USD) 20.5M 58.3M 58.4M -78.2M 25.8M 124M -72.1M 24.8M -5.6M 77.9M
Dividends paid (cash effect) (USD) — — — — — -6.4M -19.9M -24.8M -24.8M -24.1M
Share buybacks (cash effect) (USD) — — — — — -1.8M -50M -114M -51M 0.00
Interest paid (cash effect) (USD) -88.6M -84.9M -92.8M -88.3M -62M -51.1M -38.3M -29.9M -40.6M -41.2M
Income taxes paid (cash effect) (USD) -1.8M -1.7M -2.1M 6.6M 5.7M -70.2M -177M -6.2M -10.3M -5.7M
Share-based compensation (USD) 1.4M 2.2M 3.3M 3.1M 1.9M 5.5M 9.1M 13.8M 11.6M 8.7M
Operating cash flow before change in receivables (USD) 47.9M 41.9M 122M 101M 231M 288M 375M 297M 165M 122M
Free cash flow (OCF - PPE - intangibles) (USD) 2.4M -27.2M 19M 147M 252M -24.3M 396M 243M 105M 35.5M
Income detail
Total comprehensive income (USD) 18.2M 39.7M 77.9M 96.6M -35.2M 402M 412M 151M -21.2M -43M
Comprehensive income to owners (USD) 17.9M 38.6M 77.5M 96.2M -35.7M 401M 412M 150M -22.4M -44.3M
Provision for credit losses (USD) 3.1M 1.5M 3.7M — 300,000 1.4M 1.7M 1.2M 3.2M —
Credit cost ratio (credit losses / average receivables) (%) 1.0% 0.4% 0.8% — 0.1% 0.3% 0.3% 0.2% 0.7% —
Reported Mar 13, 2017 Mar 5, 2018 Mar 5, 2019 Mar 4, 2020 Feb 23, 2022 Feb 23, 2022 Feb 22, 2023 Feb 21, 2024 Feb 20, 2025 Feb 23, 2026

Sign up to see institutional holdings

Sign Up

Podcast Mentions

Sign up to see podcast mentions and sentiment

Sign Up

Ryerson Reports Third Quarter 2026 Results Bull 5 Bear 0 Results

Ryerson Quarter Results

Exceeded shipment, sales, and earnings guidance and eclipsed first-year annual run-rate synergy target ahead of schedule while generating market share gains, productivity gains, and higher book value per share alongside excellent net working capital management

CHICAGO – October 28, 2026 – Ryerson Holding Corporation (NYSE: RYZ), a leading value-added processor and distributor of industrial metals, today reported results for the third quarter ended September 30, 2026.

Highlights:

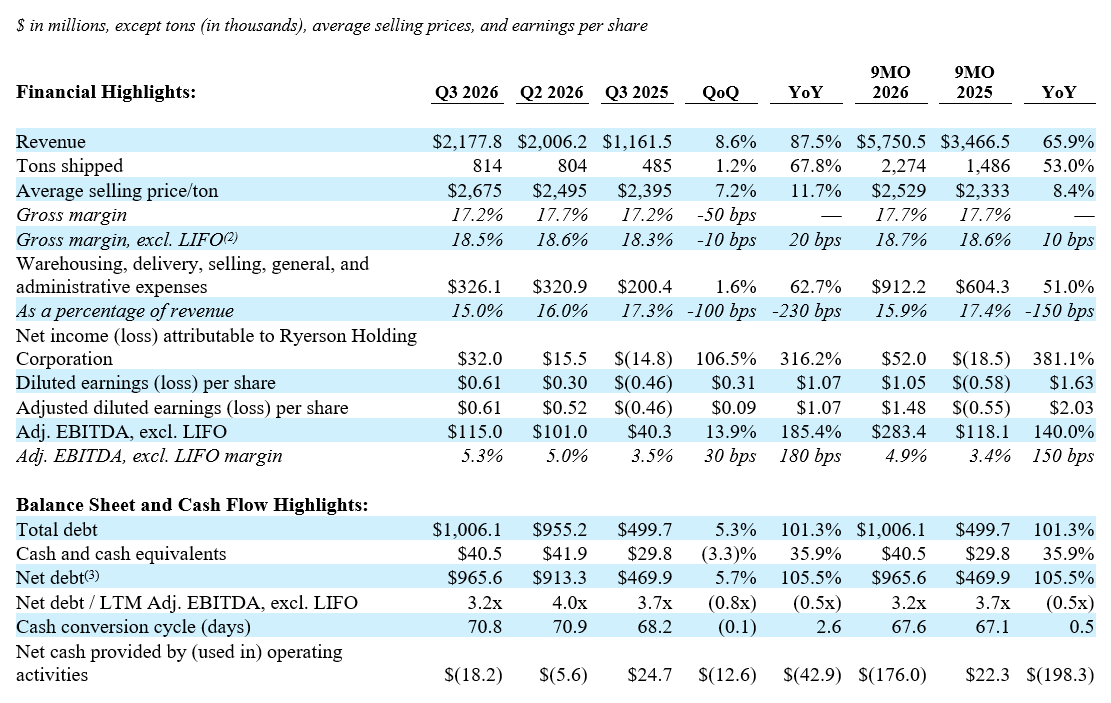
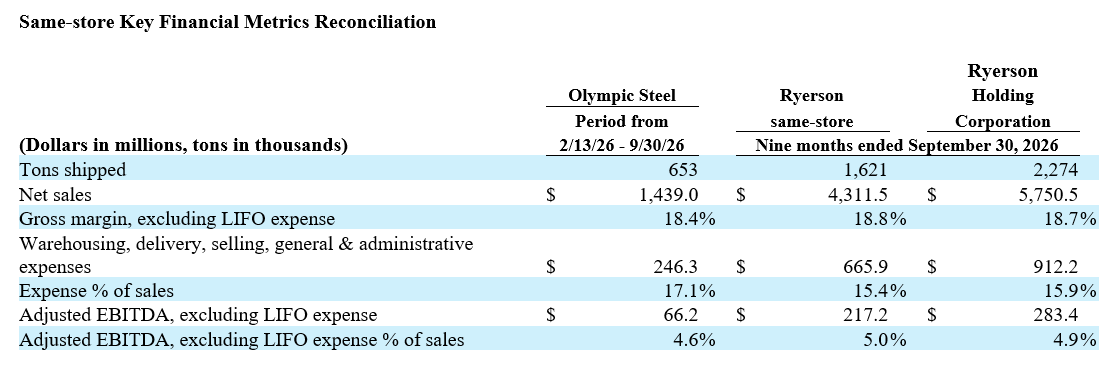
  • Generated total Company revenue of $2.18 billion in the third quarter, exceeding the previously provided guidance range with total tons shipped 1.2% higher and average selling prices 7.2% higher sequentially. Excluding Olympic Steel, which generated $602 million of revenue during the quarter, same-store revenue was $1.58 billion, with sequential average selling prices increasing by 7.3% and tons shipped increasing by 1.8% to reach their highest quarterly level in over five years.

  • Achieved total Company third quarter net income(1) of $32.0 million, or $0.61 per diluted share, and Adjusted EBITDA, excluding LIFO(2) of $115.0 million, exceeding guidance of $88 to $92 million. Olympic Steel contributed $30.2 million of Adjusted EBITDA, excluding LIFO, also exceeding guidance.

  • Realized approximately $13 million in third quarter synergy benefits, representing $52 million on an annualized, run-rate basis and substantially exceeding the $40 million first-year target months ahead of schedule.

  • Returned $13.6 million to stockholders during the quarter, comprised of $9.8 million in dividends and $3.8 million in share repurchases at prices below book value per share.
102826 Chart1

Management Commentary

Eddie Lehner, Ryerson’s Chief Executive Officer & Director, said, “Ryerson delivered an excellent third quarter, generating results above our guidance while eclipsing our first-year synergy run-rate target ahead of schedule. These simultaneous achievements reflect the resourcefulness, collaborative efforts, and passion of our teammates as our investments, commercial execution, and integration efforts came together to produce our best quarter of 2026. The strength we saw in daily shipment volumes and invoice counts defied normal industry seasonality, with AI infrastructure and power generation investment elevating overall demand through the quarter. I want to thank and recognize all of my RYZ colleagues for acting with shared purpose and empowering one another to create great customer experiences while translating the strengths of our combined enterprise into growth with greater earnings power. Two full quarters into the merger, our combined positive momentum continues to build further toward the formidable potential we believe our enterprise can realize in the quarters and years ahead.”

Rick Marabito, Ryerson’s President, Chief Operating Officer & Director added, “Resilient customer demand and strong execution across our expanded network drove our highest same-store quarterly shipments in more than five years. With industry inventories low and mill lead times extended, our greater scale and improving inventory visibility are helping our teams locate and share material, coordinate processing resources and meet customer needs across the combined enterprise. We are also aligning customer programs with the facilities best equipped to serve them, which is supporting higher asset utilization and a lower cost to serve while creating capacity for additional transactional business. Commercial synergies continue to exceed our expectations, and progress across our four synergy pillars reinforces our confidence in achieving our two-year target of $120 million in annual run-rate synergies. I want to thank our teams for putting our shared values of customer commitment, accountability and teamwork into action, delivering excellent customer experiences while building a stronger business for all our stakeholders.”

Third Quarter Results

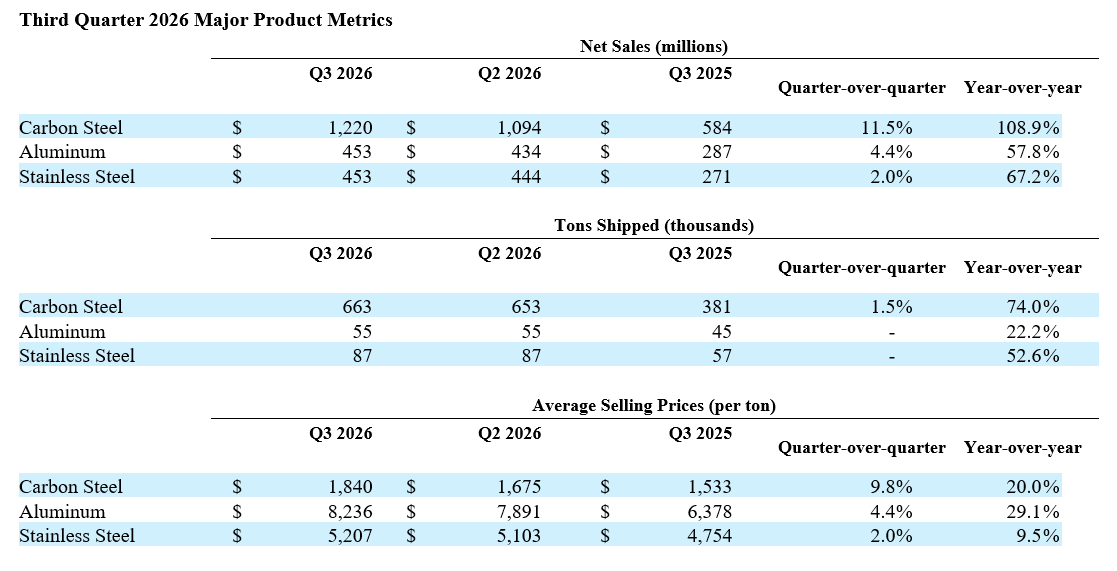
In the third quarter of 2026, Ryerson generated net sales of $2.18 billion, an increase of 8.6% compared to the previous quarter with total Company tons shipped 1.2% higher and average selling prices 7.2% higher quarter-over-quarter. Excluding Olympic Steel, which generated $602 million of revenue during the quarter, third quarter same-store net sales were $1.58 billion, an increase of 9.3% quarter-over-quarter with average selling prices 7.3% higher and tons sold 1.8% higher. Compared to the third quarter of 2025, same-store net sales increased by 35.7% with tons shipped 14.2% higher and average selling prices 18.7% higher. Third quarter demand was stronger than anticipated while carbon prices continued to rally at multi-year highs supported by trade policy, tight domestic supply, extended lead times, and multi-year lows in service center inventories. Prices for stainless products and aluminum products, in contrast, faced downward pressure due to the easing of nickel supply restrictions, leading to LME nickel price reversion, while aluminum prices remained volatile and trended lower as future supply expectations began to normalize later in the quarter.

Third quarter gross margin contracted by 50 basis points to 17.2%, compared to 17.7% in the prior quarter, as higher material costs flowed through ahead of corresponding price adjustments for program customers. Third quarter results also included a $4.0 million inventory purchase accounting charge to cost of materials sold, a decrease compared to the $15.7 million charge recorded in the second quarter, as we continued to sell through the inventory acquired in the Olympic Steel merger. Reflecting the rising price environment, third quarter LIFO expense was $30.0 million, compared to $17.0 million in the second quarter. Excluding both LIFO expense and purchase accounting adjustments, gross margin contracted by 60 basis points to 18.7%, compared to 19.3% in the second quarter of 2026.

Third quarter total Company warehousing, delivery, selling, general, and administrative expenses were $326.1 million, an increase of 1.6% compared to $320.9 million in the prior quarter, driven by variable compensation and producer inflationary cost pressures. Warehousing, selling, general, and administrative expenses as a percent of sales decreased to 15.0% from 16.0% in the second quarter and 17.3% in the third quarter of last year. On a per ton basis, these expenses were $401 in the third quarter compared with $399 in the second quarter and $413 in the year ago period.

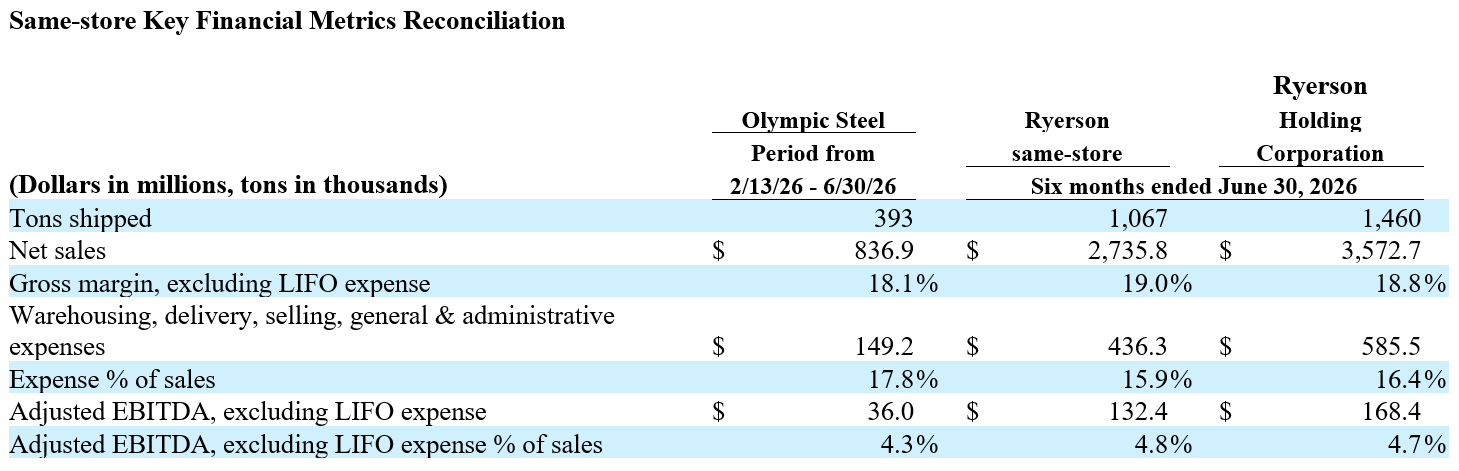
Net income attributable to Ryerson Holding Corporation for the third quarter of 2026 was $32.0 million, or $0.61 per diluted share, compared to net income of $15.5 million, or $0.30 per diluted share, for the previous quarter and net loss of $14.8 million, or $0.46 per diluted share, in the third quarter of 2025. After removing the impact of inventory purchase accounting adjustments, an insurance settlement gain, a litigation settlement gain, advisory service fees, and the related income tax effects of these items, Ryerson's third quarter Adjusted Net Income was $32.4 million, or $0.61 per diluted share. Adjusted EBITDA, excluding LIFO was $115.0 million in the third quarter of 2026 compared to $101.0 million in the second quarter of 2026 and $40.3 million in the year-ago period. On a same-store basis, excluding Olympic Steel's contributions, Ryerson generated Adjusted EBITDA, excluding LIFO of $84.8 million in the third quarter of 2026, compared to $77.5 million in the prior quarter.

Olympic Steel Integration & Financial Results

In the third quarter, Ryerson realized approximately $13 million of synergy benefits through procurement, efficiency, network optimization, and commercial enhancement actions, in-line with management's expectations. This represents synergy attainment of approximately $52 million on an annualized run-rate basis, substantially exceeding the Company’s $40 million first-year target well ahead of its February 2027 merger anniversary. In the fourth quarter, management expects to achieve synergy benefits in the range of $14 million to $15 million, which would bring the Company's cumulative realization to approximately $33 million to $34 million in 2026. One-time costs to achieve these synergies have totaled $2.6 million through the third quarter of this year. Given the early attainment of the Company's first-year synergy target and the momentum building across all four of its synergy pillars, management remains confident in achieving its $120 million two-year annualized run-rate synergy target.

Olympic Steel contributed $602.1 million of revenue and $30.2 million of Adjusted EBITDA, excluding LIFO to Ryerson’s third quarter results, exceeding management’s expectations of $21 million to $23 million in Adjusted EBITDA, excluding LIFO.

Liquidity & Debt Management

Ryerson used $18.2 million in cash from operations in the third quarter as net income generation was offset by higher working capital requirements. This compares to a use of cash from operating activities of $5.6 million in the second quarter of 2026. The Company ended the third quarter of 2026 with debt of $1.01 billion and net debt of $966 million, an increase of $51 million and $53 million, respectively, compared to the second quarter of 2026, driven by higher working capital requirements in support of revenue growth.

Global liquidity, composed of cash and cash equivalents and availability on its revolving credit facilities, increased to $865 million as of September 30, 2026 compared to $757 million as of June 30, 2026, reflective of the Company's increased borrowing base from higher working capital.

Stockholder Return Activity

Dividends. On October 28, 2026, the Board of Directors declared a quarterly cash dividend of $0.1875 per share of common stock, payable on December 17, 2026, to stockholders of record as of December 3, 2026. During the third quarter of 2026, Ryerson’s quarterly dividend was of the same amount and represented a total cash return to stockholders of $9.8 million.

Share Repurchases and Authorization. Ryerson returned $3.8 million to stockholders during the third quarter through the opportunistic repurchase of approximately 159,000 shares in the open market at an average price of $23.85 per share. Following these repurchases, the Company has $96.2 million remaining under its share repurchase authorization, which expires on April 30, 2028.

Outlook Commentary

In the fourth quarter of 2026, the Company expects that shipments will decline sequentially by 6% to 8% from third quarter levels, reflecting three fewer business days and holiday-related seasonal softness. Average selling prices are expected to be flat to up by 2% quarter-over-quarter as higher carbon pricing is expected to slightly offset relative softening in stainless and aluminum pricing. Net sales are therefore expected to be in the range of $1.96 billion to $2.04 billion. Net income generation for the fourth quarter of 2026 is expected to be in the range of $16 to $20 million, or $0.30 to $0.38 per diluted share, with LIFO expense between $28 and $32 million. Fourth quarter Adjusted EBITDA, excluding LIFO is expected to be in the range of $100 to $104 million, inclusive of Olympic Steel's expected contribution of $28 to $30 million.
102826 Chart2

102826 Chart3a

102826 Chart4

Earnings Call Information

Ryerson will host a conference call to discuss third quarter 2026 financial results for the period ended September 30, 2026, on Thursday, October 29, 2026, at 10 a.m. Eastern Time. The live online broadcast will be available on the Company’s investor relations website, ir.ryerson.com. A replay will be available at the same website for 90 days.

About Ryerson

Ryerson is a leading value-added processor and distributor of industrial metals, with operations in the United States, Canada, Mexico, and China. Founded in 1842, Ryerson, together with Olympic Steel, has approximately 6,500 employees and approximately 150 locations. Visit Ryerson at www.ryerson.com.

Notes:

(1) Net income attributable to Ryerson Holding Corporation

(2) For EBITDA, Adjusted EBITDA, Adjusted EBITDA, excluding LIFO and gross margin, excluding LIFO please see Schedule 2

(3) Net debt is defined as long term debt plus short term debt less cash and cash equivalents and excludes restricted cash

Legal Disclaimer The contents herein are provided for general information purposes only and do not constitute an offer to sell or purchase, or a solicitation of an offer to purchase, any security (“Security”) of the Company or its affiliates (“Ryerson”) in any jurisdiction. Ryerson does not intend to solicit, and is not soliciting, any action with respect to any Security or any other contractual relationship with Ryerson. Nothing in this release, individually or taken in the aggregate, constitutes an offer of securities for sale or purchase, or a solicitation of an offer to purchase, any Security in the United States, or to U.S. persons, or in any other jurisdiction in which such an offer or solicitation is unlawful.

Safe Harbor Provision This communication contains certain “forward-looking statements” within the meaning of federal securities laws. Forward-looking statements may be identified by words such as “anticipates,” “believes,” “could,” “continue,” “estimate,” “expects,” “intends,” “will,” “should,” “may,” “plan,” “predict,” “project,” “would” and similar expressions. Forward-looking statements are not statements of historical fact and reflect Ryerson’s current views about future events. Such forward-looking statements include, without limitation, statements about the benefits of the merger involving Ryerson and Olympic Steel, including future financial and operating results, expected synergies, Ryerson’s plans, objectives, expectations, and intentions, and other statements that are not historical facts. No assurances can be given that the forward-looking statements contained in this communication will occur as projected, and actual results may differ materially from those projected. Forward-looking statements are based on current expectations, estimates, and assumptions that involve a number of risks and uncertainties that could cause actual results to differ materially from those projected. These risks and uncertainties include, without limitation, the risk that the businesses will not be integrated successfully or will be more costly or difficult than expected; the risk that the cost savings and any other synergies may not be fully realized or may take longer to realize than expected, or that the merger may be less accretive than expected; the risk that the merger will not provide stockholders with increased earnings potential; the risk that increases to earnings, margins, and cash flows may not be as large as expected or many not occur at all; Ryerson and Olympic Steel may not be able to increase commercial growth, cross-sell, or expand geographically, and scale the combined businesses as expected; the risk that the credit ratings of the combined company or its subsidiaries may be different from what the companies expect; the diversion of management time from ongoing business operations and opportunities as a result of the merger; the risk of adverse reactions or changes to business or employee relationships resulting from the merger; adverse economic conditions; highly cyclical fluctuations resulting from, among others, seasonality, market uncertainty, and costs of goods sold; the Company’s ability to remain competitive and maintain market share in the highly competitive and fragmented metals distribution industry; managing the costs of purchased metals relative to the price at which each company sells its products during periods of rapid price escalation or deflation; customer, supplier, and competitor consolidation, bankruptcy, or insolvency; the impairment of goodwill that could result from, among other things, volatility in the markets in which each company operates; the impact of geopolitical events; future funding for postretirement employee benefits may require substantial payments from current cash flow; the regulatory and other operational risks associated with our operations located outside of the United States; the adequacy of the Company’s efforts to mitigate cyber security risks and threats; reduced production schedules, layoffs, or work stoppages by each company’s own, its suppliers’, or customers’ personnel; any underfunding of certain employee retirement benefit plans and the actual costs exceeding current estimates; prolonged disruption of the Company’s processing centers; failure to manage potential conflicts of interest between or among customers or suppliers of each company; unanticipated changes to, or any inability to hire and retain key personnel at either company; currency exchange rate fluctuations; the incurrence of substantial costs of liabilities to comply with, or as a result of, violations of environmental laws; the risk of product liability claims; the Company’s indebtedness or covenants in the instruments governing such indebtedness; the influence of a single investor group over the Company’s policies and procedures; and other risks inherent in Ryerson’s business and other factors described in Ryerson’s filings with the Securities and Exchange Commission. Additional information concerning these and other factors that may impact such forward-looking statements can be found in filings and potential filings by Ryerson. If any of these risks materialize or assumptions prove incorrect, actual results could differ materially from the results implied by these forward-looking statements.

Forward-looking statements are based on the estimates and opinions of management as of the date of this communication; subsequent events and developments may cause their assessments to change. Ryerson does not undertake any obligation to publicly update any forward-looking statement, whether as a result of new information, future events or otherwise, except as required by law and they specifically disclaim any obligation to do so. Readers are cautioned not to place undue reliance on these forward-looking statements that speak only as of the date hereof.

For full release details see ir.ryerson.com .

Latest News


[Ryerson Reports Third Quarter 2026 Results

10/28/2026
\

Sign Me Up

Join the 100,000+ Metal Professionals Who Receive Monthly Market Intelligence!

Subscribe


Privacy Policy   /  U.S. State Privacy Disclosure (CA, CO, CT, and VA)   /  California Transparency in Supply Chains Act   /  Security Statement   /  Terms and Conditions of Sale   /  Transparency in Coverage   /  Download Notice of Privacy Practices   /  Terms of Use

*We may apply a fee to cover all or part of our costs of accepting your credit card. For OK-based consumers, the fee will be 2%. ©2026 Ryerson Holding Corporation. All Rights Reserved.
+1-855-793-7766

+1-855-793-7766

Contact Us

Locations

|

Live Chat


Metal Solutions


Metal Resources


About Ryerson


Follow Us


Privacy Policy   /  U.S. State Privacy Disclosure (CA, CO, CT, and VA)   /  California Transparency in Supply Chains Act   /  Security Statement   /  Terms and Conditions of Sale   /  Transparency in Coverage   /  Download Notice of Privacy Practices   /  Terms of Use

*We may apply a fee to cover all or part of our costs of accepting your credit card. For OK-based consumers, the fee will be 2%. ©2026 Ryerson Holding Corporation. All Rights Reserved.
Earning Calls

(Chicago – October 1, 2026) — Ryerson Holding Corporation (NYSE: RYZ), a leading value-added processor and distributor of industrial metals, today announces that it will host a conference call to discuss its third quarter 2026 financial results for the period ended September 30th, 2026 on Thursday, October 29th at 10 a.m. Eastern Time. The live online broadcast will be available on the Company’s Investor Relations website, ir.ryerson.com. Ryerson will report earnings after the market closes on Wednesday, October 28th.

Ryerson Holding Corporation’s Third Quarter 2026 Earnings Call Details: DATE: Thursday, October 29, 2026 TIME: 10:00 a.m. ET / 9:00 a.m. CT DIAL-IN: 800-330-6710 (U.S. & Canada) / 646-769-9200 (International) CONFERENCE ID: 8744796

An online replay of the call will be posted on the investor relations website, ir.ryerson.com, and remain available for 90 days. Ryerson is a leading value-added processor and distributor of industrial metals, with operations in the United States, Canada, Mexico, and China. Founded in 1842, Ryerson has around 6,500 employees in approximately 150 locations. Visit Ryerson at www.ryerson.com .

Latest News


[Ryerson Reports Third Quarter 2026 Results

10/28/2026
\

Sign Me Up

Join the 100,000+ Metal Professionals Who Receive Monthly Market Intelligence!

Subscribe


Privacy Policy   /  U.S. State Privacy Disclosure (CA, CO, CT, and VA)   /  California Transparency in Supply Chains Act   /  Security Statement   /  Terms and Conditions of Sale   /  Transparency in Coverage   /  Download Notice of Privacy Practices   /  Terms of Use

*We may apply a fee to cover all or part of our costs of accepting your credit card. For OK-based consumers, the fee will be 2%. ©2026 Ryerson Holding Corporation. All Rights Reserved.
+1-855-793-7766

+1-855-793-7766

Contact Us

Locations

|

Live Chat


Metal Solutions


Metal Resources


About Ryerson


Follow Us


Privacy Policy   /  U.S. State Privacy Disclosure (CA, CO, CT, and VA)   /  California Transparency in Supply Chains Act   /  Security Statement   /  Terms and Conditions of Sale   /  Transparency in Coverage   /  Download Notice of Privacy Practices   /  Terms of Use

*We may apply a fee to cover all or part of our costs of accepting your credit card. For OK-based consumers, the fee will be 2%. ©2026 Ryerson Holding Corporation. All Rights Reserved.
Ryerson Reports Second Quarter 2026 Results Bull 4 Bear 0 Results

Ryerson Quarter Results

Exceeded top line guidance, improved profitability, and grew book value of equity while delivering targeted second-quarter synergies and building momentum toward exceeding our first-year synergy run-rate target

CHICAGO – July 29, 2026 – Ryerson Holding Corporation (NYSE: RYZ), a leading value-added processor and distributor of industrial metals, today reported results for the second quarter ended June 30, 2026.

Highlights:

  • Generated revenue of $2.01 billion in the second quarter, Ryerson’s first full reporting period following the February 13, 2026 merger with Olympic Steel, Inc., exceeding the Company’s previously provided revenue guidance range with total tons shipped 22.6% higher and average selling prices 4.5% higher sequentially. Excluding Olympic Steel, which generated $564 million of revenue during the quarter, same-store revenue was $1.44 billion, with average selling prices 7.2% higher and tons shipped 4.0% higher quarter-over-quarter.

  • Delivered second quarter net income(1) of $15.5 million, or $0.30 per share, and Adjusted EBITDA, excl. LIFO(2) of $101.0 million, $23.5 million of which was attributable to Olympic Steel.

  • Realized approximately $5 million in second quarter synergy attainment and expects to realize $13 to $14 million in third quarter synergies, or $52 to $56 million on an annualized run-rate basis, positioning the Company to exceed its $40 million first-year annual run-rate synergy target ahead of schedule.

  • Ended the second quarter with total Company debt of $955 million and net debt(3) of $913 million, an increase of $47 million and $30 million, respectively, driven by higher working capital requirements supporting higher revenue generation.

  • Returned $10.5 million to stockholders during the quarter, comprised of $9.7 million in dividends and $0.8 million in share repurchases.

A reconciliation of non-GAAP financial measures to the comparable GAAP measure is included below in this news release.

Chart 1 072926

Management Commentary

Eddie Lehner, Ryerson’s Chief Executive Officer & Director, said, “Despite a high-friction economy, Ryerson delivered a promising second quarter by exceeding our revenue, shipment, and Adjusted EBITDA, excl. LIFO guidance expectations as the positively impactful validations of the Ryerson-Olympic merger are proving out all-around and every day. We generated improved sequential and year-over-year net incomewhile realizing encouraging transactional order and market share growth, productivity gains, and synergy attainment. These results were delivered in an asymmetric but better industrial demand environment, highlighted by strong artificial intelligence driven increases in business investment, juxtaposed with somewhat stilted traditional vertical markets, as well as some supply-side capacity constraints in mill production and truck based delivery. I want to thank all of my Ryerson Family of Companies teammates for their exemplary execution in the quarter and commitment to delivering great customer experiences across our network of intelligently connected value-added service centers. Most importantly, we are building enhanced value accretion capabilities throughout our post-merger combined companies to the betterment of all Ryerson stakeholders."

Rick Marabito, Ryerson’s President, Chief Operating Officer & Director added, “Our teams executed well for our customers in the second quarter while continuing to advance the integration of Ryerson and Olympic Steel. In this market environment, customers are increasingly valuing product availability, reliability, processing capability, and speed of response, and we believe our expanded scale positions us better to meet those needs. We realized our targeted synergies for the quarter and are now expecting to exceed our first-year annual run-rate synergy goal thanks to the execution and teamwork taking place across the combined enterprise. We are encouraged by how naturally our teams are working together with a shared purpose. We are seeing the collaboration across our teams and geographies create new opportunities, solve customer needs faster, and improve the customer experience across the organization.”

Second Quarter Results

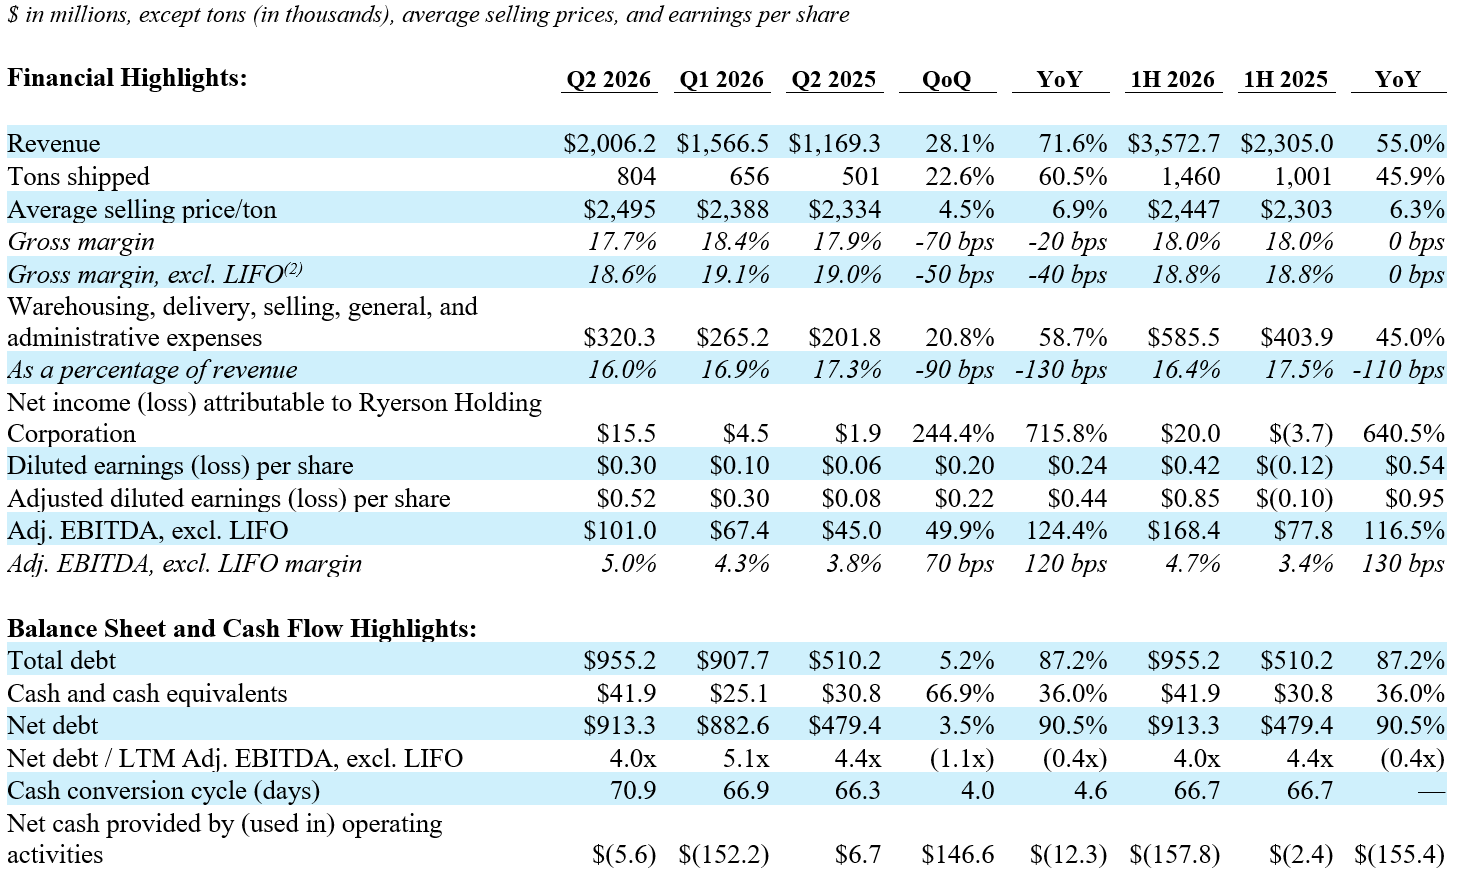
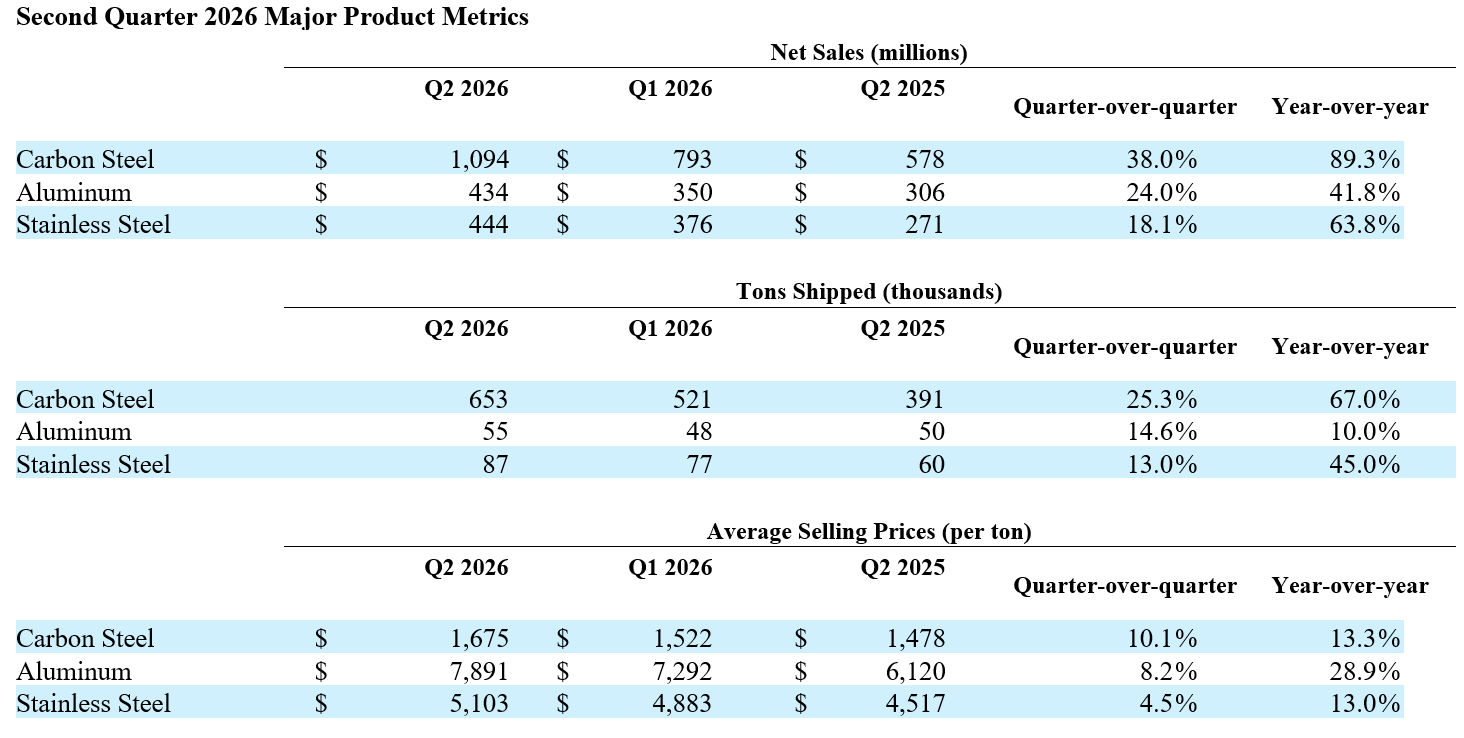
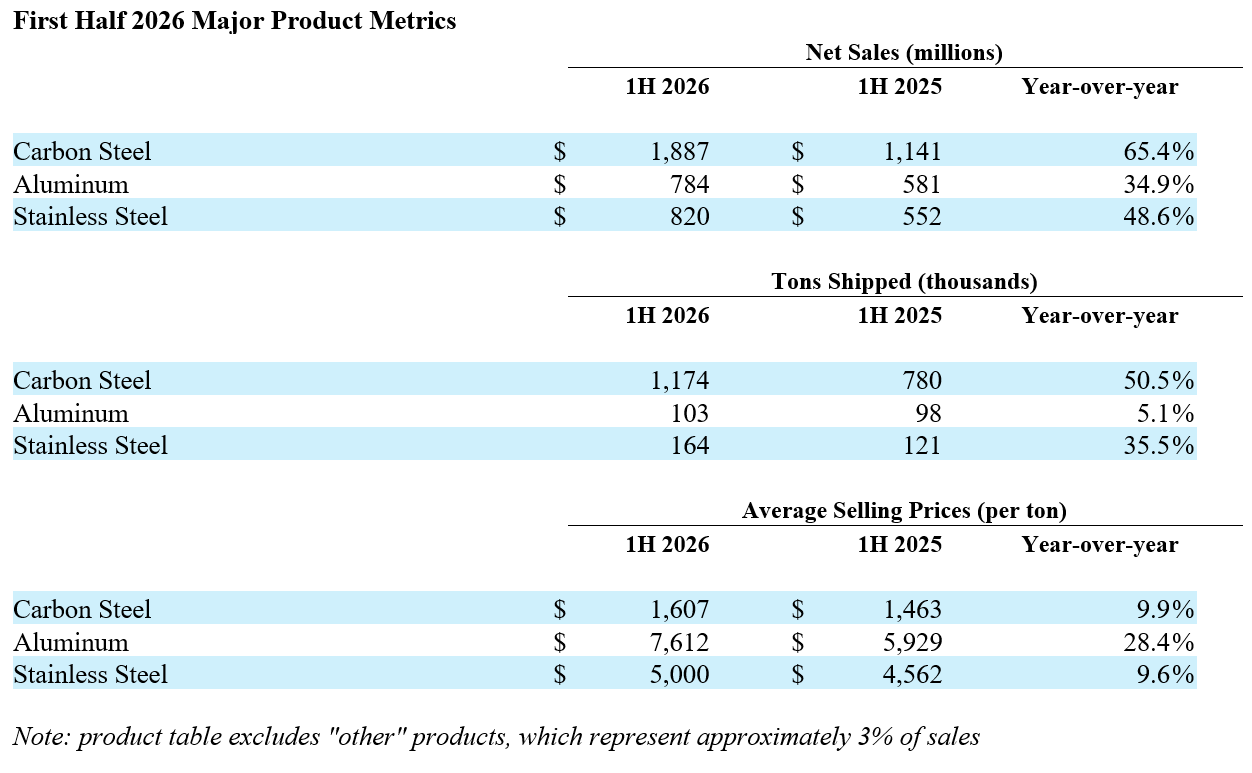
In its first full quarter together with Olympic Steel, Ryerson generated net sales of $2.01 billion, an increase of 28.1% compared to the previous quarter, which only included six weeks of Olympic Steel's results. Total Company tons shipped increased by 22.6% and average selling prices increased by 4.5% quarter-over-quarter. Excluding the impact of Olympic Steel, which generated $564 million of revenue during the quarter, second quarter same-store net sales were $1.44 billion, an increase of 11.5% quarter-over-quarter with average selling prices 7.2% higher and tons sold 4.0% higher. Year-over-year, same-store net sales increased by 23.3% with tons shipped 8.6% higher and average selling prices 13.6% higher. Demand conditions in the second quarter were constructive but uneven as secular strength in data center and power generation projects continued to support activity while other end-markets, such as those more sensitive to interest rates and inflation, remained cautious. At the same time, U.S. industrial metals prices reached multi-year highs during the quarter, with carbon products supported by tight domestic supply, extended lead times, cyclical momentum, and multi-year lows in service center inventories. Aluminum prices and Midwest premiums also rose meaningfully during the quarter, largely due to supply disruptions in the Middle East, while nickel prices remained volatile.

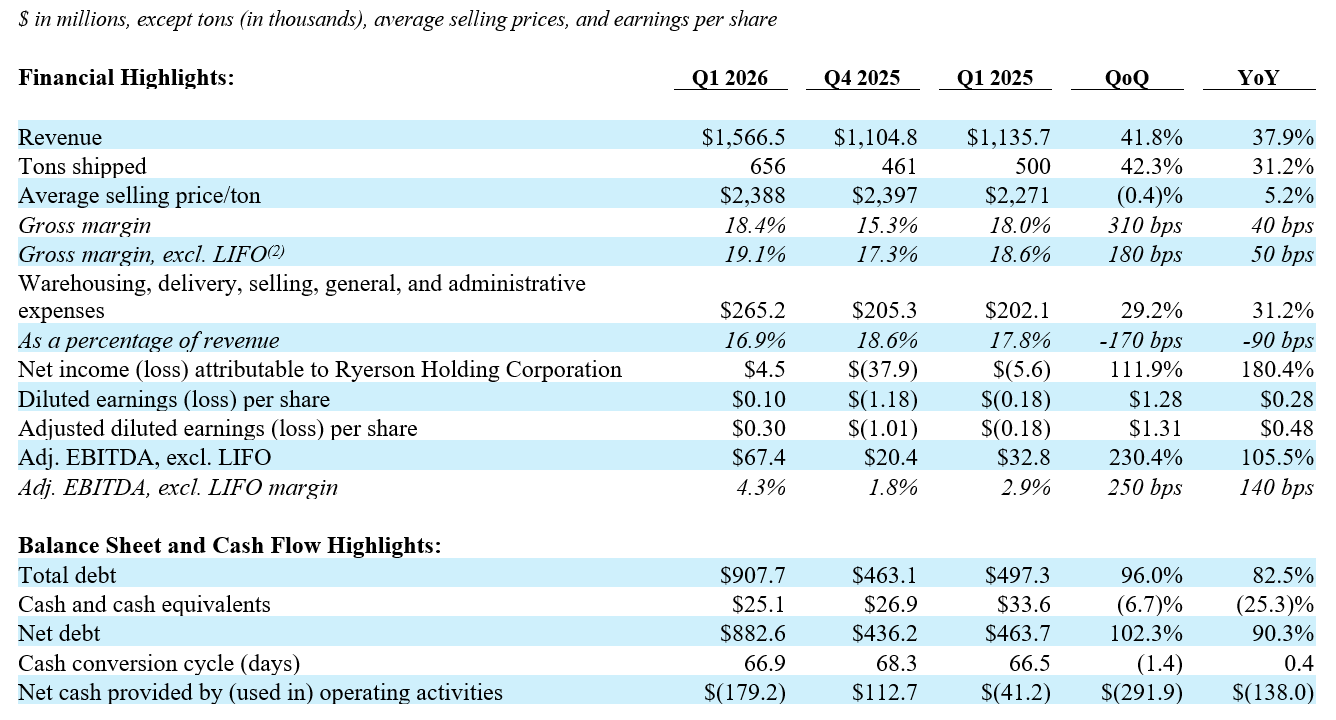
During the second quarter, purchase accounting related to the Olympic Steel merger increased the fair market value of acquired inventory, resulting in a one-time $15.7 million charge to cost of materials sold as acquired inventory was sold during the period. As a result, second quarter gross margin contracted by 70 basis points to 17.7% compared to 18.4% in the prior quarter. Excluding this purchase accounting adjustment, gross margin expanded marginally during the quarter by 10 basis points to 18.5%. Also reflective of the rising price environment, LIFO expense for the second quarter was $17.0 million, compared to $10.0 million in the prior quarter. Excluding the impacts of LIFO and purchase accounting, gross margin expanded by 20 basis points to 19.3% in the second quarter of 2026 compared to gross margin, excluding LIFO of 19.1% in the first quarter of 2026.

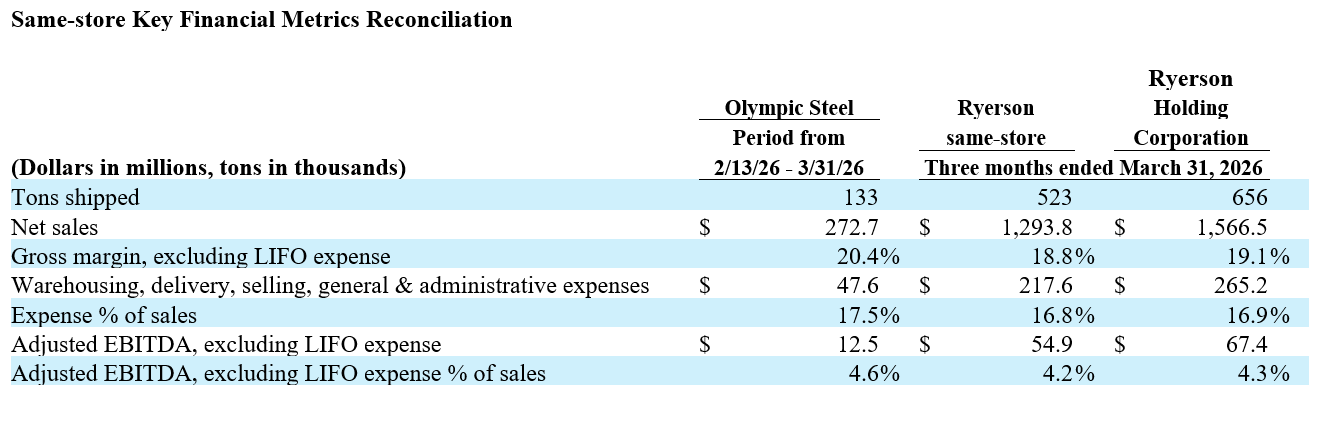
Second quarter total Company warehousing, delivery, selling, general, and administrative expenses were $320.3 million, an increase of 20.8% compared to $265.2 million in the prior quarter. Excluding Olympic Steel, same-store warehousing, delivery, selling, general, and administrative expenses were $218.7 million in the second quarter, relatively flat compared to $217.6 million in the prior quarter, or down as a percentage of sales from 16.8% to 15.2%. On a per ton basis, total Company warehousing, delivery, selling, general, and administrative expenses were $398 per ton in the second quarter, or $402 per ton on a same-store basis, compared to $404 per ton and $416 per ton, respectively, in the previous periods.

Net income attributable to Ryerson Holding Corporation for the second quarter of 2026 was $15.5 million, or $0.30 per diluted share, compared to net income of $4.5 million, or $0.10 per diluted share, for the previous quarter and $1.9 million, or $0.06 per diluted share, in the second quarter of 2025. After removing the impact of purchase accounting adjustments, an insurance settlement gain, advisory service fees, and impairment charges on assets as well as the related income tax benefits of these items, Ryerson's second quarter Adjusted Net Income was $27.6 million, or $0.52 per diluted share. Adjusted EBITDA, excluding LIFO was $101.0 million in the second quarter of 2026 compared to $67.4 million in the first quarter of 2026 and $45.0 million in the year-ago period. On a same-store basis, excluding Olympic Steel's contributions, Ryerson generated Adjusted EBITDA, excluding LIFO of $77.5 million in the second quarter of 2026, compared to $54.9 million in the prior quarter.

Olympic Steel Integration & Financial Results

In the second quarter, Ryerson realized approximately $5 million of synergy benefits through procurement, efficiency, network optimization, and commercial enhancement actions. As these actions scale across the organization and the Company advances the next phase of its integration strategy, management expects third quarter synergy benefits to increase to approximately $13 million to $14 million, or approximately $52 to $56 million on an annualized run-rate basis. This projected realization is expected to position Ryerson to exceed its $40 million first-year annualized run-rate synergy target ahead of schedule, and the Company continues to track toward its $120 million two-year annualized run-rate synergy target.

Olympic Steel contributed $564.2 million of revenue and $23.5 million of Adjusted EBITDA, excluding LIFO, to Ryerson's results during the second quarter, exceeding management’s expectations of $21 to $23 million in Adjusted EBITDA, excluding LIFO.

Liquidity & Debt Management

Ryerson used $5.6 million in cash from operations in the second quarter as net income generation was offset by increased receivables and inventory investment. This compares to a use of cash from operating activities of $152.2 million in the first quarter of 2026. The Company ended the second quarter of 2026 with debt of $955 million and net debt of $913 million, an increase of $47 million and $30 million, respectively, compared to the first quarter of 2026 driven by higher working capital requirements.

Global liquidity, composed of cash and cash equivalents and availability on its revolving credit facilities, increased to $757 million as of June 30, 2026 compared to $618 million as of March 31, 2026, reflective of the Company's increased borrowing base from higher working capital.

Stockholder Return Activity

Dividends. On July 29, 2026, the Board of Directors declared a quarterly cash dividend of $0.1875 per share of common stock, payable on September 17, 2026, to stockholders of record as of September 3, 2026. During the second quarter of 2026, Ryerson’s quarterly dividend was of the same amount and represented a total cash return to stockholders of $9.7 million.

Share Repurchases and Authorization. Ryerson returned $0.8 million to stockholders in the form of share repurchases during the second quarter through the opportunistic repurchase of approximately 39,000 shares in the open market. As these repurchases occurred before the new authorization became effective, the full $100 million share repurchase authorization approved by the Board of Directors on May 6th remains available through April 30th, 2028.

Outlook Commentary

In the third quarter of 2026, the Company expects that shipments will decline sequentially by 3% to 5% from second quarter levels, in-line with normal seasonality patterns. The Company also anticipates that average selling prices will be flat to up by 2% as carbon pricing is expected to remain supported and offset recent LME driven corrections in stainless and aluminum pricing. Net sales are therefore expected to be in the range of $1.87 billion to $1.95 billion. Ryerson also anticipates that as higher cost inventory continues to come into the market, margin pressure will increase given program customer price lags and some non-ferrous average selling price reversion. The Company also expects to recognize approximately $5 to $7 million of additional inventory purchase accounting charges through the end of the year as it sells through the remaining acquired inventory. Excluding these inventory purchase accounting adjustments, net income generation for the third quarter of 2026 is expected to be in the range of $19 to $21 million, or $0.37 to $0.40 per diluted share, with LIFO expense between $16 and $18 million. Third quarter Adjusted EBITDA, excluding LIFO is expected to be in the range of $88 to $92 million, inclusive of Olympic Steel's expected contribution of $21 to $23 million.

Chart 2 072926

Chart 3 072926

Chart 4 072926

Earnings Call Information

Ryerson will host a conference call to discuss second quarter 2026 financial results for the period ended June 30, 2026, on Thursday, July 30, 2026, at 10 a.m. Eastern Time. The live online broadcast will be available on the Company’s investor relations website, ir.ryerson.com. A replay will be available at the same website for 90 days.

About Ryerson

Ryerson is a leading value-added processor and distributor of industrial metals, with operations in the United States, Canada, Mexico, and China. Founded in 1842, Ryerson, together with Olympic Steel, has approximately 6,500 employees and approximately 150 locations. Visit Ryerson at www.ryerson.com.

Notes:

(1)Net income attributable to Ryerson Holding Corporation

(2)For EBITDA, Adjusted EBITDA, Adjusted EBITDA, excluding LIFO and gross margin, excluding LIFO please see Schedule 2

(3)Net debt is defined as long term debt plus short term debt less cash and cash equivalents and excludes restricted cash

Legal Disclaimer The contents herein are provided for general information purposes only and do not constitute an offer to sell or purchase, or a solicitation of an offer to purchase, any security (“Security”) of the Company or its affiliates (“Ryerson”) in any jurisdiction. Ryerson does not intend to solicit, and is not soliciting, any action with respect to any Security or any other contractual relationship with Ryerson. Nothing in this release, individually or taken in the aggregate, constitutes an offer of securities for sale or purchase, or a solicitation of an offer to purchase, any Security in the United States, or to U.S. persons, or in any other jurisdiction in which such an offer or solicitation is unlawful.

Safe Harbor Provision This communication contains certain “forward-looking statements” within the meaning of federal securities laws. Forward-looking statements may be identified by words such as “anticipates,” “believes,” “could,” “continue,” “estimate,” “expects,” “intends,” “will,” “should,” “may,” “plan,” “predict,” “project,” “would” and similar expressions. Forward-looking statements are not statements of historical fact and reflect Ryerson’s current views about future events. Such forward-looking statements include, without limitation, statements about the benefits of the merger involving Ryerson and Olympic Steel, including future financial and operating results, expected synergies, Ryerson’s plans, objectives, expectations, and intentions, and other statements that are not historical facts. No assurances can be given that the forward-looking statements contained in this communication will occur as projected, and actual results may differ materially from those projected. Forward-looking statements are based on current expectations, estimates, and assumptions that involve a number of risks and uncertainties that could cause actual results to differ materially from those projected. These risks and uncertainties include, without limitation, the risk that the businesses will not be integrated successfully or will be more costly or difficult than expected; the risk that the cost savings and any other synergies may not be fully realized or may take longer to realize than expected, or that the merger may be less accretive than expected; the risk that the merger will not provide stockholders with increased earnings potential; the risk that increases to earnings, margins, and cash flows may not be as large as expected or many not occur at all; Ryerson and Olympic Steel may not be able to increase commercial growth, cross-sell, or expand geographically, and scale the combined businesses as expected; the risk that the credit ratings of the combined company or its subsidiaries may be different from what the companies expect; the diversion of management time from ongoing business operations and opportunities as a result of the merger; the risk of adverse reactions or changes to business or employee relationships resulting from the merger; adverse economic conditions; highly cyclical fluctuations resulting from, among others, seasonality, market uncertainty, and costs of goods sold; the Company’s ability to remain competitive and maintain market share in the highly competitive and fragmented metals distribution industry; managing the costs of purchased metals relative to the price at which each company sells its products during periods of rapid price escalation or deflation; customer, supplier, and competitor consolidation, bankruptcy, or insolvency; the impairment of goodwill that could result from, among other things, volatility in the markets in which each company operates; the impact of geopolitical events; future funding for postretirement employee benefits may require substantial payments from current cash flow; the regulatory and other operational risks associated with our operations located outside of the United States; the adequacy of the Company’s efforts to mitigate cyber security risks and threats; reduced production schedules, layoffs, or work stoppages by each company’s own, its suppliers’, or customers’ personnel; any underfunding of certain employee retirement benefit plans and the actual costs exceeding current estimates; prolonged disruption of the Company’s processing centers; failure to manage potential conflicts of interest between or among customers or suppliers of each company; unanticipated changes to, or any inability to hire and retain key personnel at either company; currency exchange rate fluctuations; the incurrence of substantial costs of liabilities to comply with, or as a result of, violations of environmental laws; the risk of product liability claims; the Company’s indebtedness or covenants in the instruments governing such indebtedness; the influence of a single investor group over the Company’s policies and procedures; and other risks inherent in Ryerson’s business and other factors described in Ryerson’s filings with the Securities and Exchange Commission. Additional information concerning these and other factors that may impact such forward-looking statements can be found in filings and potential filings by Ryerson. If any of these risks materialize or assumptions prove incorrect, actual results could differ materially from the results implied by these forward-looking statements.

Forward-looking statements are based on the estimates and opinions of management as of the date of this communication; subsequent events and developments may cause their assessments to change. Ryerson does not undertake any obligation to publicly update any forward-looking statement, whether as a result of new information, future events or otherwise, except as required by law and they specifically disclaim any obligation to do so. Readers are cautioned not to place undue reliance on these forward-looking statements that speak only as of the date hereof.

For full release details see ir.ryerson.com .

Latest News


[Ryerson Reports Third Quarter 2026 Results

10/28/2026
\

Sign Me Up

Join the 100,000+ Metal Professionals Who Receive Monthly Market Intelligence!

Subscribe


Privacy Policy   /  U.S. State Privacy Disclosure (CA, CO, CT, and VA)   /  California Transparency in Supply Chains Act   /  Security Statement   /  Terms and Conditions of Sale   /  Transparency in Coverage   /  Download Notice of Privacy Practices   /  Terms of Use

*We may apply a fee to cover all or part of our costs of accepting your credit card. For OK-based consumers, the fee will be 2%. ©2026 Ryerson Holding Corporation. All Rights Reserved.
+1-855-793-7766

+1-855-793-7766

Contact Us

Locations

|

Live Chat


Metal Solutions


Metal Resources


About Ryerson


Follow Us


Privacy Policy   /  U.S. State Privacy Disclosure (CA, CO, CT, and VA)   /  California Transparency in Supply Chains Act   /  Security Statement   /  Terms and Conditions of Sale   /  Transparency in Coverage   /  Download Notice of Privacy Practices   /  Terms of Use

*We may apply a fee to cover all or part of our costs of accepting your credit card. For OK-based consumers, the fee will be 2%. ©2026 Ryerson Holding Corporation. All Rights Reserved.
Prompts

Ryerson Holding Corporation (ticker RYZ), listed in United States.

Company History

Date Change Detail
— Former tickers RYI

ETFs Holding Ryerson Holding Corporation

ETF Weight in ETF Shares Market value As of
FSEV 0.35% 946 $ 23.281K Jun 30, 2026
BSVO 0.31% 262,161 $ 7.42M Nov 18, 2026
FESM 0.15% 355,758 $ 8.755M Jun 30, 2026
SYZ 0.15% 4,202 $ 103.411K Jun 30, 2026
SQLV 0.14% 1,633 $ 40.188K Jun 30, 2026
DFSV 0.11% 1,001,194 $ 30.216M Nov 12, 2026
AVSC 0.09% 99,516 $ 2.83M Nov 16, 2026
VFVA 0.07% 27,017 $ 677.046K Aug 31, 2026
AVUV 0.06% 693,743 $ 19.73M Nov 16, 2026
FEAC 0.04% 459 $ 11.296K Jun 30, 2026
AVIE 0.04% 220 $ 6,256.80 Nov 16, 2026
RESM 0.04% 59 $ 1,451.99 Jun 30, 2026
DFAS 0.04% 420,738 $ 12.698M Nov 12, 2026
DFAT 0.03% 308,637 $ 9.315M Nov 12, 2026
DXUV 0.02% 35,201 $ 1.062M Nov 12, 2026
AVSU 0.01% 1,252 $ 35.607K Nov 16, 2026
DFSU 0.01% 7,820 $ 236.008K Nov 12, 2026
DFAC 0.01% 254,113 $ 7.669M Nov 12, 2026
DCOR 0.01% 123,733 $ 3.734M Nov 12, 2026
MSSM 0.01% 1,569 $ 39.319K Aug 31, 2026
DFUV 0.00% 21,595 $ 651.737K Nov 12, 2026
DFAU 0.00% 13,265 $ 400.338K Nov 12, 2026
DFUS 0.00% 16,476 $ 497.246K Nov 12, 2026
EBI 0.00% 38 $ 952.28 Aug 31, 2026
AVUS 0.00% 23,471 $ 667.515K Nov 16, 2026