On November 9, 2026, RPM International Inc. (the “Company”) will present details about its new operating improvement program, MAP 2030, at an Investor Day event in Cherry Hill, New Jersey. The Company’s MAP 2030 presentation is attached hereto as Exhibit 99.1 and is incorporated herein by reference. The Company’s MAP 2030 presentation is also available at the Company’s website (www.RPMInc.com). Furthermore, the Company’s Investor Day event will be recorded and a replay will be available at the Company’s website (www.RPMInc.com). The Company’s MAP 2030 presentation includes certain data that do not directly conform to generally accepted accounting principles (“GAAP”). Tables reconciling such non-GAAP data with the most directly comparable GAAP financial measures, where available without unreasonable effort, are available as an appendix to the Company’s MAP 2030 presentation and at the Company’s website (www.RPMInc.com).
|
RPM International Inc. is a specialty chemicals company that manufactures, markets, and sells specialty paints, infrastructure rehab and repair products, protective coatings, roofing systems, sealants, and adhesives. The company operates through three reportable segments: the Construction Products Group (CPG), the Performance Coatings Group (PCG), and Consumer. CPG provides construction services and products including waterproofing, roofing systems, sealants, adhesives, and building envelope solutions. PCG offers high-performance flooring systems, corrosion control coatings, infrastructure repair systems, and fiberglass reinforced plastic structures. The Consumer segment sells rust-preventative, decorative paints, caulks, sealants, primers, and woodcare coatings. RPM serves construction, industrial, specialty, and consumer markets globally. The company was originally incorporated in 1947 as Republic Powdered Metals, Inc. and changed its name to RPM, Inc. in 1971. Summarised from the company's own disclosures, fiscal year ended Jul 2026 |
Industry Specialty Chemicals | Homepage rpminc.com |
| Sector Basic Materials | IR page rpminc.com/investors | |
|
Tags
specialty coatings, sealants, adhesives, roofing systems, protective coatings, infrastructure repair, building envelope solutions, concrete admixtures, fireproofing, corrosion control, fiberglass reinforced plastic, decorative paints, API, Carboline, CAVE, DAP, Day-Glo, Dri-Eaz, Dryvit, Euclid, EUCO, Fibergrate, Fibregrid, Fibrecrete, Flecto, Flowcrete, Gator, Grupo PV, Hummervoll, illbruck, Kalzip, Kemtile, Key Resin, Nudura, Mohawk, The Pink Stuff, Prime Resins, Ready Seal, Rust-Oleum, Specialty Polymer Coatings, Stonhard, Strathmore, TCI, Toxement, Tremco, Tuf-Strand, Universal Sealants, Viapol, Watco, Zinsser, AlphaGuard, AlphaGrade, BURmastic, OneSeal, POWERply, THERMastic, TremPly, TremLock, Vulkem, TREMproof, TremSafe, Dymonic, ExoAir, Spectrem, TREMstop, TUFF-N-DRI, Watchdog Waterproofing, Enviro-Dri, Skytech, Weatherproofing Technologies Incorporated, Weatherproofing Technologies Canada, Pure Air Control Services
|
Press page rpminc.com/news |
Metrics
| Valuation | |
|---|---|
| Market cap | $ 13.262B |
| Market cap (USD) | $ 13.262B |
| P/E | 19.22 |
| PEG | 1.69 |
| P/BV | 3.81 |
| P/S | 1.66 |
| P/OCF | 14.33 |
| P/FCF | 18.80 |
| Dividend yield | 1.4% |
| Turnover / mcap | — |
| Returns | |
|---|---|
| ROE | 21.3% |
| ROI | 17.8% |
| ROIC | 17.8% |
| Profit margin | 8.4% |
| Growth | |
|---|---|
| Revenue growing | Yes |
| Profits growing | No |
| Revenue up 3y | Yes |
| Revenue up 5y | Yes |
| Earnings growth 3y (net profit CAGR) | 11.4% |
| Quality | |
|---|---|
| Profitable | Yes |
| Margin expanding | No |
| Buying back stock | No |
| Diluting (TTM) | No |
| Debt/Equity | — |
| Podcast bulls (TTM) | Sign up |
| Podcast bears (TTM) | Sign up |
| Podcast sentiment (TTM) | Sign up |
| Podcast sentiment % (TTM) | Sign up |
| News sentiment (TTM) | 36 |
| Quality score | 26.3% |
| Insiders | |
|---|---|
| Buys, 1w | Sign up |
| Buys, 1m | Sign up |
| Buys, 1y | Sign up |
| Sells, 1w | Sign up |
| Sells, 1m | Sign up |
| Sells, 1y | Sign up |
Sign up to see this company's insider trades
| Figure | FY 2026 | FY 2025 | FY 2024 | FY 2023 | FY 2022 | FY 2021 | FY 2020 | FY 2019 | FY 2018 | FY 2017 | FY 2016 | FY 2015 | FY 2014 | FY 2013 | FY 2012 | FY 2011 | FY 2010 | FY 2009 | FY 2008 | FY 2007 | FY 2006 | FY 2005 | FY 2004 | FY 2003 | FY 2002 | FY 2001 | FY 2000 |
|---|---|---|---|---|---|---|---|---|---|---|---|---|---|---|---|---|---|---|---|---|---|---|---|---|---|---|---|
| Revenue | 7.863B | 7.373B | 7.335B | 7.256B | 6.708B | 6.106B | 5.507B | 5.565B | 5.322B | 4.958B | 4.814B | 4.595B | 4.376B | 4.079B | 3.777B | 3.382B | 3.413B | 3.368B | 3.644B | 3.339B | 3.008B | 2.556B | 2.342B | 2.083B | 1.986B | 2.008B | 1.954B |
| Net profit | 661.392M | 688.688M | 588.397M | 478.691M | 491.481M | 502.643M | 304.385M | 266.558M | 337.77M | 181.823M | 354.725M | 239.484M | 291.66M | 98.603M | 215.936M | 189.058M | 180.037M | 119.616M | 47.709M | 208.289M | -76.205M | 105.032M | 141.886M | 35.327M | 101.554M | 62.961M | 40.992M |
| Free cash flow | 675.201M | 538.26M | 908.335M | 322.67M | -43.672M | 608.957M | 402.163M | 156.184M | 275.764M | 260.018M | 357.523M | 245.085M | 184.357M | 277.087M | 223.257M | 198.34M | 180.695M | 212.009M | 162.874M | 131.912M | 124.334M | 101.743M | 101.744M | 118.815M | 151.439M | 20.377M | 39.393M |
| Figure | FY 2026 | FY 2025 | FY 2024 | FY 2023 | FY 2022 | FY 2021 | FY 2020 | FY 2019 | FY 2018 | FY 2017 | FY 2016 | FY 2015 | FY 2014 | FY 2013 | FY 2012 | FY 2011 | FY 2010 | FY 2009 | FY 2008 | FY 2007 | FY 2006 | FY 2005 | FY 2004 | FY 2003 | FY 2002 | FY 2001 | FY 2000 |
|---|---|---|---|---|---|---|---|---|---|---|---|---|---|---|---|---|---|---|---|---|---|---|---|---|---|---|---|
| Share price | 99.4 | 115.68 | 114.16 | 82.8 | 83.55 | 90.59 | 59.5 | 58.04 | 47.67 | 55.03 | 51.15 | 48.24 | 42.13 | 30.01 | 26.19 | 23.43 | 21.11 | 14.82 | 24.09 | 22.53 | 19 | — | — | — | — | — | — |
| Price performance 12m | -0.14 | 0.01 | 0.38 | -0.01 | -0.08 | 0.52 | 0.03 | 0.22 | -0.13 | 0.08 | 0.06 | 0.15 | 0.4 | 0.15 | 0.12 | 0.11 | 0.42 | -0.38 | 0.07 | 0.19 | — | — | — | — | — | — | — |
Filed figures
Lines the statements and their notes report beside the headline figures, read from the filings' XBRL as filed (no restatement applied), with figures computed from one filing's own lines. Cash-flow lines carry their cash direction: an outflow is negative. Each period links to its filing; a figure's period, report date and tag are in its tooltip.
| Figure | May 2017 | May 2018 | May 2019 | May 2020 | May 2021 | May 2022 | May 2023 | May 2024 | May 2025 | May 2026 |
|---|---|---|---|---|---|---|---|---|---|---|
| Balance sheet detail | ||||||||||
| Trade receivables (USD) | 995M | 1.11B | 1.23B | 1.14B | 1.28B | 1.43B | 1.5B | 1.42B | 1.51B | 1.66B |
| ↳ YoY growth | +3.3% | +11.9% | +10.6% | -7.7% | +12.6% | +11.9% | +4.9% | -5.6% | +6.3% | +10.1% |
| ↳ 5y CAGR | +5.9% | +7.2% | +7.1% | +3.5% | +5.9% | +7.6% | +6.2% | +2.9% | +5.8% | +5.3% |
| Borrowings, current (USD) | 254M | 3.5M | 552M | 80.9M | 1.28M | 603M | 179M | 136M | 7.69M | 408M |
| Borrowings, non-current (USD) | 1.84B | 2.17B | 1.97B | 2.46B | 2.38B | 2.08B | 2.51B | 1.99B | 2.64B | 2.13B |
| Lease liabilities (USD) | — | — | — | 297M | 316M | 323M | 345M | 348M | 387M | 416M |
| Cash and deposits (USD) | 350M | 244M | 223M | 233M | 247M | 202M | 216M | 237M | 302M | 315M |
| Intangible assets (USD) | 573M | 584M | 601M | 584M | 629M | 592M | 555M | 513M | 781M | 825M |
| Right-of-use assets (USD) | — | — | — | 284M | 301M | 308M | 330M | 332M | 370M | 397M |
| Net debt (borrowings + leases - cash) (USD) | 1.74B | 1.93B | 2.3B | 2.6B | 2.45B | 2.81B | 2.81B | 2.24B | 2.73B | 2.63B |
| Cash flow detail | ||||||||||
| Operating cash flow (USD) | 386M | 390M | 293M | 550M | 766M | 179M | 577M | 1.12B | 768M | 899M |
| Purchases of property, plant and equipment (USD) | -126M | -115M | -137M | -148M | -157M | -222M | -254M | -214M | -230M | -224M |
| Change in receivables (cash effect) (USD) | -5.69M | -106M | -131M | 82.1M | -88.6M | -187M | -94.6M | 82.9M | -55M | -119M |
| Change in inventories (cash effect) (USD) | -70.7M | -34.1M | -16.8M | 21.3M | -68.8M | -304M | 66.8M | 180M | -34.5M | 18.5M |
| Change in payables (cash effect) (USD) | 16.2M | 51.6M | -29.6M | -27.1M | 151M | 101M | -116M | -24.4M | 84.1M | 67.7M |
| Dividends paid (cash effect) (USD) | -157M | -167M | -181M | -185M | -195M | -204M | -214M | -232M | -256M | -272M |
| Share buybacks (cash effect) (USD) | -21.9M | -17.2M | -200M | -125M | -50M | -52.5M | -50M | -55M | -70M | -77.5M |
| Interest paid (cash effect) (USD) | -78.7M | -97.3M | -101M | -103M | -82.4M | -81.8M | -114M | -117M | -93.5M | -109M |
| Income taxes paid (cash effect) (USD) | -71.2M | -83.5M | -68.4M | -103M | -147M | -172M | -134M | -204M | -204M | -198M |
| Share-based compensation (USD) | 32.5M | 25.4M | 31.2M | 19.8M | 40.9M | 40.1M | 28.7M | 25.9M | 27M | 32.8M |
| Operating cash flow before change in receivables (USD) | 392M | 497M | 424M | 468M | 855M | 366M | 672M | 1.04B | 823M | 1.02B |
| Free cash flow (OCF - PPE - intangibles) (USD) | 260M | 276M | 156M | 402M | 609M | -43.7M | 323M | 908M | 538M | 675M |
| Income detail | ||||||||||
| Research and development expense (USD) | 64.9M | 69.7M | 71.6M | 76.5M | 77.6M | 80.5M | 86.6M | 92.2M | 94.7M | 97.9M |
| ↳ 5y CAGR | +7.4% | +7.2% | +5.6% | +6.2% | +4.8% | +4.4% | +4.4% | +5.2% | +4.4% | +4.8% |
| Total comprehensive income (USD) | 213M | 354M | 149M | 165M | 706M | 470M | 412M | 657M | 694M | 749M |
| Comprehensive income to owners (USD) | 210M | 353M | 148M | 165M | 705M | 469M | 411M | 656M | 692M | 748M |
| Provision for credit losses (USD) | 16M | 9.1M | 18.6M | 16.7M | 10M | 4.33M | 13.6M | 18.4M | 16.4M | 9.3M |
| Credit cost ratio (credit losses / average receivables) (%) | 1.6% | 0.9% | 1.6% | 1.4% | 0.8% | 0.3% | 0.9% | 1.3% | 1.1% | 0.6% |
| Reported | Jul 24, 2017 | Jul 23, 2018 | Jul 24, 2019 | Jul 27, 2020 | Jul 26, 2021 | Jul 25, 2022 | Jul 26, 2023 | Jul 25, 2024 | Jul 24, 2025 | Jul 22, 2026 |
Sign up to see institutional holdings
Sign UpPodcast Mentions
Sign up to see podcast mentions and sentiment
Sign UpMaterial events reported to the SEC on Form 8-K or 6-K, newest first. The link opens the filing itself on EDGAR. Press releases from the company's own website, newest first.
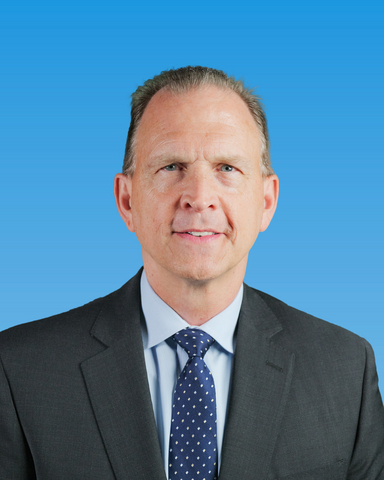
Planned Retirement of Frank C. Sullivan, Chairman and Chief Executive Officer On November 6, 2026, Frank C. Sullivan, Chairman and Chief Executive Officer of RPM International Inc. (the Company”), formally announced his plan to retire in the next twelve to eighteen months after more than 40 years of dedicated service to the Company and nearly 25 years as the Company’s Chairman and Chief Executive Officer. Mr. Sullivan has intentionally provided such advanced notice of his planned retirement to facilitate the strategic and orderly transition of his duties and responsibilities to his successor in connection with an ongoing succession planning process initiated by and coordinated with the Company’s Board of Directors. Mr. Sullivan will serve in his current position and capacity with the Company until his successor is appointed and thereafter is expected to remain as Chair of the Company’s Board of Directors.
• Quarterly payment of $0.57 per share is 5.6% increase over prior year
• All nominees to the board of directors elected at annual meeting of stockholders
MEDINA, Ohio – October 8, 2026 – RPM International Inc. (NYSE: RPM) today announced at its
annual meeting of stockholders that its board of directors declared a regular quarterly cash dividend of $0.57 per share, payable on October 30, 2026, to stockholders of record as of October 20, 2026. This payment represents a 5.6% increase over the $0.54 quarterly cash dividend paid at this time last year and is the 53rd consecutive year the company has increased its cash dividend.
“I’m proud to announce that RPM has increased its dividend for the 53rd consecutive year. This milestone reflects the unwavering dedication of our associates, whose focus on serving customers and executing with discipline in a challenging environment continues to create lasting value for our stockholders,” said Frank C. Sullivan, RPM Chairman and CEO.
RPM’s 53rd consecutive year of increased cash dividends paid to its stockholders places RPM in an elite category of less than half of 1 percent of all publicly traded U.S. companies.










Prompts
Click prompts to add them under the company line, click again to take one out, then copy the result into your AI chat. Shared by Asian Century Stocks and Uncovered Thai Stocks. Thank you.
Company History
Name and ticker changes, and re-registrations under a new regulatory id. When a ticker stopped being used is not recorded, so former tickers are undated.
| Date | Change | Detail |
|---|---|---|
| Aug 29, 2002 | Renamed | RPM INC/OH/ → RPM INTERNATIONAL INC/DE/ |
ETFs Holding RPM International Inc.
Exchange-traded funds whose newest published daily portfolio holds one of the company's listings, largest weight first.
| ETF | Weight in ETF | Shares | Market value | As of |
|---|---|---|---|---|
| CTIF | 4.21% | 80,294 | $ 8.27M | Nov 18, 2026 |
| WBIF | 1.64% | 3,474 | $ 386.135K | Jun 30, 2026 |
| KDVD | 1.13% | 855 | $ 95.033K | Jun 30, 2026 |
| HSMV | 0.83% | 441 | $ 45.771K | Nov 16, 2026 |
| TMSL | 0.35% | 84,492 | $ 9.391M | Jun 30, 2026 |
| TVAL | 0.35% | 38,110 | $ 3.955M | Nov 17, 2026 |
| AIVL | 0.35% | 12,924 | $ 1.437M | Jun 30, 2026 |
| SMDX | 0.34% | 4,200 | $ 435.918K | Nov 17, 2026 |
| VFQY | 0.30% | 14,704 | $ 1.531M | Aug 31, 2026 |
| MSSM | 0.26% | 17,677 | $ 1.84M | Aug 31, 2026 |
| AVMV | 0.22% | 17,318 | $ 1.797M | Nov 16, 2026 |
| JMEE | 0.22% | 60,621 | $ 6.241M | Nov 17, 2026 |
| AVMC | 0.15% | 8,061 | $ 836.651K | Nov 16, 2026 |
| BALI | 0.14% | 20,501 | $ 2.128M | Nov 16, 2026 |
| GVLU | 0.13% | 3,244 | $ 336.695K | Nov 17, 2026 |
| DFAS | 0.09% | 277,608 | $ 28.627M | Nov 12, 2026 |
| INRO | 0.08% | 4,324 | $ 448.788K | Nov 16, 2026 |
| DFSU | 0.07% | 17,093 | $ 1.763M | Nov 12, 2026 |
| DFUV | 0.07% | 106,654 | $ 10.998M | Nov 12, 2026 |
| SFGV | 0.07% | 7,718 | $ 790K | Nov 18, 2026 |
| DFAC | 0.04% | 376,214 | $ 38.795M | Nov 12, 2026 |
| SYZ | 0.04% | 253 | $ 28.121K | Jun 30, 2026 |
| DXUV | 0.04% | 23,962 | $ 2.471M | Nov 12, 2026 |
| DCOR | 0.04% | 157,443 | $ 16.236M | Nov 12, 2026 |
| AVUS | 0.03% | 40,373 | $ 4.19M | Nov 16, 2026 |
| AVLC | 0.03% | 5,272 | $ 547.181K | Nov 16, 2026 |
| EBI | 0.03% | 1,885 | $ 196.229K | Aug 31, 2026 |
| DFAU | 0.02% | 29,280 | $ 3.019M | Nov 12, 2026 |
| ENHU | 0.02% | 17 | $ 1,764.43 | Nov 16, 2026 |
| DFUS | 0.02% | 39,026 | $ 4.024M | Nov 12, 2026 |
| MSLC | 0.01% | 4,859 | $ 505.822K | Aug 31, 2026 |
| AVSU | 0.01% | 426 | $ 44.215K | Nov 16, 2026 |
| IALT | 0.01% | 7,417 | $ 769.81K | Nov 16, 2026 |
| DFLV | 0.00% | 1,273 | $ 131.272K | Nov 12, 2026 |