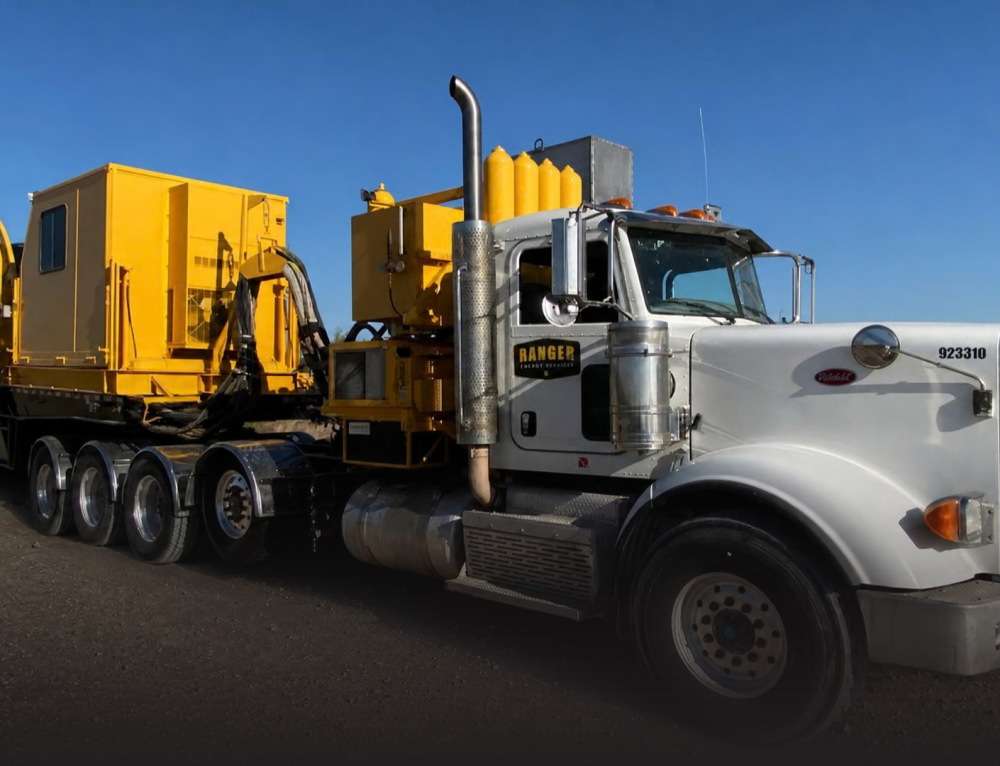
November 10, 2025 Ranger Energy Services, Inc. Announces Q3 2025 Results & Acquisition of American Well Services HOUSTON--(BUSINESS WIRE)-- HOUSTON, TX — (November 10, 2025) — Ranger Energy Services, Inc. (NYSE: RNGR) (“Ranger” or the “Company”)…
November 10, 2025
Ranger Energy Services, Inc. Announces Q3 2025 Results & Acquisition of American Well Services
HOUSTON--(BUSINESS WIRE)-- HOUSTON, TX — (November 10, 2025) — Ranger Energy Services, Inc. (NYSE: RNGR) (“Ranger” or the “Company”) announced today its results for the third quarter ended September 30, 2025 and the acquisition of American Well Services.
Highlights
- Completed acquisition of American Well Services (“AWS”), a leading Permian focused provider that delivers incremental scale and pull through capabilities in the strongest U.S. land basin
- Repurchased 667,500 outstanding shares during the quarter for $8.3 million bringing year to date capital returns to $15.6 million during a challenging market backdrop
- Revenue of $128.9 million, a 16% decrease from $153.0 million in the third quarter of 2024, and an 8% decrease from $140.6 million in the second quarter of 2025
- Net income of $1.2 million, or $0.05 per diluted share, compared to $8.7 million, or $0.39 per diluted share, in the third quarter of 2024, and $7.3 million, or $0.32 per diluted share, in the second quarter 2025
- Adjusted EBITDA(1) of $16.8 million, representing a 13% Adjusted EBITDA margin as compared to $20.6 million in the second quarter of 2025
- Free Cash Flow(2) of $8.0 million for the quarter, or $0.37 per share, with cash of $45.2 million and total liquidity of $116.7 million at the end of the quarter
|
|
|
|
| __________________________ |
|
|
|
| 1 |
|
|
“Adjusted EBITDA” is not presented in accordance with generally accepted accounting principles in the United States (“U.S. GAAP”). The Company defines Adjusted EBITDA as net income or loss before net income expense, income tax provision or benefit, depreciation and amortization, equity-based compensation, acquisition-related, severance and reorganization costs, gain or loss on disposal of property and equipment, and certain other non-cash items that we do not view as indicative of our ongoing performance. A non-GAAP supporting schedule is included with the statements and schedules attached to this press release and can also be found on the Company's website at: www.rangerenergy.com |
| 2 |
|
|
“Free Cash Flow” is not presented in accordance with U.S. GAAP and should be considered in addition to, rather than as a substitute for, net income as a measure of our performance or net cash provided by operating activities as a measure of our liquidity. The Company defines Free Cash Flow as net cash provided by operating activities before purchase of property and equipment. A Non-GAAP supporting schedule is included with the statements and schedules attached to this press release and can also be found on the Company's website at www.rangerenergy.com. |
Management Comments
Stuart Bodden, Ranger’s Chief Executive Officer, commented, “Today, we are pleased to announce the acquisition of American Well Services, a Permian based well services provider, at a compelling valuation. This transaction galvanizes our role as the leading well services provider, while providing new growth opportunities through additional service lines that complement Ranger’s existing high spec rigs business_._ AWS, as well as Ranger, have benefitted from customer consolidation in recent history and we strongly believe this combination will create further value. AWS has created a strong platform with 39 well-maintained high-spec rigs that include complementary equipment and well-trained crews that will integrate seamlessly into Ranger. The combined company will become the largest well services provider in the Lower 48 with the most compelling technology in the space. Ranger is excited for the value that it will bring to our shareholders in the future.
“Ranger continues to demonstrate resilience as broader industry conditions fluctuate. Although our financial performance was recently challenged by a difficult macro-environment, I am confident in the strategic positioning and underlying strength of the company. Despite declines in our completion-focused service lines, particularly Coil Tubing in the Rockies, our production-focused business model has kept our operations on firm footing, attracting blue-chip customers who rely on us for their most difficult and demanding projects. Notably, production rig hours in our core HSR segment increased compared to the second quarter, reflecting our disciplined approach and stable demand in this area. We also maintained a strong balance sheet and allocated capital effectively during this period, including an aggressive share repurchase of 667,500 shares and payment of our base load dividend for the quarter. For the year, we have returned $15.6 million to shareholders through dividends and buybacks, a testament to our cash flow strength, having generated $25.8 million of free cash flow even while navigating challenging market conditions.
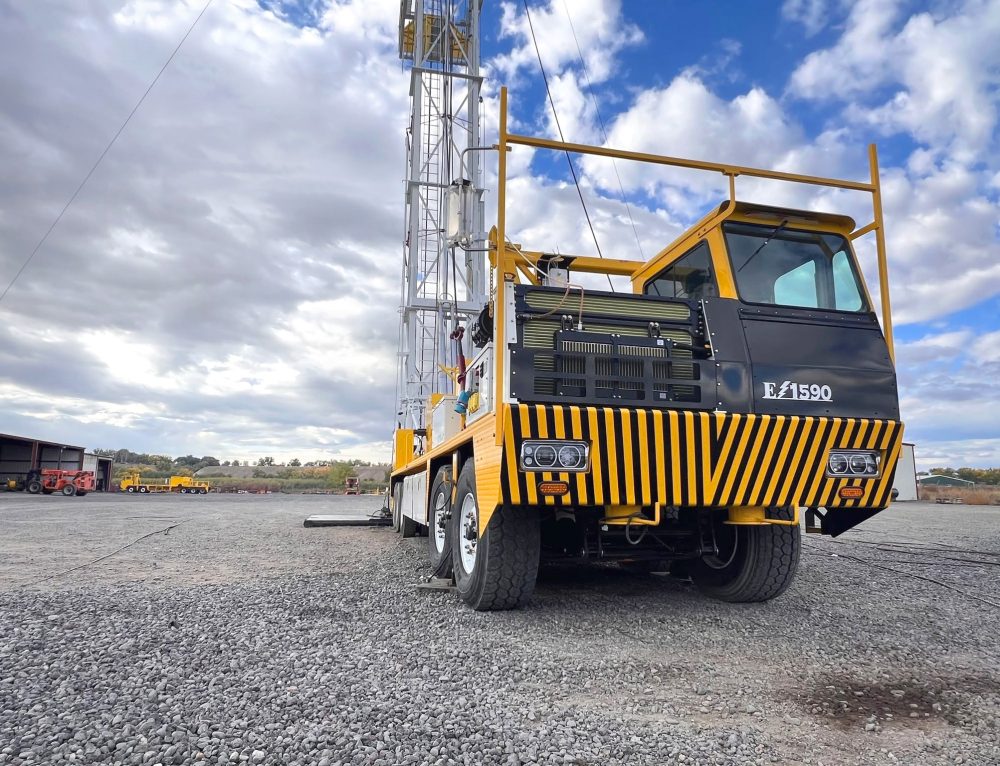
We also continue to be energized by the introduction of our ECHO rig, our recently introduced electric hybrid rig that offers an opportunity to convert conventional rigs into a next generation rig with a lower emissions profile, safety enhancements and operational efficiencies. ECHO is a differentiated solution that further solidifies Ranger’s position as the well-service provider of choice. The first two ECHO rigs have been delivered and are being deployed presently. Customer interest remains robust, and we look forward to updating you about our ongoing conversions as clients recognize the value and innovation these rigs bring to their operations.
As we look forward, our continued resilience is only possible with the hard work and dedication of our employees and the support of our customers. Our future success will be defined by their continued outstanding contributions,” concluded Mr. Bodden.
CAPITAL RETURNS AND GOVERNANCE UPDATE
Year to date through September 30th, 2025, the Company has repurchased 945,600 shares of stock for a total value of $11.6 million, net of tax, at an average price of $12.20 per share. Since the share repurchase program’s inception in 2023 through the end of the third quarter of 2025, the Company has repurchased a total of 4,271,400 shares, for a total value of $46.4 million, net of tax. Additionally, today the Ranger Board of Directors declared this quarter’s cash dividend of $0.06 per share payable on December 5, 2025, to common stockholders of record at the close of business on November 21, 2025, reinforcing our commitment to a consistent return of capital each and every quarter.
PERFORMANCE SUMMARY
For the third quarter of 2025, revenue was $128.9 million, a decrease from $153.0 million in the prior year period, and from $140.6 million in the prior quarter. Quarter over quarter decreases are attributable to reduced operating activity across all service segments.
Cost of services for the third quarter of 2025 was $109.1 million, or 85%, of revenue, relatively flat compared to 84% of revenue in the prior year period. General and administrative expenses were $6.6 million for the third quarter of 2025, an improvement from $7.0 million in the prior quarter and from $7.1 million in the prior year period.
Net income totaled $1.2 million for the third quarter of 2025 compared to $8.7 million in the prior year period and $7.3 million in the prior quarter. Fully diluted earnings per share was $0.05 for the third quarter of 2025 compared to $0.39 in the prior year period and $0.32 in the prior quarter.
Adjusted EBITDA(1) for the third quarter of 2025 was $16.8 million, a decrease of $8.3 million from $25.1 million in the prior year period, and a decrease of $3.8 million from $20.6 million in the prior quarter. The year over year decrease was driven by lower activity levels from both the prior quarter and the prior year quarter as well as certain non-cash inventory adjustments recorded during the third quarter.
BUSINESS SEGMENT FINANCIAL RESULTS
High Specification Rigs
High Specification Rigs segment revenue was $80.9 million in the third quarter of 2025, a decrease of $5.8 million relative to the prior year period and $5.4 million relative to the prior quarter. Rig hours were down to 111,200 from 116,900 in the prior year period and from 117,000 in the prior quarter. Rig hours were down as a consequence of reduction in completion related work and softness in our northern region. Hourly rig rates slightly decreased by 2% to $727 from $741 in the prior year period and from $738 per hour in the prior quarter, a reflection of an increase in standby hours at lower rates during the third quarter of 2025 as customers chose to hold more rigs idle between projects.
Operating income was $10.0 million in the third quarter of 2025, a decrease of $3.8 million, or 28%, compared to $13.8 million in the prior year period, and a decrease of $2.0 million, or 17%, compared to the prior quarter. Adjusted EBITDA(1) was $15.7 million in the third quarter, down from $19.2 million in the prior year period and from $17.6 million in the prior quarter.
Processing Solutions and Ancillary Services
Processing Solutions and Ancillary Services segment revenue was $30.8 million in the third quarter of 2025, down $1.4 million, or 4%, from $32.2 million in the prior quarter and down $5.2 million, or 14% from $36.0 million for the prior year period. The decrease from the prior year period was largely attributable to reductions in operational activity within coil tubing which is completions focused and declines in our P&A service line year over year as customers have cut back on any non-essential spending. The decrease from the prior quarter was similarly attributable to activity declines in our coil tubing service and some contract roll-over delays in the Torrent service line offset by more recent improvements in P&A activity.
Operating income was $3.4 million in the third quarter of 2025, down from $6.6 million in the prior year period and from $4.5 million in the prior quarter. Adjusted EBITDA(1) was $5.5 million, down from $8.8 million in the prior year period and from $6.6 million in the prior quarter.
Wireline Services
Wireline Services segment revenue was $17.2 million in the third quarter of 2025, a decline of $13.1 million, or 43%, compared to $30.3 million in the prior year period, and a decline of $4.9 million, or 22%, from $22.1 million in the prior quarter. Our Completions service line reported 1,800 completed stage counts, a decrease of 28% compared to 2,500 in both the prior year period and the prior quarter.
Operating loss was $4.2 million in the third quarter of 2025, compared to a breakeven in the prior year period and an operating loss of $1.2 million in the prior quarter. Adjusted EBITDA(1) was $0.4 million, down from $2.7 million in the prior year period and $1.6 million for the prior quarter. Operating income was impacted by non-cash items related to inventory adjustments for explosives within the completions service line.
BALANCE SHEET, CASH FLOW AND LIQUIDITY
As of September 30, 2025, total liquidity was $116.7 million, consisting of $71.5 million of capacity on its revolving credit facility and $45.2 million of cash on hand. This compares to December 31, 2024 when the Company had $112.1 million of liquidity, consisting of $71.2 million of capacity on its revolving credit facility and $40.9 million of cash on hand. The Company had no borrowings under its loan facility as of September 30, 2025.
Cash provided by Operating Activities for the year to date period through September 2025 was $44.9 million, compared to $51.8 million in the same period of 2024. The Company has had capital expenditures totaling $19.1 million for the 2025 year to date period, compared to $28.7 million in the prior year period. Part of this investment includes milestone payments to the announced Ranger ECHO rigs.
The Company’s Free Cash Flow(2) of $25.8 million for year to date 2025 compares to Free Cash Flow(2) of $23.1 million in the prior year period, primarily due to reduced capital expenditures.
Conference Call
The Company will host a conference call to discuss its third quarter 2025 results on Monday, November 10, 2025, at 9:00 a.m. Central Time (10:00 a.m. Eastern Time). To join the conference call from within the United States, participants may dial 1-833-255-2829, or participants may dial 1-412-902-6710 from outside the United States. To listen via live webcast, please visit the Investor Relations section of the Company’s website, www.rangerenergy.com
. Participants are encouraged to log in to the webcast or dial in to the conference call prior to the start time. An audio replay of the conference call will be available shortly after the conclusion of the call and will remain available for approximately seven days through the Investor Relations section of the Company’s website.
About Ranger Energy Services, Inc.
Ranger is one of the largest providers of high specification mobile rig well services, cased hole wireline services, and ancillary services in the U.S. oil and gas industry. Our services facilitate operations throughout the lifecycle of a well, including the completion, production, maintenance, intervention, workover and abandonment phases.
Cautionary Statement Concerning Forward-Looking Statements
Certain statements contained in this press release constitute “forward-looking statements” within the meaning of Section 27A of the Securities Act of 1933, as amended, and Section 21E of the Securities Exchange Act of 1934, as amended. All statements, other than statements of historical fact included in this press release, regarding our strategy, future operations, financial position, estimated revenue and losses, projected costs, prospects, plans and objectives of management are forward-looking statements. When used in this press release, the words “may,” “should,” “intend,” “could,” “believe,” “anticipate,” “estimate,” “expect,” “outlook,” “project” and similar expressions are intended to identify forward-looking statements, although not all forward-looking statements contain such identifying words. These forward-looking statements represent Ranger’s expectations or beliefs concerning future events, and it is possible that the results described in this press release will not be achieved. These forward-looking statements are subject to risks, uncertainties and other factors, many of which are outside of Ranger’s control. Should one or more of these risks or uncertainties described occur, or should underlying assumptions prove incorrect, our actual results and plans could differ materially from those expressed in any forward-looking statements.
Our future results will depend upon various other risks and uncertainties, including, but not limited to, those detailed in our current and past filings with the U.S. Securities and Exchange Commission (“SEC”). These documents are available through our website or through the SEC’s Electronic Data Gathering and Analysis Retrieval system at www.sec.gov
. These risks include, but are not limited to, the risks described under “Part I, Item 1A, Risk Factors” in our Annual Report on 10-K filed with the SEC on March 5, 2024, and those set forth from time-to-time in other filings by the Company with the SEC.
All forward looking statements, expressed or implied, included in this press release are expressly qualified in their entirety by this cautionary statement. This cautionary statement should also be considered in connection with any subsequent written or oral forward-looking statements that we or persons acting on our behalf may issue. Except as otherwise required by applicable law, any forward-looking statement speaks only as of the date on which it is made. We disclaim any duty to update any forward-looking statements, all of which are expressly qualified by the statements in this cautionary statement, to reflect events or circumstances after the date of this press release.
RANGER ENERGY SERVICES, INC.
UNAUDITED CONDENSED CONSOLIDATED STATEMENTS OF OPERATIONS
(in millions, except share and per share amounts)
|
|
|
|
|
|
|
|
|
|
|
|
|
|
|
|
|
|
|
|
|
|
|
Three Months Ended June 30, |
|
|
|
Three Months Ended September 30, |
|
|
|
|
|
|
|
Nine Months Ended September 30, |
|
|
|
|
|
|
|
|
|
2025 |
|
|
|
2025 |
|
|
|
2024 |
|
|
|
2025 |
|
|
|
2024 |
|
| Revenue |
|
|
|
|
|
|
|
|
|
|
|
|
|
|
|
|
|
|
|
|
| High Specification Rigs |
|
$ |
86.3 |
|
|
$ |
80.9 |
|
|
$ |
86.7 |
|
|
$ |
254.7 |
|
|
$ |
249.1 |
|
| Wireline Services |
|
|
22.1 |
|
|
|
17.2 |
|
|
|
30.3 |
|
|
|
56.5 |
|
|
|
87.6 |
|
| Processing Solutions and Ancillary Services |
|
|
32.2 |
|
|
|
30.8 |
|
|
|
36.0 |
|
|
|
93.5 |
|
|
|
91.3 |
|
| Total revenue |
|
|
140.6 |
|
|
|
128.9 |
|
|
|
153.0 |
|
|
|
404.7 |
|
|
|
428.0 |
|
|
|
|
|
|
|
|
|
|
|
|
|
|
|
|
|
|
|
|
|
|
| Operating expenses |
|
|
|
|
|
|
|
|
|
|
|
|
|
|
|
|
|
|
|
|
| Cost of services (exclusive of depreciation and amortization): |
|
|
|
|
|
|
|
|
|
|
|
|
|
|
|
|
|
|
|
|
| High Specification Rigs |
|
|
68.7 |
|
|
|
65.2 |
|
|
|
67.2 |
|
|
|
204.0 |
|
|
|
198.8 |
|
| Wireline Services |
|
|
20.7 |
|
|
|
18.6 |
|
|
|
27.6 |
|
|
|
59.6 |
|
|
|
84.4 |
|
| Processing Solutions and Ancillary Services |
|
|
25.6 |
|
|
|
25.3 |
|
|
|
27.2 |
|
|
|
75.9 |
|
|
|
72.8 |
|
| Total cost of services |
|
|
115.0 |
|
|
|
109.1 |
|
|
|
122.0 |
|
|
|
339.5 |
|
|
|
356.0 |
|
| General and administrative |
|
|
7.0 |
|
|
|
6.6 |
|
|
|
7.1 |
|
|
|
20.7 |
|
|
|
20.7 |
|
| Depreciation and amortization |
|
|
10.9 |
|
|
|
11.0 |
|
|
|
11.1 |
|
|
|
32.5 |
|
|
|
33.3 |
|
| Impairment of assets |
|
|
— |
|
|
|
— |
|
|
|
— |
|
|
|
0.4 |
|
|
|
— |
|
| Gain on sale of assets |
|
|
(0.9 |
) |
|
|
(0.4 |
) |
|
|
(0.1 |
) |
|
|
(0.6 |
) |
|
|
(1.7 |
) |
| Total operating expenses |
|
|
132.0 |
|
|
|
126.3 |
|
|
|
140.1 |
|
|
|
392.5 |
|
|
|
408.3 |
|
|
|
|
|
|
|
|
|
|
|
|
|
|
|
|
|
|
|
|
|
|
| Operating income |
|
|
8.6 |
|
|
|
2.6 |
|
|
|
12.9 |
|
|
|
12.2 |
|
|
|
19.7 |
|
|
|
|
|
|
|
|
|
|
|
|
|
|
|
|
|
|
|
|
|
|
| Other income and expenses |
|
|
|
|
|
|
|
|
|
|
|
|
|
|
|
|
|
|
|
|
| Interest expense, net |
|
|
0.1 |
|
|
|
0.4 |
|
|
|
0.7 |
|
|
|
1.0 |
|
|
|
2.1 |
|
| Other income, net |
|
|
— |
|
|
|
(0.3 |
) |
|
|
— |
|
|
|
(1.9 |
) |
|
|
— |
|
| Total other expenses (income), net |
|
|
(1.5 |
) |
|
|
0.1 |
|
|
|
0.7 |
|
|
|
(0.9 |
) |
|
|
2.1 |
|
|
|
|
|
|
|
|
|
|
|
|
|
|
|
|
|
|
|
|
|
|
| Income before income tax expense |
|
|
10.1 |
|
|
|
2.5 |
|
|
|
12.2 |
|
|
|
13.1 |
|
|
|
17.6 |
|
| Income tax expense |
|
|
2.8 |
|
|
|
1.3 |
|
|
|
3.5 |
|
|
|
4.0 |
|
|
|
5.0 |
|
| Net income |
|
|
7.3 |
|
|
|
1.2 |
|
|
|
8.7 |
|
|
|
9.1 |
|
|
|
12.6 |
|
|
|
|
|
|
|
|
|
|
|
|
|
|
|
|
|
|
|
|
|
|
| Income per common share: |
|
|
|
|
|
|
|
|
|
|
|
|
|
|
|
|
|
|
|
|
| Basic |
|
$ |
0.33 |
|
|
$ |
0.06 |
|
|
$ |
0.39 |
|
|
$ |
0.41 |
|
|
$ |
0.56 |
|
| Diluted |
|
$ |
0.32 |
|
|
$ |
0.05 |
|
|
$ |
0.39 |
|
|
$ |
0.40 |
|
|
$ |
0.55 |
|
| Weighted average common shares outstanding |
|
|
|
|
|
|
|
|
|
|
|
|
|
|
|
|
|
|
|
|
| Basic |
|
|
22,457,455 |
|
|
|
21,769,012 |
|
|
|
22,241,847 |
|
|
|
22,208,218 |
|
|
|
22,608,796 |
|
| Diluted |
|
|
22,673,369 |
|
|
|
22,082,764 |
|
|
|
22,494,453 |
|
|
|
22,520,080 |
|
|
|
22,731,259 |
|
RANGER ENERGY SERVICES, INC.
UNAUDITED CONDENSED CONSOLIDATED BALANCE SHEETS
(in millions, except share and per share amounts)
|
|
|
|
|
|
|
|
|
|
|
September 30, 2025 |
|
|
|
December 31, 2024 |
|
|
| Assets |
|
|
|
|
|
|
|
|
| Cash and cash equivalents |
|
$ |
45.2 |
|
|
$ |
40.9 |
|
| Accounts receivable, net |
|
|
74.1 |
|
|
|
68.4 |
|
| Contract assets |
|
|
15.7 |
|
|
|
16.7 |
|
| Inventory |
|
|
4.0 |
|
|
|
5.7 |
|
| Prepaid expenses and other current assets |
|
|
7.8 |
|
|
|
11.4 |
|
| Assets held for sale |
|
|
0.4 |
|
|
|
0.8 |
|
| Total current assets |
|
|
147.2 |
|
|
|
143.9 |
|
|
|
|
|
|
|
|
|
|
| Property and equipment, net |
|
|
214.9 |
|
|
|
224.3 |
|
| Intangible assets, net |
|
|
5.0 |
|
|
|
5.6 |
|
| Operating leases, right-of-use assets |
|
|
4.9 |
|
|
|
7.0 |
|
| Other assets |
|
|
0.8 |
|
|
|
0.8 |
|
| Total assets |
|
$ |
372.8 |
|
|
$ |
381.6 |
|
|
|
|
|
|
|
|
|
|
| Liabilities and Stockholders' Equity |
|
|
|
|
|
|
|
|
| Accounts payable |
|
|
24.3 |
|
|
|
27.2 |
|
| Accrued expenses |
|
|
25.5 |
|
|
|
28.2 |
|
| Other financing liability, current portion |
|
|
0.7 |
|
|
|
0.7 |
|
| Short-term lease liability |
|
|
8.5 |
|
|
|
8.7 |
|
| Other current liabilities |
|
|
0.7 |
|
|
|
0.4 |
|
| Total current liabilities |
|
|
59.7 |
|
|
|
65.2 |
|
|
|
|
|
|
|
|
|
|
| Long-term lease liability |
|
|
11.4 |
|
|
|
14.1 |
|
| Other financing liability |
|
|
9.8 |
|
|
|
10.3 |
|
| Deferred tax liability |
|
|
21.8 |
|
|
|
18.2 |
|
| Other long-term liabilities |
|
|
0.1 |
|
|
|
— |
|
| Total liabilities |
|
$ |
102.8 |
|
|
$ |
107.8 |
|
|
|
|
|
|
|
|
|
|
| Commitments and contingencies |
|
|
|
|
|
|
|
|
|
|
|
|
|
|
|
|
|
| Stockholders' equity |
|
|
|
|
|
|
|
|
| Preferred stock, $0.01 per share; 50,000,000 shares authorized; no shares issued and outstanding as of September 30, 2025 and December 31, 2024 |
|
|
— |
|
|
|
— |
|
| Class A Common Stock, $0.01 par value, 100,000,000 shares authorized; 26,435,100 shares issued and 21,611,872 shares outstanding as of September 30, 2025; 26,130,574 shares issued and 22,252,946 shares outstanding as of December 31, 2024 |
|
|
0.3 |
|
|
|
0.3 |
|
| Class B Common Stock, $0.01 par value, 100,000,000 shares authorized; no shares issued or outstanding as of September 30, 2025 and December 31, 2024 |
|
|
— |
|
|
|
— |
|
| Less: Class A Common Stock held in treasury at cost; 4,823,228 treasury shares as of September 30, 2025 and 3,877,628 treasury shares as of December 31, 2024 |
|
|
(50.2 |
) |
|
|
(38.6 |
) |
| Retained earnings |
|
|
47.2 |
|
|
|
42.2 |
|
| Additional paid-in capital |
|
|
272.7 |
|
|
|
269.9 |
|
| Total controlling stockholders' equity |
|
|
270.0 |
|
|
|
273.8 |
|
| Total liabilities and stockholders' equity |
|
$ |
372.8 |
|
|
$ |
381.6 |
|
RANGER ENERGY SERVICES, INC.
UNAUDITED CONDENSED CONSOLIDATED STATEMENT OF CASH FLOWS
(in millions)
|
|
|
|
|
|
|
|
|
|
|
Nine Months Ended September 30, |
|
|
|
|
|
|
|
|
|
2025 |
|
|
|
2024 |
|
| Cash Flows from Operating Activities |
|
|
|
|
|
|
|
|
| Net income |
|
$ |
9.1 |
|
|
$ |
12.6 |
|
| Adjustments to reconcile net income to net cash provided by operating activities: |
|
|
|
|
|
|
|
|
| Depreciation and amortization |
|
|
32.5 |
|
|
|
33.3 |
|
| Equity based compensation |
|
|
4.9 |
|
|
|
4.2 |
|
| Gain on sale of assets |
|
|
(0.6 |
) |
|
|
(1.7 |
) |
| Impairment of assets |
|
|
0.4 |
|
|
|
— |
|
| Deferred income tax expense |
|
|
3.6 |
|
|
|
4.7 |
|
| Other expenses |
|
|
2.0 |
|
|
|
0.6 |
|
| Changes in operating assets and liabilities |
|
|
|
|
|
|
|
|
| Accounts receivable, net |
|
|
(6.0 |
) |
|
|
3.3 |
|
| Contract assets |
|
|
1.0 |
|
|
|
(6.0 |
) |
| Inventory |
|
|
(0.1 |
) |
|
|
0.6 |
|
| Prepaid expenses and other current assets |
|
|
3.6 |
|
|
|
3.6 |
|
| Other assets |
|
|
1.7 |
|
|
|
1.4 |
|
| Accounts payable |
|
|
(2.9 |
) |
|
|
(1.5 |
) |
| Accrued expenses |
|
|
(2.6 |
) |
|
|
(2.5 |
) |
| Other current liabilities |
|
|
(1.8 |
) |
|
|
(1.9 |
) |
| Other long-term liabilities |
|
|
0.1 |
|
|
|
1.1 |
|
| Net cash provided by operating activities |
|
|
44.9 |
|
|
|
51.8 |
|
|
|
|
|
|
|
|
|
|
| Cash Flows from Investing Activities |
|
|
|
|
|
|
|
|
| Purchase of property and equipment |
|
|
(19.1 |
) |
|
|
(28.7 |
) |
| Proceeds from disposal of property and equipment |
|
|
1.6 |
|
|
|
1.5 |
|
| Net cash used in investing activities |
|
|
(17.5 |
) |
|
|
(27.2 |
) |
|
|
|
|
|
|
|
|
|
| Cash Flows from Financing Activities |
|
|
|
|
|
|
|
|
| Borrowings under Revolving Credit Facility |
|
|
0.3 |
|
|
|
25.3 |
|
| Principal payments on Revolving Credit Facility |
|
|
(0.3 |
) |
|
|
(25.3 |
) |
| Principal payments on financing lease obligations |
|
|
(5.1 |
) |
|
|
(4.2 |
) |
| Principal payments on other financing liabilities |
|
|
(0.5 |
) |
|
|
(0.5 |
) |
| Dividends paid to Class A Common Stock shareholders |
|
|
(4.1 |
) |
|
|
(3.4 |
) |
| Shares withheld for equity compensation |
|
|
(1.9 |
) |
|
|
(1.8 |
) |
| Payments on Other Installment Purchases |
|
|
— |
|
|
|
(0.1 |
) |
| Repurchase of Class A Common Stock |
|
|
(11.5 |
) |
|
|
(15.5 |
) |
| Net cash used in financing activities |
|
|
(23.1 |
) |
|
|
(25.5 |
) |
|
|
|
|
|
|
|
|
|
| Increase (decrease) in cash and cash equivalents |
|
|
4.3 |
|
|
|
(0.9 |
) |
| Cash and cash equivalents, Beginning of Period |
|
|
40.9 |
|
|
|
15.7 |
|
| Cash and cash equivalents, End of Period |
|
$ |
45.2 |
|
|
$ |
14.8 |
|
|
|
|
|
|
|
|
|
|
| Supplemental Cash Flow Information |
|
|
|
|
|
|
|
|
| Interest paid |
|
$ |
1.5 |
|
|
$ |
1.4 |
|
| Supplemental Disclosure of Non-cash Investing and Financing Activities |
|
|
|
|
|
|
|
|
| Capital expenditures included in accounts payable and accrued liabilities |
|
$ |
0.1 |
|
|
$ |
0.6 |
|
| Additions to fixed assets through installment purchases and financing leases |
|
$ |
(4.2 |
) |
|
$ |
(5.0 |
) |
| Additions to fixed assets through asset trades |
|
$ |
(1.6 |
) |
|
$ |
(4.2 |
) |
RANGER ENERGY SERVICES, INC.
SUPPLEMENTAL NON-GAAP FINANCIAL MEASURES
(UNAUDITED)
Note Regarding Non‑GAAP Financial Measure
The Company utilizes certain non-GAAP financial measures that management believes to be insightful in understanding the Company’s financial results. These financial measures, which include Adjusted EBITDA and Free Cash Flow, should not be construed as being more important than, or as an alternative for, comparable U.S. GAAP financial measures. Detailed reconciliations of these non-GAAP financial measures to comparable U.S. GAAP financial measures have been included below and are available in the Investor Relations sections of our website at www.rangerenergy.com
. Our presentation of Adjusted EBITDA and Free Cash Flow should not be construed as an indication that our results will be unaffected by the items excluded from the reconciliations. Our computations of these non-GAAP financial measures may not be identical to other similarly titled measures of other companies.
Adjusted EBITDA
We believe Adjusted EBITDA is a useful performance measure because it allows for an effective evaluation of our operating performance when compared to our peers, without regard to our financing methods or capital structure. We exclude the items listed below from net income or loss in arriving at Adjusted EBITDA because these amounts can vary substantially within our industry depending upon accounting methods, book values of assets, capital structures and the method by which the assets were acquired. Certain items excluded from Adjusted EBITDA are significant components in understanding and assessing a company’s financial performance, such as a company’s cost of capital and tax structure, as well as the historic costs of depreciable assets, none of which are reflected in Adjusted EBITDA.
We define Adjusted EBITDA as net income or loss before net interest expense, income tax expense, depreciation and amortization, equity‑based compensation, acquisition‑related costs, severance and reorganization costs, gain or loss on sale of assets, significant and unusual legal fees and settlements, impairment of assets, employee retention credit, inventory adjustment, and certain other non‑cash and certain other items that we do not view as indicative of our ongoing performance.
The following tables are a reconciliation of net income or loss to Adjusted EBITDA for the respective periods, in millions:
|
|
|
|
|
|
|
|
|
|
|
|
|
|
|
|
|
|
|
|
|
High Specification Rigs |
|
|
Wireline Services |
|
|
|
Processing Solutions andAncillary Services |
|
|
Other |
|
|
|
Total |
|
|
|
|
Three Months Ended September 30, 2025 |
|
|
|
|
|
|
|
|
|
|
|
|
|
|
|
|
| Net income (loss) |
|
$ |
10.0 |
|
$ |
(4.2 |
) |
|
$ |
3.4 |
|
$ |
(8.0 |
) |
|
$ |
1.2 |
|
| Interest expense, net |
|
|
— |
|
|
— |
|
|
|
— |
|
|
0.4 |
|
|
|
0.4 |
|
| Income tax expense |
|
|
— |
|
|
— |
|
|
|
— |
|
|
1.3 |
|
|
|
1.3 |
|
| Depreciation and amortization |
|
|
5.7 |
|
|
2.8 |
|
|
|
2.1 |
|
|
0.4 |
|
|
|
11.0 |
|
| EBITDA |
|
|
15.7 |
|
|
(1.4 |
) |
|
|
5.5 |
|
|
(5.9 |
) |
|
|
13.9 |
|
| Equity based compensation |
|
|
— |
|
|
— |
|
|
|
— |
|
|
1.6 |
|
|
|
1.6 |
|
| Gain on sale of assets |
|
|
— |
|
|
— |
|
|
|
— |
|
|
(0.4 |
) |
|
|
(0.4 |
) |
| Severance and reorganization costs |
|
|
— |
|
|
0.1 |
|
|
|
— |
|
|
— |
|
|
|
0.1 |
|
| Acquisition related costs |
|
|
— |
|
|
0.1 |
|
|
|
— |
|
|
— |
|
|
|
0.1 |
|
| Employee retention credit |
|
|
— |
|
|
— |
|
|
|
— |
|
|
(0.3 |
) |
|
|
(0.3 |
) |
| Inventory adjustment |
|
|
— |
|
|
1.6 |
|
|
|
— |
|
|
— |
|
|
|
1.6 |
|
| Adjusted EBITDA |
|
$ |
15.7 |
|
$ |
0.4 |
|
|
$ |
5.5 |
|
$ |
(4.8 |
) |
|
$ |
16.8 |
|
|
|
|
|
|
|
|
|
|
|
|
|
|
|
|
|
|
|
|
|
|
High Specification Rigs |
|
|
Wireline Services |
|
|
|
Processing Solutions and Ancillary Services |
|
|
Other |
|
|
|
Total |
|
|
|
|
Three Months Ended June 30, 2025 |
|
|
|
|
|
|
|
|
|
|
|
|
|
|
|
|
| Net income (loss) |
|
$ |
12.0 |
|
$ |
(1.2 |
) |
|
$ |
4.5 |
|
$ |
(8.0 |
) |
|
$ |
7.3 |
|
| Interest expense, net |
|
|
— |
|
|
— |
|
|
|
— |
|
|
0.1 |
|
|
|
0.1 |
|
| Income tax expense |
|
|
— |
|
|
— |
|
|
|
— |
|
|
2.8 |
|
|
|
2.8 |
|
| Depreciation and amortization |
|
|
5.6 |
|
|
2.6 |
|
|
|
2.1 |
|
|
0.6 |
|
|
|
10.9 |
|
| EBITDA |
|
|
17.6 |
|
|
1.4 |
|
|
|
6.6 |
|
|
(4.5 |
) |
|
|
21.1 |
|
| Equity based compensation |
|
|
— |
|
|
— |
|
|
|
— |
|
|
1.7 |
|
|
|
1.7 |
|
| Gain on sale of assets |
|
|
— |
|
|
— |
|
|
|
— |
|
|
(0.9 |
) |
|
|
(0.9 |
) |
| Severance and reorganization costs |
|
|
— |
|
|
— |
|
|
|
— |
|
|
0.1 |
|
|
|
0.1 |
|
| Acquisition related costs |
|
|
— |
|
|
0.2 |
|
|
|
— |
|
|
— |
|
|
|
0.2 |
|
| Employee retention credit |
|
|
— |
|
|
— |
|
|
|
— |
|
|
(1.6 |
) |
|
|
(1.6 |
) |
| Adjusted EBITDA |
|
$ |
17.6 |
|
$ |
1.6 |
|
|
$ |
6.6 |
|
$ |
(5.2 |
) |
|
$ |
20.6 |
|
|
|
|
|
|
|
|
|
|
|
|
|
|
|
|
|
|
|
|
|
|
High Specification Rigs |
|
|
|
Wireline Services |
|
|
Processing Solutions and Ancillary Services |
|
|
Other |
|
|
|
Total |
|
|
|
|
Three Months Ended September 30, 2024 |
|
|
|
|
|
|
|
|
|
|
|
|
|
|
|
|
| Net income (loss) |
|
$ |
13.8 |
|
|
$ |
— |
|
$ |
6.6 |
|
$ |
(11.7 |
) |
|
$ |
8.7 |
|
| Interest expense, net |
|
|
— |
|
|
|
— |
|
|
— |
|
|
0.7 |
|
|
|
0.7 |
|
| Income tax expense |
|
|
— |
|
|
|
— |
|
|
— |
|
|
3.5 |
|
|
|
3.5 |
|
| Depreciation and amortization |
|
|
5.7 |
|
|
|
2.7 |
|
|
2.2 |
|
|
0.5 |
|
|
|
11.1 |
|
| EBITDA |
|
|
19.5 |
|
|
|
2.7 |
|
|
8.8 |
|
|
(7.0 |
) |
|
|
24.0 |
|
| Equity based compensation |
|
|
— |
|
|
|
— |
|
|
— |
|
|
1.4 |
|
|
|
1.4 |
|
| Gain on sale of assets |
|
|
— |
|
|
|
— |
|
|
— |
|
|
(0.1 |
) |
|
|
(0.1 |
) |
| Legal fees and settlements |
|
|
(0.3 |
) |
|
|
— |
|
|
— |
|
|
0.1 |
|
|
|
(0.2 |
) |
| Adjusted EBITDA |
|
$ |
19.2 |
|
|
$ |
2.7 |
|
$ |
8.8 |
|
$ |
(5.6 |
) |
|
$ |
25.1 |
|
|
|
|
|
|
|
|
|
|
|
|
|
|
|
|
|
|
|
|
|
|
High Specification Rigs |
|
|
Wireline Services |
|
|
|
Processing Solutions and Ancillary Services |
|
|
Other |
|
|
|
Total |
|
|
|
T |
Nine Months Ended September 30, 2025 |
|
|
|
|
|
|
|
|
|
|
|
|
|
|
|
|
| Net income (loss) |
|
$ |
34.0 |
|
$ |
(11.2 |
) |
|
$ |
11.2 |
|
$ |
(24.9 |
) |
|
$ |
9.1 |
|
| Interest expense, net |
|
|
— |
|
|
— |
|
|
|
— |
|
|
1.0 |
|
|
|
1.0 |
|
| Income tax expense |
|
|
— |
|
|
— |
|
|
|
— |
|
|
4.0 |
|
|
|
4.0 |
|
| Depreciation and amortization |
|
|
16.7 |
|
|
8.1 |
|
|
|
6.4 |
|
|
1.3 |
|
|
|
32.5 |
|
| EBITDA |
|
|
50.7 |
|
|
(3.1 |
) |
|
|
17.6 |
|
|
(18.6 |
) |
|
|
46.6 |
|
| Impairment of assets |
|
|
— |
|
|
— |
|
|
|
— |
|
|
0.4 |
|
|
|
0.4 |
|
| Equity based compensation |
|
|
— |
|
|
— |
|
|
|
— |
|
|
4.8 |
|
|
|
4.8 |
|
| Gain on sale of assets |
|
|
— |
|
|
— |
|
|
|
— |
|
|
(0.6 |
) |
|
|
(0.6 |
) |
| Severance and reorganization costs |
|
|
— |
|
|
0.7 |
|
|
|
— |
|
|
0.1 |
|
|
|
0.8 |
|
| Acquisition related costs |
|
|
— |
|
|
0.5 |
|
|
|
0.1 |
|
|
0.1 |
|
|
|
0.7 |
|
| Legal fees and settlements |
|
|
— |
|
|
— |
|
|
|
— |
|
|
0.5 |
|
|
|
0.5 |
|
| Employee retention credit |
|
|
— |
|
|
— |
|
|
|
— |
|
|
(1.9 |
) |
|
|
(1.9 |
) |
| Inventory adjustment |
|
|
— |
|
|
1.6 |
|
|
|
— |
|
|
— |
|
|
|
1.6 |
|
| Adjusted EBITDA |
|
$ |
50.7 |
|
$ |
(0.3 |
) |
|
$ |
17.7 |
|
$ |
(15.2 |
) |
|
$ |
52.9 |
|
|
|
|
|
|
|
|
|
|
|
|
|
|
|
|
|
|
|
|
|
|
High Specification Rigs |
|
|
Wireline Services |
|
|
|
Processing Solutions and Ancillary Services |
|
|
Other |
|
|
|
Total |
|
|
|
|
Nine Months Ended September 30, 2024 |
|
|
|
|
|
|
|
|
|
|
|
|
|
|
|
|
| Net income (loss) |
|
$ |
33.4 |
|
$ |
(5.5 |
) |
|
$ |
12.3 |
|
$ |
(27.6 |
) |
|
$ |
12.6 |
|
| Interest expense, net |
|
|
— |
|
|
— |
|
|
|
— |
|
|
2.1 |
|
|
|
2.1 |
|
| Income tax expense |
|
|
— |
|
|
— |
|
|
|
— |
|
|
5.0 |
|
|
|
5.0 |
|
| Depreciation and amortization |
|
|
16.9 |
|
|
8.7 |
|
|
|
6.2 |
|
|
1.5 |
|
|
|
33.3 |
|
| EBITDA |
|
|
50.3 |
|
|
3.2 |
|
|
|
18.5 |
|
|
(19.0 |
) |
|
|
53.0 |
|
| Equity based compensation |
|
|
— |
|
|
— |
|
|
|
— |
|
|
4.0 |
|
|
|
4.0 |
|
| Gain on sale of assets |
|
|
— |
|
|
— |
|
|
|
— |
|
|
(1.7 |
) |
|
|
(1.7 |
) |
| Severance and reorganization costs |
|
|
0.7 |
|
|
0.1 |
|
|
|
0.1 |
|
|
0.1 |
|
|
|
1.0 |
|
| Acquisition related costs |
|
|
0.3 |
|
|
— |
|
|
|
— |
|
|
0.1 |
|
|
|
0.4 |
|
| Legal fees and settlements |
|
|
0.2 |
|
|
— |
|
|
|
— |
|
|
0.1 |
|
|
|
0.3 |
|
| Adjusted EBITDA |
|
$ |
51.5 |
|
$ |
3.3 |
|
|
$ |
18.6 |
|
$ |
(16.4 |
) |
|
$ |
57.0 |
|
Free Cash Flow
We believe Free Cash Flow is an important financial measure for use in evaluating the Company’s financial performance, as it measures our ability to generate additional cash from our business operations. Free Cash Flow should be considered in addition to, rather than as a substitute for, net income as a measure of our performance or net cash provided by operating activities as a measure of our liquidity. Additionally, our definition of Free Cash Flow is limited and does not represent residual cash flows available for discretionary expenditures due to the fact that the measure does not deduct the payments required for debt service and other obligations or payments made for business acquisitions. Therefore, we believe it is important to view Free Cash Flow as supplemental to our entire statement of cash flows.
The following table is a reconciliation of consolidated operating cash flows to Free Cash Flow for the respective periods, in millions:
|
|
|
|
|
|
|
|
|
|
|
|
|
|
|
|
|
Three Months Ended |
|
|
|
|
|
|
|
Nine Months Ended |
|
|
|
|
|
|
|
September 30, 2025 |
|
|
|
September 30, 2024 |
|
|
|
September 30, 2025 |
|
|
|
September 30, 2024 |
|
|
| Net cash provided by operating activities |
$ |
13.6 |
|
|
$ |
17.7 |
|
|
$ |
44.9 |
|
|
$ |
51.8 |
|
| Purchase of property and equipment |
|
(5.6 |
) |
|
|
(6.9 |
) |
|
|
(19.1 |
) |
|
|
(28.7 |
) |
| Free Cash Flow |
$ |
8.0 |
|
|
$ |
10.8 |
|
|
$ |
25.8 |
|
|
$ |
23.1 |
|

View source version on businesswire.com: https://www.businesswire.com/news/home/20251107640155/en/
**Company Contact:
**Melissa Cougle
Executive Vice President and Chief Financial Officer
(713) 935-8900
[email protected]
Source: Ranger Energy Services, Inc.
<< Back to 2025
Copyright © 2026 Ranger Energy Services. All Rights Reserved.
Delivered by IDX