Detroit, Virginia Beach and Warren, MI are the fastest major metros to save for a first-home down payment. A typical household would need just 3.1 years to save the median first-time buyer down payment of $8,797 in Warren, 3.9 years to save $7,600 in…
-
Detroit, Virginia Beach and Warren, MI are the fastest major metros to save for a first-home down payment. A typical household would need just 3.1 years to save the median first-time buyer down payment of $8,797 in Warren, 3.9 years to save $7,600 in Detroit, and 4.3 years to save $20,450 in Virginia Beach.
-
New York City is the toughest market for first-time buyers to save for a down payment. A typical household would need 65 years to save the median first-time buyer down payment of $265,000. That’s followed by San Francisco (57.2 years; $400,000 down payment) and Los Angeles (41.5 years; $170,500 down payment).
-
A big reason it takes longer to save in expensive markets is that buyers typically put down much more money upfront. The median first-time buyer down payment equals 30% of the purchase price in New York City and 27% in San Francisco, versus about 5% in Detroit and Warren, dramatically increasing the amount buyers need to save before purchasing a new home.
First-time homebuyers in Detroit and nearby Warren, MI can save for a down payment in less than four years, making them the metros where first-time buyers can save up a down payment the fastest. They are followed by Virginia Beach, VA, Fort Worth, TX and Indianapolis, all places where it takes a little more than 4 years for first-time buyers to save for a down payment.
Metros Where First-Time Buyers Can Save for a Down Payment Fastest
| Rank | Metro | Estimated Years to Save up for a Down Payment | Median 1st-Time Homebuyer’s Down Payment ($) | Median 1st-Time Homebuyer’s Down Payment as a % of Home Purchase Price | Implied Median Home Price of First-Time Homebuyers | Median Annual Household Income |
| 1 | Warren, MI | 3.1 | $8,797 | 5.0% | $175,940 | $56,281 |
| 2 | Detroit, MI | 3.9 | $7,600 | 5.0% | $152,000 | $39,209 |
| 3 | Virginia Beach, VA | 4.3 | $20,450 | 6.3% | $323,993 | $94,579 |
| 4 | Fort Worth, TX | 4.3 | $17,867 | 5.8% | $306,589 | $82,503 |
| 5 | Indianapolis, IN | 4.4 | $14,600 | 5.6% | $261,273 | $66,900 |
| 6 | Milwaukee, WI | 4.4 | $12,375 | 5.0% | $247,500 | $56,792 |
| 7 | Jacksonville, FL | 4.7 | $17,121 | 6.2% | $277,717 | $72,389 |
| 8 | Cleveland, OH | 5.1 | $11,148 | 5.3% | $209,758 | $43,383 |
| 9 | Columbus, OH | 5.1 | $17,001 | 6.5% | $262,121 | $67,084 |
| 10 | West Palm Beach, FL | 5.3 | $19,569 | 5.7% | $344,521 | $74,478 |
This is according to a Rocket analysis that estimates the time it would take a typical household to save for a down payment on their first home purchase, assuming they save 5% of their annual income. Median household incomes are based on the 2024 American Community Survey by the U.S. Census Bureau. Estimated down payment amounts are based on Rocket Mortgage data on the median down payments made by its first-time homebuyer clients who purchased homes during the year ending on May 19, 2026.
At the other end of the spectrum, it can take several decades for aspiring first-time homebuyers in expensive coastal markets to save for a down payment. In New York City, where it takes the longest, it would take a typical household 65 years to save up $265,000, the median first-time homebuyer’s down payment. That’s followed by San Francisco at 57 years, and Los Angeles at 42 years.
Metros Where It Takes the Longest Time for First-Time Homebuyers to Save for a Down Payment
| Rank | Metro | Estimated Years to Save up for a Down Payment | Median 1st-Time Homebuyer’s Down Payment ($) | Median 1st-Time Homebuyer’s Down Payment as a % of Home Purchase Price | Implied Median Home Price of First-Time Homebuyers | Median Annual Household Income |
| 1 | New York City, NY | 65.2 | $265,000 | 30% | $883,333 | $81,228 |
| 2 | San Francisco, CA | 57.2 | $400,000 | 27% | $1,501,466 | $139,801 |
| 3 | Los Angeles, CA | 41.5 | $170,500 | 20% | $852,500 | $82,263 |
| 4 | Boston, MA | 37.8 | $185,000 | 23% | $819,573 | $97,791 |
| 5 | Anaheim, CA | 33.6 | $170,000 | 20% | $850,000 | $101,145 |
| 6 | San Jose, CA | 33.6 | $249,000 | 22% | $1,113,595 | $148,226 |
| 7 | San Diego, CA | 25.8 | $143,500 | 20% | $717,500 | $111,032 |
| 8 | Oakland, CA | 25.4 | $130,000 | 20% | $650,000 | $102,235 |
| 9 | Washington D.C. | 23.6 | $129,500 | 20% | $647,500 | $109,707 |
| 10 | Austin, TX | 21.2 | $95,700 | 20% | $478,500 | $90,430 |
“Saving for a down payment takes years of discipline, which is why receiving the keys is such a meaningful milestone,” said Bill Banfield, Rocket’s Chief Business Officer. “For anyone hoping to own a home someday, it’s never too early to understand what buyers are putting down in your market and start building a plan. Many first-time buyers are surprised to learn they may qualify for programs that make homeownership more affordable and, in many markets, the idea that you need 20% down is simply a myth. Our analysis found that down payments as low as 5% to 6% are common for conventional loans in some affordable markets.”
First-time homebuyers in expensive markets need much larger down payments, on a percentage basis, than those in more affordable areas
Across markets, down-payment percentages and home prices are strongly correlated. One reason is that larger down payments are often necessary to qualify for mortgages on high-priced homes. By putting more money down and reducing the loan amount, buyers can lower their monthly payment enough to meet a lender’s debt-to-income requirements.
“The time it takes to save up a down payment varies enormously by market,” Chen Zhao, Redfin Head of Economic Research, said. “Local home prices are driven by local incomes. In more affordable markets, buyers can accumulate a down payment much faster because home prices—and therefore down payment requirements—are significantly lower. That’s helping keep the dream of homeownership within reach for many.”
First-time buyers may also qualify for conventional loans with down payments as low as 3% or government-backed loans that require even less upfront cash. While putting more money down can reduce monthly payments and borrowing costs, lower down payment options can significantly shorten the time needed to save and help buyers begin building equity sooner.
A 5% down payment is the norm in parts of the Midwest, making saving faster and easier for first-time buyers.
Anne Loehr, a Redfin Premier agent in the Detroit area, which is one of the most affordable housing markets in the country, says most of the first-time buyers she works with put 5% down.
“I always tell my first-time homebuying clients to consider finding a home that’s under budget so they can reserve funds for the additional costs of owning a home, such as regular maintenance and unexpected repairs, which can amount to tens of thousands of dollars. Many first-time home buyers previously had landlords who took care of all of that,” Loehr said. “Having the right lender on our team is a huge part of that education and guidance first-timers need. The lender can often even source help with funding the home purchase, such as down payment assistance programs and first-time homebuyer grants.”
In the nation’s most expensive markets, buyers tend to have higher incomes and greater wealth, allowing them to contribute more money upfront.
In New York City, a 30% down payment is the norm and a big part of why it takes so long for first-time buyers to save up.
“The price point is so much higher in New York City than it is in most of the country. Since it takes a bit longer for first-time home buyers to save here, I’m now often helping mid-career professionals in their late 30s and early 40s to buy their first home after decades of renting,” Jason Warner, New York City-based Redfin agent, said.
“New York City is competitive by its nature, and inventory is squeezed right now because a lot of homeowners are locked in by low mortgage rates they got during the pandemic,” he added. “Sellers are looking not only for the highest offer, but for the one that’s most likely to close quickly and easily. A high down payment signals to the seller that you have the funds needed to close and you’re committed to the home. While a high down payment might not be as strong as an all-cash offer, it is a sign that a lender is likely going to be able to come through with funding your loan on time because you have cash handy and finances in order.”
New York City’s 65-year figure stands out even among expensive housing markets. Warner explains that likely has to do with the fact that in New York City, many co-op and condo buildings require down payments of 20% to 30%.
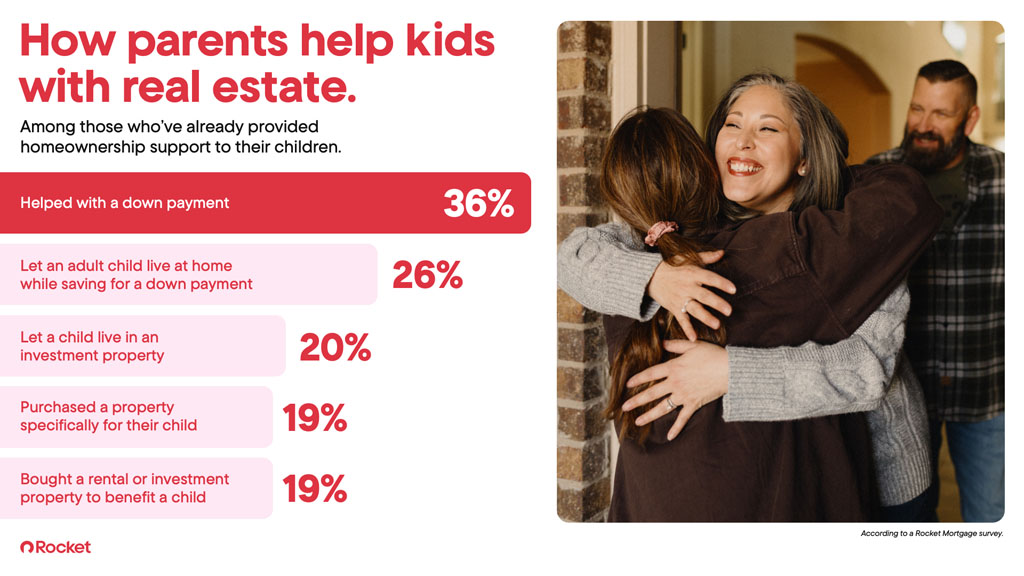
New York City-based Redfin agent Steve K. Kazoleas said a lot of his first-time buying clients get help from family to fund their down payment. A 2025 Redfin survey found that almost 24% of young Americans who recently bought a home used family money to help fund their down payment.
“Many of the first-time home buyers I’ve been working with are spending years saving while at the same time they’re dealing with high rental costs, which ultimately makes it hard for them to build wealth. As a result, I’ve been seeing buyers expand their searches,” he said.
Kazoleas always tells his clients that despite how difficult it might feel to buy a home, it’s important to always keep your lifestyle in mind when purchasing.
“I always encourage buyers to leave room in their budget for unexpected repairs, life events and things that might come up. Homeownership should improve your financial future, not create financial stress in your life. You should be living in your home, not for your home,” he said.
Full Metro Table: Estimated Years to Save for a First-Time Homebuyer Down Payment
| Metro | Estimated Years to Save up for a Down Payment | Median 1st-Time Homebuyer’s Down Payment ($) | Median 1st-Time Homebuyer’s Down Payment as a % of Home Purchase Price | Implied Median Home Price of First-Time Homebuyers | Median Annual Household Income |
| Anaheim, CA | 33.6 | $170,000 | 20% | $850,000 | $101,145 |
| Atlanta, GA | 6.8 | $29,970 | 9.6% | $310,817 | $88,165 |
| Austin, TX | 21.2 | $95,700 | 20% | $478,500 | $90,430 |
| Baltimore, MD | 6.2 | $20,000 | 7.7% | $260,917 | $64,778 |
| Boston, MA | 37.8 | $185,000 | 22.6% | $819,573 | $97,791 |
| Charlotte, NC | 9.3 | $40,000 | 10% | $400,000 | $86,416 |
| Chicago, IL | 8.7 | $35,125 | 10% | $351,250 | $80,613 |
| Cincinnati, OH | 8.3 | $23,500 | 8.1% | $289,917 | $56,910 |
| Cleveland, OH | 5.1 | $11,148 | 5.3% | $209,758 | $43,383 |
| Columbus, OH | 5.1 | $17,001 | 6.5% | $262,121 | $67,084 |
| Dallas, TX | 8.4 | $31,225 | 9.4% | $333,002 | $74,323 |
| Denver, CO | 12.8 | $59,000 | 12.7% | $466,100 | $92,504 |
| Detroit, MI | 3.9 | $7,600 | 5% | $152,000 | $39,209 |
| Fort Worth, TX | 4.3 | $17,867 | 5.8% | $306,589 | $82,503 |
| Houston, TX | 6.4 | $20,512 | 7.3% | $282,105 | $64,361 |
| Indianapolis, IN | 4.4 | $14,600 | 5.6% | $261,273 | $66,900 |
| Jacksonville, FL | 4.7 | $17,121 | 6.2% | $277,717 | $72,389 |
| Kansas City, MO | 6.2 | $21,750 | 7.3% | $298,399 | $69,958 |
| Las Vegas, NV | 6.1 | $23,886 | 5.3% | $447,471 | $78,556 |
| Los Angeles, CA | 41.5 | $170,500 | 20% | $852,500 | $82,263 |
| Miami, FL | 12.9 | $42,745 | 7.7% | $556,155 | $66,337 |
| Milwaukee, WI | 4.4 | $12,375 | 5% | $247,500 | $56,792 |
| Minneapolis, MN | 7.1 | $27,500 | 7.9% | $347,806 | $77,732 |
| Montgomery County, PA | 10 | $56,000 | 18.6% | $301,399 | $111,855 |
| Nashville, TN | 15 | $60,200 | 15.8% | $379,954 | $80,090 |
| Nassau County, NY | 21 | $150,000 | 20% | $750,000 | $143,144 |
| New Brunswick, NJ | 10.2 | $58,500 | 15% | $390,000 | $115,040 |
| New York, NY | 65.2 | $265,000 | 30% | $883,333 | $81,228 |
| Newark, NJ | 8.6 | $25,102 | 6.2% | $404,574 | $58,490 |
| Oakland, CA | 25.4 | $130,000 | 20% | $650,000 | $102,235 |
| Orlando, FL | 7.9 | $30,750 | 8.8% | $350,813 | $77,597 |
| Philadelphia, PA | 9.1 | $27,275 | 10% | $274,750 | $60,521 |
| Phoenix, AZ | 6.6 | $28,000 | 6.2% | $449,198 | $85,246 |
| Pittsburgh, PA | 6.2 | $20,715 | 9.1% | $226,817 | $66,954 |
| Portland, OR | 13 | $59,670 | 12.8% | $467,928 | $91,478 |
| Providence, RI | 20.6 | $63,750 | 15% | $425,000 | $61,797 |
| Riverside, CA | 8.1 | $36,600 | 5.4% | $681,232 | $90,004 |
| Sacramento, CA | 9.9 | $45,407 | 10% | $454,065 | $91,387 |
| Saint Louis, MO | 8.1 | $21,675 | 9.9% | $218,189 | $53,374 |
| San Antonio, TX | 5.6 | $18,628 | 7.2% | $258,948 | $66,176 |
| San Diego, CA | 25.8 | $143,500 | 20% | $717,500 | $111,032 |
| San Francisco, CA | 57.2 | $400,000 | 26.6% | $1,501,466 | $139,801 |
| San Jose, CA | 33.6 | $249,000 | 22% | $1,113,595 | $148,226 |
| Seattle, WA | 21.2 | $125,700 | 20% | $628,500 | $118,745 |
| Tampa, FL | 8.5 | $35,625 | 10% | $356,250 | $84,114 |
| Virginia Beach, VA | 4.3 | $20,450 | 6.3% | $323,993 | $94,579 |
| Warren, MI | 3.1 | $8,797 | 5% | $175,940 | $56,281 |
| Washington, D.C. | 23.6 | $129,500 | 20% | $647,500 | $109,707 |
| West Palm Beach, FL | 5.3 | $19,569 | 5.7% | $344,521 | $74,478 |
Methodology
This analysis ranks U.S. metros by estimated number of years it would take a typical first-time homebuyer to save enough for a typical down payment made by first-time homebuyers.
To estimate typical down payments for first-time homebuyers, we analyzed first-time homebuyer mortgage data from Rocket Mortgage purchase-loan originations closed between May 20, 2025 and May 19, 2026. Median down-payment amounts and down-payment percentages were calculated for first-time buyers in each market.
Median household income data came from the U.S. Census Bureau’s 2024 American Community Survey.
Years needed to save for a down payment was calculated by dividing the median down payment by 5% of median household income, reflecting a typical household saving 5% of its income annually.
Sign up for our newsletter!
Stay up-to-date and get important Press Releases from Rocket Companies.
Contact Us
Media RelationsInvestor Relations
Connect With Us
FacebookTwitterYouTubeLinkedIn