Q2 Holdings, Inc. is a provider of digital banking and financial technology solutions for financial institutions, FinTechs, and alternative finance companies. The company operates a unified, cloud-based software platform that delivers digital banking, digital lending, relationship pricing, risk and fraud management, and account switching services. Its portfolio includes the Q2 Innovation Studio and Helix, supporting retail, small to medium business, and commercial banking segments. Q2 serves banks, credit unions, and FinTechs in the United States and globally, with a customer base that includes a significant portion of top U.S. banks and credit unions. Founded over two decades ago, the company began by providing digital banking solutions to regional and community financial institutions before expanding its offerings through strategic investments and acquisitions. The platform utilizes a software-as-a-service model to facilitate scalable digital experiences and integration with core banking systems and third-party providers.

Summarised from the company's own disclosures, fiscal year ended Feb 2026

Industry Software - Application Homepage q2.com
Sector Technology IR page investors.q2.com/overview/default.aspx
Tags
digital banking, fintech, risk management, fraud prevention, lending, relationship pricing, saas, account switching, embedded banking, banking-as-a-service, Q2 Innovation Studio, Helix, Symphonix
Press page q2.com/company/newsroom

Metrics

Valuation  
Market cap $ 4.622B
Market cap (USD) $ 4.622B
P/E 44.01
PEG —
P/BV 7.03
P/S 5.31
P/OCF 18.84
P/FCF 19.84
Dividend yield —
Turnover / mcap —
Returns  
ROE 8.8%
ROI 5.4%
ROIC 3.9%
Profit margin 6.5%
Growth  
Revenue growing Yes
Profits growing Yes
Revenue up 3y Yes
Revenue up 5y Yes
Earnings growth 3y (net profit CAGR) —
Quality  
Profitable Yes
Margin expanding Yes
Buying back stock No
Diluting (TTM) No
Debt/Equity —
Podcast bulls (TTM) Sign up
Podcast bears (TTM) Sign up
Podcast sentiment (TTM) Sign up
Podcast sentiment % (TTM) Sign up
News sentiment (TTM) 37
Quality score 22.2%
Insiders  
Buys, 1w Sign up
Buys, 1m Sign up
Buys, 1y Sign up
Sells, 1w Sign up
Sells, 1m Sign up
Sells, 1y Sign up

Sign up to see this company's insider trades

Figure FY 2025 FY 2024 FY 2023 FY 2022 FY 2021 FY 2020 FY 2019 FY 2018 FY 2017 FY 2016 FY 2015 FY 2014 FY 2013
Revenue 794.809M 696.464M 624.624M 565.673M 498.72M 402.751M 315.484M 241.1M 193.978M 150.224M 108.867M 79.129M 56.872M
Net profit 52.008M -38.536M -65.384M -108.983M -112.746M -137.62M -70.877M -35.397M -26.164M -36.354M -25.063M -19.634M -17.875M
Free cash flow 194.651M 129.059M 64.619M 25.414M 11.171M -26.605M -13.293M -8.69M -2.843M -10.955M -1.729M -10.322M -12.645M

Figure FY 2025 FY 2024 FY 2023 FY 2022 FY 2021 FY 2020 FY 2019 FY 2018 FY 2017 FY 2016 FY 2015 FY 2014 FY 2013
Share price 72.16 100.65 43.41 26.87 79.44 126.53 81.08 49.55 36.85 28.85 26.37 18.84 —
Price performance 12m -0.28 1.32 0.62 -0.66 -0.37 0.56 0.64 0.34 0.28 0.09 0.4 — —

Filed figures

Figure Dec 2016 Dec 2017 Dec 2018 Dec 2019 Dec 2020 Dec 2021 Dec 2022 Dec 2023 Dec 2024 Dec 2025
Balance sheet detail
Trade receivables (USD) 12.2M 13.2M 19.7M 22.4M 36.4M 47M 46.7M 42.9M 42.1M 51.7M
↳ YoY growth +35.9% +7.9% +49.0% +14.1% +62.3% +29.0% -0.5% -8.2% -1.9% +22.9%
↳ 5y CAGR +16.8% +35.0% +32.2% +30.9% +28.8% +16.9% +13.4% +7.3%
Lease liabilities (USD) — — 200,000 45.2M 43.6M 70.4M 62.4M 56M 48.7M 42.7M
Cash and deposits (USD) 54.9M 58M 108M 100M 408M 323M 200M 230M 359M 368M
Intangible assets (USD) 15.2M 12M 63.3M 224M 185M 162M 146M 122M 94.6M 78.4M
Right-of-use assets (USD) — — — 35.4M 34.7M 52.3M 39.8M 35.5M 30.4M 27.2M
Cash flow detail
Operating cash flow (USD) 3.39M 9.47M 4.6M 567,000 -2.89M 30.9M 36.6M 70.3M 136M 201M
Purchases of property, plant and equipment (USD) -14.3M -12.3M -13.3M -13.9M -23.7M -19.8M -11.1M -5.67M -6.69M -6.81M
Purchases of intangible assets (USD) -323,000 -970,000 0.00 -177,000 -952,000 -5.87M -18.9M -25M -22.3M -21.3M
Change in receivables (cash effect) (USD) -3.25M -961,000 -4.68M 372,000 -14.6M -10.1M 286,000 4.09M 906,000 -9.94M
Change in payables (cash effect) (USD) 426,000 3.37M -263,000 1.13M -2.3M 1.76M -548,000 9.35M -9.79M 8.58M
Share buybacks (cash effect) (USD) — — — — — — — 0.00 0.00 -5M
Interest paid (cash effect) (USD) -217,000 -68,000 -810,000 -2.85M -4.1M -3.1M -2.89M -2.65M -2.68M -2.85M
Income taxes paid (cash effect) (USD) -120,000 -128,000 -215,000 1,000 -566,000 -1.03M -875,000 -2.62M -5.88M -3.84M
Share-based compensation (USD) 12.6M 20.9M 29.5M 40.5M 50.7M 55.9M 65.2M 79.2M 89.2M 86.9M
Operating cash flow before change in receivables (USD) 6.64M 10.4M 9.27M 195,000 11.7M 41M 36.3M 66.2M 135M 211M
Free cash flow (OCF - PPE - intangibles) (USD) -11.3M -3.81M -8.69M -13.5M -27.6M 5.31M 6.5M 39.6M 107M 173M
Income detail
Research and development expense (USD) 32.5M 40.3M 51.3M 76.3M 97.4M 117M 130M 137M 143M 154M
↳ 5y CAGR +50.0% +41.6% +44.5% +35.2% +29.2% +26.4% +21.8% +13.4% +9.6%
Total comprehensive income (USD) -36.3M -26.2M -35.3M -70.8M -138M -113M -112M -63.5M -39.3M 51.9M
Comprehensive income to owners (USD) -36.3M -26.2M -35.3M -70.8M -138M -113M -112M -63.5M -39.3M 51.9M
Provision for credit losses (USD) — — — — 1M 100,000 600,000 100,000 0.00 0.00
Credit cost ratio (credit losses / average receivables) (%) — — — — 3.4% 0.2% 1.3% 0.2% 0.0% 0.0%
Reported Feb 19, 2019 Feb 19, 2019 Feb 19, 2019 Feb 21, 2020 Feb 19, 2021 Feb 16, 2022 Feb 21, 2023 Feb 11, 2026 Feb 11, 2026 Feb 11, 2026

Sign up to see institutional holdings

Sign Up

Podcast Mentions

Sign up to see podcast mentions and sentiment

Sign Up

By Q2

5 Nov, 2026

Share:

Independent testing gives banks and credit unions third-party evidence that Q2 Assistant meets rigorous security, safety and reliability standards

AUSTIN, Texas (November 5, 2026) – Q2 Holdings, Inc. (NYSE: QTWO), a leading provider of digital transformation solutions for financial services, today announced that Q2 Assistant has achieved AIUC-1 certification, an independent security, safety, and reliability standard for AI agents, making Q2 the first digital banking provider to achieve AIUC-1 certification, according to AIUC. The certification reflects adversarial technical testing and a third-party audit of the controls behind Q2 Assistant, including data isolation, permissions enforcement, interaction logging, and compliance controls.

As financial institutions scale AI, only 18% of banking executives say they are confident their AI controls would pass an independent audit. AIUC-1 helps provide that assurance in partnership with Grant Thornton in the U.S., the fifth-largest provider of professional services, tax and advisory services, through a combination of independent controls for auditing and adversarial technical testing.

The AIUC-1 standard spans six domains: data and privacy, security, safety, reliability, accountability, and societal impact. It also maps to established frameworks including ISO 42001, the NIST AI Risk Management Framework, the EU AI Act, MITRE ATLAS, and the OWASP Top 10 for LLM and agentic applications. Q2 Assistant was evaluated against real-world AI risks such as prompt injection, jailbreaks, unauthorized actions, data leakage, hallucination, and unsafe tool calls.

“Banks and credit unions hold every vendor to a high standard, and AI deserves the same scrutiny,” said Q2 Chief Risk Officer Blair Williams. “We built Q2 Assistant with governance in mind from the start, and we wanted independent validation that the controls behind it are operating as intended. The AIUC-1 report gives our customers credible, third-party evidence they can bring to their risk committees, boards, and regulators as they evaluate where and how to adopt AI responsibly.”

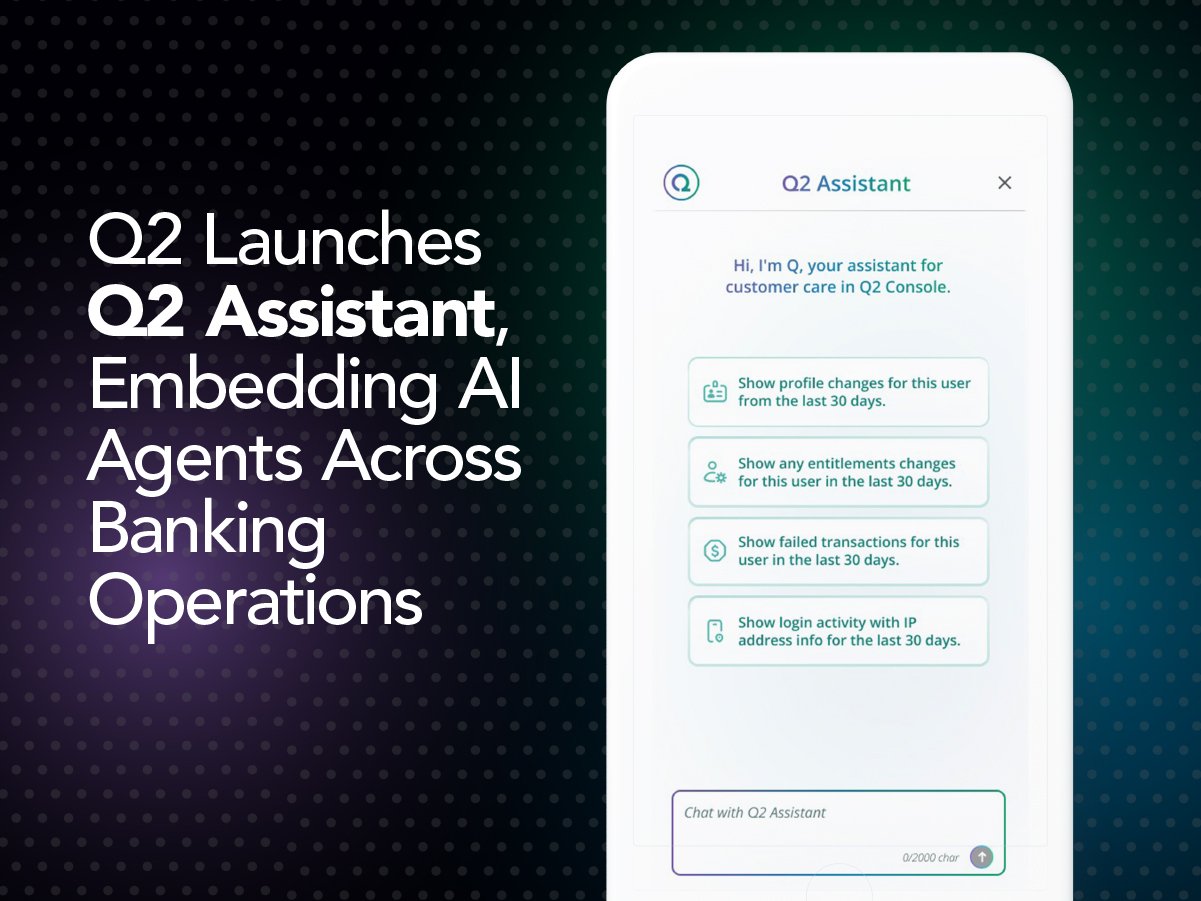
Q2 Assistant is the unified AI assistant experience embedded across Q2’s product portfolio, giving financial institution teams a single place to ask questions, find information, receive guidance, and complete tasks inside the banking workflows they already use. Through specialized, product-specific agents, Q2 Assistant can support and execute tasks within individual Q2 solutions while operating within the roles, permissions and controls established by each financial institution.

“At VeraBank, we are excited about the opportunities AI presents and believe responsible innovation starts with trust,” said VeraBank Senior Vice President & Digital Experience Officer Jeremy Cartwright. “Independent assurance helps confirm that appropriate AI controls are in place and working as intended, giving our stakeholders greater confidence as we responsibly expand our use of AI.”

“Financial institutions are being asked to adopt AI faster than their risk teams can evaluate it,” said AIUC Co-Founder Rajiv Dattani. “AIUC-1 gives them a common bar to hold vendors to, and Q2 is the first in digital banking to meet it. Just as important, certification isn’t a one-time event: Q2 Assistant will keep being re-tested as threats and capabilities change.”

“For financial institutions, trust is fundamental to adopting AI at scale,” said Nicole Julius, national managing partner of Enterprise Assurance Services at Grant Thornton LLP. “As AI becomes more deeply embedded in critical business operations, third-party assurance helps organizations know the controls behind these technologies can stand up to rigorous scrutiny. Q2’s AIUC-1 certification demonstrates how to build trust while continuing to innovate with confidence.”

The certification builds on Q2’s approach to embedding AI directly into banking workflows while maintaining the governance required by regulated financial institutions. Grounded in Q2’s Responsible AI Pledge , Q2 is committed to helping ensure financial technology remains secure, transparent, and built for the high trust standards of banking. To maintain certification, Q2 Assistant will continue to undergo quarterly adversarial testing under AIUC-1, so controls are re-tested as threats evolve and as new agents are brought into scope.

Hear directly from Q2, AIUC, and Grant Thornton on why Q2 pursued the certification and what any bank or credit union should ask before putting AI into its operations on Q2’s Purposeful Banker podcast.

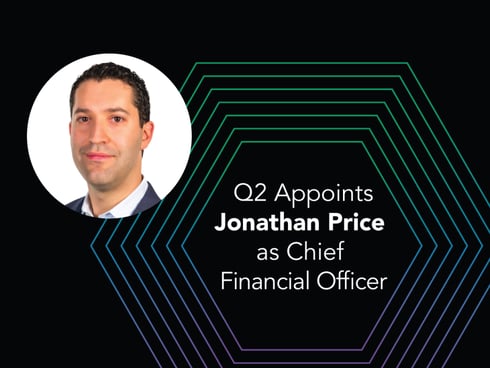
Price to serve as co-CEO alongside Matt Flake, who continues as president and chairman of the board

Price joins the Q2 Board of Directors and will continue to serve as chief financial officer during the Company’s search for a new CFO

AUSTIN, Texas (October 28, 2026)—Q2 Holdings, Inc. (NYSE: QTWO), a leading provider of digital transformation solutions for financial services, today announced that its Board of Directors has appointed Jonathan Price as Co-Chief Executive Officer, effective October 29, 2026. Mr. Price will serve as Co-CEO alongside Matt Flake, who will also continue in his roles as President and Chairman of the Board. As part of his appointment, Mr. Price also will be joining the Board of Directors. Mr. Price will continue to serve as the Company’s Chief Financial Officer, a position he has held since 2024, while Q2 conducts a search for his successor.
“Jonathan is a highly talented executive who has been a driving force behind Q2’s strategy, financial discipline, and growth for nearly a decade,” said Matt Flake, CEO, President, and Chairman of Q2.

AUSTIN, Texas (October 28, 2026)—Q2 Holdings, Inc. (NYSE: QTWO), a leading provider of digital transformation solutions for financial services, today announced results for its third quarter ending September 30, 2026.

GAAP Results for the Third Quarter 2026

•Revenues of $225.8 million, up by 12 percent compared to the prior-year quarter and 3 percent from second quarter 2026.

•GAAP gross margin of 59.7 percent, up from 54.0 percent in the prior-year quarter and 59.2 percent in second quarter 2026.

•GAAP net income of $33.2 million, up from $15.0 million for the prior-year quarter and $29.9 million for second quarter 2026.

Non-GAAP Results for the Third Quarter 2026

•Non-GAAP gross margin of 62.6 percent, up from 57.9 percent for the prior-year quarter and 62.3 percent in second quarter 2026.

•Adjusted EBITDA of $67.8 million, up from $48.8 million for the prior-year quarter and $62.8 million for second quarter 2026.

For a reconciliation of our GAAP to non-GAAP results, please see the tables below.

“We delivered another strong quarter, with solid bookings led by digital banking and continued momentum across the business,” said Matt Flake, Chairman, President and CEO, Q2.

Prompts

Q2 Holdings, Inc. (ticker QTWO), listed in United States.

Company History

Date Change Detail
Dec 20, 2013 Renamed CBG Holdings, Inc. → Q2 HOLDINGS, INC.

ETFs Holding Q2 Holdings, Inc.

ETF Weight in ETF Shares Market value As of
TMFS 5.28% 47,287 $ 3.076M Aug 31, 2026
AFSC 2.69% 4,424 $ 269.289K Jul 31, 2026
TOGA 2.43% 91,013 $ 4.378M Jun 30, 2026
RSMC 2.07% 205,729 $ 15.162M Nov 17, 2026
FFOX 1.26% 62,793 $ 3.02M Jun 30, 2026
SMLL 1.20% 2,246 $ 166.092K Nov 13, 2026
LITL 0.57% 459 $ 32.231K Nov 17, 2026
SIXL 0.48% 13,888 $ 1.013M Nov 12, 2026
SYZ 0.43% 6,135 $ 295.094K Jun 30, 2026
FSCC 0.38% 21,342 $ 1.388M Aug 31, 2026
AVSC 0.23% 99,778 $ 7.354M Nov 16, 2026
SMIZ 0.21% 8,954 $ 582.368K Aug 31, 2026
MKTN 0.18% 4,006 $ 192.689K Jun 30, 2026
VFQY 0.17% 13,663 $ 888.642K Aug 31, 2026
SEIS 0.17% 20,608 $ 991.245K Jun 30, 2026
FESM 0.16% 197,186 $ 9.485M Jun 30, 2026
JMEE 0.16% 63,379 $ 4.45M Nov 17, 2026
RESM 0.15% 117 $ 5,627.70 Jun 30, 2026
ESSC 0.14% 816 $ 49.67K Jul 31, 2026
IVSS 0.12% 688 $ 33.093K Jun 30, 2026
FSEG 0.11% 125 $ 6,012.50 Jun 30, 2026
DFAS 0.09% 418,048 $ 30.497M Nov 12, 2026
SMDX 0.05% 861 $ 63.456K Nov 17, 2026
FEAC 0.04% 226 $ 10.871K Jun 30, 2026
JSTC 0.03% 1,308 $ 96.4K Nov 17, 2026
MSSM 0.02% 2,272 $ 147.771K Aug 31, 2026
DFSU 0.01% 4,723 $ 344.543K Nov 12, 2026
DFAC 0.01% 132,682 $ 9.679M Nov 12, 2026
DCOR 0.01% 40,137 $ 2.928M Nov 12, 2026
DXUV 0.01% 5,160 $ 376.422K Nov 12, 2026
DFAU 0.00% 8,776 $ 640.209K Nov 12, 2026
DFUS 0.00% 13,799 $ 1.007M Nov 12, 2026
EBI 0.00% 14 $ 910.56 Aug 31, 2026
AVSU 0.00% 54 $ 3,979.80 Nov 16, 2026